A membrane-free ferrocene-based high-rate semiliquid
|
|
|
- George Cole
- 5 years ago
- Views:
Transcription
1 Supporting Information A membrane-free ferrocene-based high-rate semiliquid battery Yu Ding,, Yu Zhao,, and Guihua Yu, * Materials Science and Engineering Program and Department of Mechanical Engineering, The University of Texas at Austin, Austin, TX 78712, USA. These authors contributed equally to this work. *Corresponding to: ghyu@austin.utexas.edu 1
2 Experimental Section Materials: Li metal, ferrocene (98%), lithium nitrate (LiNO 3, 99%), ferrocenium hexafluorophosphate (97%), lithium hexafluorophosphate ( 99.99%) and lithium bis(trifluoromethane) sulfonimide (LiTFSI, 99.95%) were purchased from Sigma Aldrich. Organic electrolyte (1 M LiPF 6 in ethylene carbonate (EC)/diethyl carbonate (DEC) with volume ratio of 1:1), 1,3-dioxolane (DOL) and 1,2-dimethoxyethane (DME) were purchased from BASF. Carbon paper was from Fuel Cell Store. LiNO 3 was dried at 120 C under vacuum for 24 hours before use, and the other chemicals were used as received without further purification. Li anode passivation and self-discharge test: Li metal was soaked in 0.2 M LiNO 3 /0.5 M LiTFSI in DOL/DME (volume 1:1) to form a protective layer in advance. [10] The passivated Li metal was extensively rinsed with EC/DEC electrolyte before use. In the self-discharge test, the passivated Li metal was cut into one 0.5 cm 0.5 cm plate, and then immersed into 1 mm ferrocenium in EC/DEC. The reaction between passivated Li and ferrocenium catholyte was monitored by UV-Vis spectroscopy in the wavelength range nm at different time intervals. Cell assembly and characterization: Carbon paper was punched into circular disks with diameter of 12 mm as current collector. Ferrocenium hexafluorophosphate with concentrations of 0.05, 0.1, 0.2, 0.4 and 0.6 M with 1 M LiPF 6 and 0.1 M LiNO 3 in EC/DEC (volume 1:1) was prepared as catholyte, with mass loading in the range of mg cm 2. The electrochemical performance of the cell was evaluated in 2032 coin cell. First, 10 µl catholyte was added into the carbon paper current collector, which was covered by a Celgard 2400 separator. 5 µl blank organic electrolyte was added between the Celgard 2400 separator and passivated Li metal 2
3 anode. The cut-off voltage was set to V. The density of carbonate electrolyte is about 1.2 g cm 3, thus the conversion coefficient from W L 1 to W kg 1 is estimated to be ~0.83. Instrumentations: Galvanostatic charge/discharge measurements and polarization test were carried out on a BioLogic VMP3 potentiostat. RDE tests were performed using BioLogic RRDE-3A rotating ring disk electrode apparatus. Glassy carbon electrode tip and platinum wire were used as the working electrode and counter electrode, respectively. The reference electrode is Ag/AgCl (0.01 M AgNO 3 /0.1 M TBAP in acetonitrile). UV-Vis spectra were recorded on Thermo scientific Evolution 300. SEM images were recorded using Hitachi S-5500 scanning electron microscope (S-5500). Table S1 Standard rate constant of ferrocene/ferrocenium in different organic solvents. Solvent Acetonitrile (AN) 2.6 Acetone (AC) 2.0 ButyronitriIe (BuN) ,2-Dichloromethane (DCE) 0.34 Dichloromethane (DCM) 0.62 Dimethylformamide (DMF) 0.40 Dimethylsulphoxide (DMSO) 0.20 Propylene carbonate (PC) 0.15 Tetrahydrofuran (THF) 0.14 Methanol (MeOH) 1.55 Ethanol (EtOH) Propanol (PrOH) 0.28 Standard rate constant (cm s 1 ) 3
4 Table S2 Standard rate constant of redox couples in conventional redox-flow batteries Redox couple Standard rate constant (cm s 1 ) Electrode Fe 3+ /Fe Au (111) Cr 3+ /Cr Hg VO + 2 /VO Graphite V 3+ /V Hg Ce 4+ /Ce Pt Br 2 /Br Vitreous carbon 4
5 Figure S1 Reaction of passivated Li metal with ferrocenium investigated by UV-vis spectroscopy. Passivated Li metal was immersed into ferrocenium/ec/dec/lipf 6 solution and the spectra were recorded after some intervals. 5
6 Figure S2. Self discharge test of freshly prepared battery. The discharge voltage profile of the battery before rest and then rested for 1 hour. 6

 fresh")
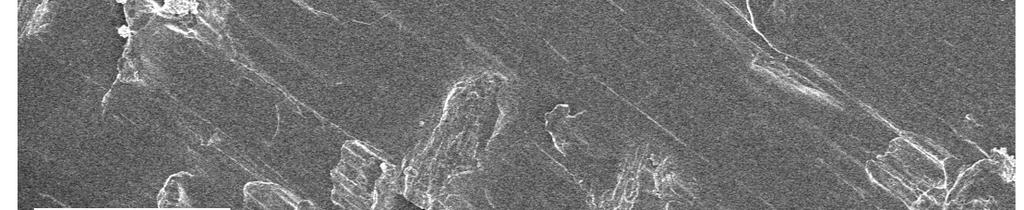
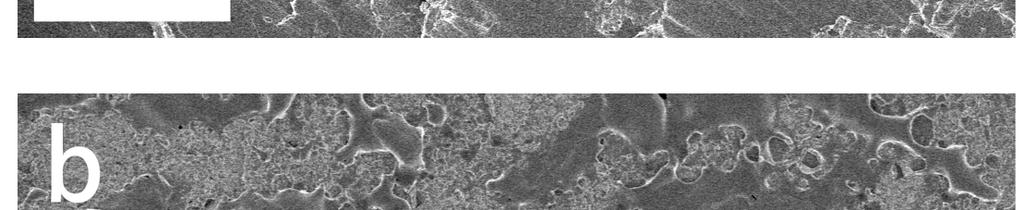


7 Figure S3. SEM images of (a) fresh Li electrode; (b) passivated Li electrode; (c) passivated Li electrode after cycling test. All scale bar is 200 µm. 7
8 Figure S4. Charge-discharge curves of the semi-liquid battery at a current rate of 30 C with different ferrocenium concentrations. 8
9 Figure S5. Power density (black) and Coulombic efficiency (red) of the constructed semiliquid battery at different catholyte concentrations. 9
10 Figure S6. Energy density of the semi-liquid battery versus catholyte concentration in organic electrolyte. 10