p-cat Pipeline Condition Assessment Technique for Water and Sewer Mains Inverse Transient Analysis Pipeline Condition Assessment
|
|
|
- Lily Freeman
- 5 years ago
- Views:
Transcription


1 p-cat Pipeline Condition Assessment Technique for Water and Sewer Mains Inverse Transient Analysis Pipeline Condition Assessment Dr Young-il Kim Project Director of Detection Services Pty Ltd Water NZ 2017

2 Pipe Condition Assessment For accessing the remaining life of ageing pipelines: are a key area when developing a future maintenance plan


3 p-cat TM Previously, there have been little to no technologies that could assess and calculate wall thickness over long distances. p-cat TM fills this void as a long-distance, non-invasive scanning tool that can split pipelines into 10 meter sections with pipe wall thicknesses of 0.2 mm resolution, and provide localized faults.
4 p-cat - Advantages and Performance Cost effective pipeline condition assessment method for relatively long distance pipeline section (over 2 km) with +/- 10 m spatial accuracy. Sub-sectional pipeline condition assessment with various resolutions from 10 m using only one set of tests both between measurement points and out of the boundary. Identification of pipeline anomalies (localized fault detection) Detects pipeline characteristics and anomalies which can be confirmed using a point sampling technique. Saving a lot of time and money. Various pipe diameters and materials (metallic, concrete and AC).
5 Fundamental Physical Mechanisms There is a correlation between changes in the thickness of metal and cement mortar lining forming a pipeline wall and the speed with which a wavefront from a hydraulic transient propagates along the pipeline. Changes in this thickness give rise to reflections which can be theoretically interpreted to obtain a distribution of damage in the pipe. Head (m) Initial transient arrival Steady state flow condition Anomaly C H1: Maximum pressure jump by Anomaly C H0: Pressure jump by injected transient Anomaly D H2: Minimum pressure jump by Anomaly C H3: Pressure jump by Anomaly D 58.8 Pipe wall damage or lining loss has a visible impact on a resultant transient pressure wave trace Time (s)

6 Fundamental Physical Mechanisms a = speed of propagation of hydraulic transient pressure wave K = bulk modulus of water ID = 727.5mm OD = 762mm ρ = density of water E = Young s modulus of elasticity of the pipeline wall material D = internal diameter of the pipeline e eq = wall thickness of a single material pipe or the total equivalent wall thickness of the composite material pipe ψ = pipeline restraint factor. e s = 4.7mm e c = 12.5mm

7 Example Field Signals Major Boundary Reflection, Wall Thickness/Material Change and Localized Fault
8 Anomaly O Anomaly L/M: Change in material and/or material properties Normalised Head(m) Initial Transient Arrival Reverse Time Shift Day4_Test1_2 Anomaly N: Nearby identified GEN M1 feature Time shifted plots M2 Closed offtake time(s) RV24363 Normalised Head(m) Initial Transient Arrival T U V Time Shift Day4_Test3_1 Reflection from open offtake (RV24331) location of K (500m upstream of G) Reflection from closed valve time(s) Anomaly N: Nearby identified feature Closed offtake RV24363 GEN M1 M2 Time shifted plots
9 Signal Analysis P-CAT analysis uses two main techniques for interpreting the results from the transient pressure wave tests: Sub-Section Partitioned Wave Speed Analysis Assessment of the level of deterioration in a sub-section Localised Fault Detection Significant anomalies such as air pockets and blockages
10 What Does It Deliver? This theory has been developed into a non-invasive technique which can determine: Remaining Wall Thickness including corrosion and cement mortal lining spalling Locations of air/gas pockets and blockages The sealing status of valves Unknown connections and branches


11 Testing Equipment - Generation Point


12 Testing Equipment - Measurement Point
13 Typical configuration for test series Pump Station (PSKS) XFK X07 XFK X08 XSK X11 XFK X09 XFK X10 XSK X12 XFK X21 XFK X22 PIT #q XF XA XKK6TB XKK6TA Section 9 Section 8 Section 7 Section 6 Section 5 Section 4 Section 3 Section 2 Section 1 Distance (m) Chainage (m) Day1-Test1 M1 G M2 Day1-Test2 M2 M1 G Day2-Test1 M1 G M2 Day2-Test2 M2 M1 G Day2-Test3 M1 G M2 Day2-Test4 M2 M1 G Day2-Test5 G M1 M2 Day2-Test6 M1 G M2 G: Transient Generator M1 and M2: Measurement Stations
14 Average Condition vs. Sub-Sectional Condition The p-cat method could identify this corroded section from within the 500 metres, allowing for targeted repair or replacement and minimising risk while saving considerable cost. 85% wall thickness remaining Average remaining wall is determined to be 83.5% remaining using continuous low resolution method(s) 10m 85% wall thickness remaining 79 % 83 % 85 % 86 % 83 % 83 % 79 % 76 % 30 % 79 % 86 % 87 % 87 % 89 % 86 % 86 % 79 %

15 Sub-Sectional Pipeline Condition Assessment

16 Identification of Anomalies

17

18


19 Wall Thickness (mm) Verification of Technique Sections of recovers pipe Avg. wall thickness Position 1 Position 2 Position 3 Position 4 Avg. wall thickness Position 5 Position 6 Position 7 Position Dimensionless Pressure Chainage (m)


20 Case Study #1_Water Main

21 Localised Fault Detection Results

22 Sub-sectional Pipe Wall Condition Results
23 Case Study #1_Water Main


24 Case Study #1_Water Main 2% of the pipeline was found to be in the most deteriorated condition with a remaining wall thickness of between 50% and 64%. 68% of the pipeline showed to have some deterioration with a remaining wall thickness of between 70% and 84%. The rest of the pipeline (29% of the total length) has remaining wall thicknesses of between 85% and 90%.

 water main was constructed from 450 CI in 1886 and later concrete lined in-situ in 1982.")
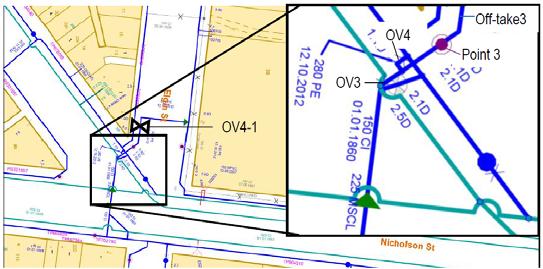
25 Case Study #2_Water Main The tests undertaken on this pipeline were conducted as part of a condition assessment project for a system in a busy CBD area. This particular section was one of two parallel pipelines following a busy main road into the city. The 450 CI(CL) water main was constructed from 450 CI in 1886 and later concrete lined in-situ in The pipe section of interest was 2.8 km and contains two replacement sections of 450 MSCL.


26 Case Study #2_Water Main


27 Case Study #3_Water Main The pipeline of interest is the first 10 km of the 23.5 km long rising main beginning at a dam pump station. The water rising main was constructed of MSCL, with a 1085 mm outside diameter. For the sections with an original wall thickness of 8 mm: o 1.7% of the length of the pipeline was found to have the highest deterioration with remaining wall thickness of between 67% and 80%. o 9% of the pipeline showed to have remaining wall thickness of between 80% and 90%. Fourteen anomalies representing: o The presence of a blockage or partially closed isolation valve at an isolating valve pit at km. o Four short lengths of deterioration or replacement of lower wave speed pipe material. o Four short lengths of deterioration, replacement of lower wave speed pipe material, or branch of a known pipe feature o Five potential concrete encasement sections or the presence of a blockage.

28 Case Study #3_Water Main

29 Case Study #3_Water Main
 constructed in 1893 with")
, 600 WI and 600 Mild Steel Locking Bar (MSLB) constructed in 1916 with in-situ cement lining")
30 Case Study #4_Water Main The trunk water main consists of the following various pipe materials and sizes, including some sections with in-situ cement lining: 450 and 525 Wrought Iron (WI) constructed in 1893 with in-situ cement lining added in , 700 and 825 Mild Steel Cement Lined (MSCL) constructed in Cast Iron (CI), 600 WI and 600 Mild Steel Locking Bar (MSLB) constructed in 1916 with in-situ cement lining added in 1983.

31 Case Study #4_Water Main


32 Case Study #5_Sewer Rising Main The sewer rising main was approximately 1.2 km consisting of predominantly D.N.300 AC. The pipeline section of interest lies between a pump station and an inlet of a sewerage treatment plant.

33 Case Study #5_Sewer Rising Main

34 Case Study #5_Sewer Rising Main


35 Case Study #6_ Sewer Rising Main


36 Case Study #6_ Sewer Rising Main

37 Case Study #6_ Sewer Rising Main


38 Case Study Valve Sealing Corroded valve Evaluation of transient techniques undertaken at Iron Knob
39 Field Program For 62 different clients Such as water utilities, councils, contractors and mining companies For over 176 different pipeline systems For over 1500km of pipeline


40 Thank You