MEMBRANE ELECTRODE ASSEMBLY (MEA) DESIGN FOR POWER DENSITY ENHANCEMENT OF DIRECT METHANOL FUEL CELLS (DMFCS)
|
|
|
- Shauna Maxwell
- 5 years ago
- Views:
Transcription
1 MEMBRANE ELECTRODE ASSEMBLY (MEA) DESIGN FOR POWER DENSITY ENHANCEMENT OF DIRECT METHANOL FUEL CELLS (DMFCS) A Dissertation Presented to The Academic Faculty by Laam Angela Tse In Partial Fulfillment of the Requirements for the Degree of Doctor of Philosophy in the School of Mechanical Engineering Georgia Institute of Technology August 2006 COPYRIGHT 2006 BY LAAM A. TSE
2 MEMBRANE ELECTRODE ASSEMBLY (MEA) DESIGN FOR POWER DENSITY ENHANCEMENT OF DIRECT METHANOL FUEL CELLS (DMFCS) Approved by: Dr. David W. Rosen, Advisor School of Mechanical Engineering Georgia Institute of Technology Dr. Peter J. Hesketh School of Mechanical Engineering Georgia Institute of Technology Dr. Meilin Liu School of Materials Science and Engineering Georgia Institute of Technology Dr. Comas L. Haynes Georgia Tech Research Institute Georgia Institute of Technology Dr. S. Mostafa Ghiaasiaan School of Mechanical Engineering Georgia Institute of Technology Date Approved: [June 12, 2006]
3 ACKNOWLEDGEMENTS I feel extremely blessed to know so many kind and talented people through all of my years at Georgia Tech. I am grateful for their friendship, help, encouragement, and support. First, I would like to thank my advisor, Dr. Daivd W. Rosen, for providing this opportunity for me to continue my PhD at Georgia Tech. His constant encouragement and valuable guidance are essential for the completion of this thesis. I will be always inspired by the high standards he sets for himself and his sharp focus and deep devotion to whatever he works on. I would like to thank my thesis committee members: Drs. Peter J. Hesketh, S. Mostafa Ghiaasiaan, Meilin Liu, and Comas Haynes for taking invaluable time to serve on my committee and for their advices and suggestions throughout this project. During the course of my research, I benefit a lot from the technical discussions with Dr. Siwen Li, Dr. Jian Dong, Yuelan Zhang in fuel cell and electrochemistry topics. I would also like to thank for the great help from John Graham, Steven Sheffield, Kyle French, YangYang Sun, Kai Liu, Mahesh Shenoy, Arnab Choudhury, Dr. Young-Bin Park. I also would like to thank the group members from System Realization Laboratory (SRL) for the kindness help and support during the tough moments of my PhD years. Without their help, I would have a harder time passing my qualify exams and finishing my PhD dissertations. iii
4 Finally, a lot of credit goes to my parents. Their unconditional love and supports have always helped me in all my endeavors. Last but not least, I would like to thank my dearest husband, Ken Leung, for his love, patience, encouragement, and support. iv
5 ACKNOWLEDGEMENTS LIST OF TABLES LIST OF FIGURES SUMMARY TABLE OF CONTENTS Page iii ix x xv CHAPTER 1 INTRODUCTION DMFC Working Mechanism Research Question & Hypotheses Research Roadmap Thesis Organization CHAPTER 2 LITERATURE SURVEY State-of-the-art passive DMFCs Current DMFC Technical Issues Methanol Crossover Slow Reaction Rates Bubble Removal Problem System Integration Manufacturing Problems Reliability and Cost Problems Current Research Status on Technical Issues Methanol Crossover Slow Reaction Rates System Integration Bubble Removal Problem Manufacturing and Design Problems Reliability and Cost Problems Summary CHAPTER 3 THEORY Polarization Curves of DMFCs Activation Losses Ohmic Losses Concentration or Mass Transport Loss Fuel Crossover & Internal Currents Overall Operational Cell Voltage Mechanics of Corrugation Forming Elongation Residual Stresses Springback Wrinkling v
6 3.2.5 Bending Process Stretching Process Failure Modes Summary CHAPTER 4 GEOMETRIC ANALYSIS Background Definition of Figure of Merit, A/V Geometric Models Planar Design D Corrugations D Rectangular Manifold D Triangular Manifold D Square Tile Corrugations A/V Comparisons for All Geometries Performance Roadmap Performance Roadmap Limitations Summary CHAPTER 5 BASELINE MEA FABRICATION AND RESULTS MEA Fabrication Process Proton Electrolyte Membrane (PEM) Electrodes Hotpress MEA Reconditioning Testing Process Test Cell Test Setup Testing Conditions Test Protocol Performance Results Repeatability Tests Reactive Area vs. Power Density Summary CHAPTER 6 CORRUGATED MEA FABRICATION AND RESULTS Alternative Manufacturing Processes to Form Corrugated MEAs Method Method Method Method Forming Process Mold Design and Fabrication Pressing process 2D and 3D corrugations Folding process - 2D corrugations Testing Procedures vi
7 6.4 Experimental Results Pressing Process Folding Process Corrugated MEAs with aspect ratio = Corrugated MEAs with aspect ratio = Summary CHAPTER 7 MANUFACTURING PROCESS SIMULATIONS Problem FEM Analysis Processes Pre-processing Geometric Modeling and Assembly Material Properties Element Type and Meshing Contact Interactions Boundary Conditions Analysis Procedure Results & Discussions Plastic Strain Distribution of a Fixed-end Model Plastic Strain Distribution of Free-end Model Parametric Results of Free-fixed Ends Model Die Radius vs. Maximum Plastic Strain Punch Radius vs. Maximum Plastic Strain Corrugation Aspect Ratio vs. Maximum Plastic Strain Mold Geometry Optimization Physical Interpretation Summary CHAPTER 8 ROOT CAUSE ANALYSIS AND PERFORMANCE PREDICTION Root-Cause Analysis of Performance Reduction Mechanical Deformations Impedance Measurement Ohmic Resistance Polarization Resistance Performance Reduction vs. System Resistance Increment Four-Point Probe Measurement Nafion Membrane Thinning Sources of Bulk Resistance Performance Prediction Performance Reduction vs. Area Enhancement Experimental Results Modified Performance Roadmap Summary CHAPTER 9 STACKING CONFIGURATION DESIGN Requirements for Passive Fuel Cell Stacks Configurations vii
8 9.2 Corrugated Stacking Configurations Planar MEA Stack Corrugated MEA Stack Tubular MEA Stack D Square-Tile MEA Stack Results A/V vs. Aspect Ratio of Corrugations A/V vs. Individual MEA Technical Issues of Corrugated System Integrations Structural Support Perimeter Seal & Contact Resistance Interconnects Fuel Injection Summary CHAPTER 10 CONCLUSIONS AND RECOMMENDATIONS Conclusions Recommendations for Future Work APPENDIX A 171 APPENDIX B 173 REFERENCES 179 viii
9 LIST OF TABLES Page Table 1.1: Summary of project objectives and research tasks... 9 Table 4.1: The summary of parameters used for geometric analysis Table 5.1: Platinum loading on anode and cathode of MEA used for repeatability test.. 68 Table 5.2: Platinum loadings on anode and cathode of MEAs used for correlation study of reactive area versus power density Table 7.1: The geometric parameters of fixed-end model Table 7.2: The geometric parameters of free-end model Table 7.3: The geometric parameters of optimized mold geometries model Table 8.1: Maximum PEMAG within the MEA Table 8.2: Ohmic resistances of planar and 2D corrugated MEAs Table 8.3: Polarization resistances of planar and 2D corrugated MEAs at different operating voltages Table 8.4: System resistances of planar and 2D corrugated MEAs at different operating voltages Table 8.5: Nafion thickness and OCVs Table 8.6: Summary of performance loss due to 2D corrugation of rectangular geometry with aspect ratio of Table 8.7: Summary of performance loss due to 2D corrugation of rectangular geometry with aspect ratio of Table 9.1: Parameters used for A/V calculation ix
10 LIST OF FIGURES Page Figure 1.1: The working mechanism of the proton exchange membrane fuel cells (PEMFCs) Figure 1.2: The schematic of MEA structure... 5 Figure 1.3: The schematic of DMFC working mechanism... 5 Figure 1.4: The schematic of an MEA integrated with serpentine reactant flow channels. 6 Figure 1.5: The schematic diagram of detail research approaches Figure 2.1: A Micro-Tubular Fuel Cell contains multiple tubular membrane / electrode assemblies that operate in an oxygen/hydrogen cross flow Figure 3.1: Generalized polarization curve of a fuel cell showing regions dominated by different types of losses Figure 3.2: Outline of a tensile-test sequence showing different stages in the elongation of the specimen Figure 3.3: Comparison of engineering stress-strain curve and true stress- strain curve. 32 Figure 3.4: Bending terminology. The bending radius is measured to the inner surface of the bend. Note that the length of the bend is the width of the sheet. Also note that the bend angle and the bend radius (sharpness of the bend) are two different variables Figure 3.5: Steps of drape forming operation Figure 4.1: Micro-Bore electrodes with acid-gel electrolyte Figure 4.2: Cross-section of the two waved tube cell (WTC) designs: (a) waved MEA is supported by ribbed graphite plates and (b) waved MEA is supported by waved expanded metal structure Figure 4.3: The cross-sectional schematic of a 1-D planar MEA fuel cell design with upper channels for airflow and lower channels for fuel supply (Not draw to scale) Figure 4.4: The cross-sectional schematics of the 2-D rectangular manifold (top) and the MEA (bottom) Figure 4.5: The isometric image of 2-D triangular corrugated MEA x
11 Figure 4.6: The cross-sectional schematic of the 2-D triangular MEA manifold and zoom in image of MEA structure Figure 4.7: The isometric image of 3-D square tile corrugated MEA Figure 4.8: The comparison plot between the A/V of different MEA geometric patterns Figure 4.9: The A/V plot of triangular MEA manifold with respect to the corrugation angle,θ, assuming c and w are constant Figure 4.10: The performance roadmap for MEA geometry design Figure 4.11: The minimum corrugation width Figure 5.1: MEA with carbon cloth electrodes with current leads Figure 5.2: The cathode side of the cell (left) and the side view of the cell assembly with inlets and outlets of the methanol and water chamber (right) Figure 5.3: The cross-sectional schematic of polymer test cells for 3-D corrugated MEAs Figure 5.4: The schematic diagram of performance test setup Figure 5.5: Polarization curves of repeatability test of 4cm 2 cells Figure 5.6: Power density curves of repeatability test of 4cm 2 cells Figure 5.7: (A) is the side view of a fuel cell assembly with MEA clamped between two graphite bipolar plates machined with serpentine flow channels. (B) is the A-A crosssectional view figure (A). The equal distance between the reactive areas to the nearest channel ribs for current collection is shown in blue arrows Figure 5.8: The schematic diagram of electrodes with current collection lead. The path and distance differences from different reaction sites are shown in yellow dashed lines. 72 Figure 5.9: Polarization curves of repeatability test of 4cm 2 cells Figure 5.10: The power density curves of different sizes of MEAs Figure 5.11: The relationship between the maximum power density and MEA sizes Figure 6.1: Liquid casting processes of Nafion. (A) High aspect ratio geometries; (B) low aspect ratio geometries xi
12 Figure 6.2: (A) 3D Woven Pressure Vessel. (B) Carbon fiber cone of a speaker, (C) carbon fiber sleeve Figure 6.3: The schematic diagram of corrugated paper cardboard forming process with rotational molds Figure 6.4: CNC machined Aluminum molds (left) 2cmx2cm, 3D corrugation aspect ratio= 0.25 and (right) 5cmx5cm, 2D corrugation aspect ratio= Figure 6.5: The schematic diagrams of pressing process to form MEA corrugations Figure 6.6: The schematic diagram of folding process to form MEA corrugations one by one Figure 6.7: The image of aluminum molds with 2D corrugations and alignment pins Figure 6.8: Corrugated MEA patterned with 3D dome-shaped geometry (aspect ratio = 0.25) Figure 6.9: Deformations on corrugated MEA patterned with 3D dome-shaped geometry (aspect ratio = 0.5) Figure 6.10: Projected power density comparison of the planar and 3D corrugated shapes of the MEA Figure 6.11: Images of corrugated MEAs with aspect ratio of (A) 1.25, (B) Figure 6.12: Image of a MEA with rectangular corrugations (Aspect Ratio =0.75). A crack was found on the carbon cloth Figure 6.13: 3D corrugated MEA with delaminated carbon fibers after corrugations are formed one by one (Aspect ratio = 0.75) Figure 6.14: The power density curve comparison of MEA 24 before and after the corrugation process Figure 6.15: The polarization curve comparison between the planar and corrugated geometries of MEA 19 and MEA Figure 6.16: The power density curve comparison of planar and corrugated MEA 19 and MEA Figure 6.17: The polarization curve comparison of planar and corrugated MEA26, MEA 27, MEA 28, and MEA xii
13 Figure 6.18: The power density curve comparison of planar and corrugated MEA26, MEA 27, MEA 28, and MEA Figure 6.19: The projection of current performance status on the performance roadmap of corrugated MEAs Figure 7.1: The schematic diagram of sheet metal forming process Figure 7.2: The schematic diagram of the boundary conditions of the pressing process Figure 7.3: The schematic diagram of the boundary conditions of the first corrugation of folding process Figure 7.4: The schematic diagram of the boundary conditions of the folding process after the first corrugation Figure 7.5: Schematic diagram of die and punch radius Figure 7.6: The stress-strain curve of Nafion 115 at room temperature Figure 7.7: PEMAG distribution of the fixed-end boundary conditions model Figure 7.8: PEMAG distribution of free-end boundary conditions model Figure 7.9: The relationship between MEA maximum plastic strain magnitude and die radius was determined from ABAQUS models Figure 7.10: The relationship between MEA maximum plastic strain magnitude and punch radius was determined from ABAQUS models Figure 7.11: The relationship between MEA maximum PEMAG and aspect ratio of the corrugation was determined from ABAQUS models Figure 7.12: Plastic strain magnitude (PEMAG) distribution of the optimized geometric parameters of the molds Figure 8.1: Impedance plot for Planar MEA 27 operating at 0.5V Figure 8.2: Impedance plot for Planar MEA 27 operating from 0.1V to 0.5V Figure 8.3: Impedance plots of MEA 27 (planar and 2d) operating at 0.1, 0.3, and 0.45V Figure 8.4: Impedance plots of MEA 28 (planar and 2d) operating at 0.1, 0.3, and 0.45V xiii
14 Figure 8.5: Impedance plots of MEA 29 (planar and 2d) operating at 0.1, 0.3, and 0.45V Figure 8.6: The schematic diagram of 4-point probe Figure 8.7: The electrical circuitry of 4-point probe setup Figure 8.8: Sheet resistance comparison of the anode before and after the corrugation process Figure 8.9: Sheet resistance comparison of the cathode before and after the corrugation process Figure 8.10: Concentration effects on the performance of MEA 27 before and after the corrugation forming process Figure 8.11: Concentration effects on the performance of MEA 28 before and after the corrugation forming process Figure 8.12: Polarization and power density curves of the passive DMFCs with various membranes operated with 2.0M methanol Figure 8.13: OCV drop versus Nafion thickness difference relative to Nafion Figure 8.14: Modified performance roadmap for 2D rectangular corrugated MEAs Figure 9.1: The top view of the planar MEA stack Figure 9.2: The top view of corrugated MEA stack Figure 9.3: The top view of tubular MEA stack Figure 9.4: Side view of horizontal stacking configuration of 3D square tile MEAs Figure 9.5: A/V comparison plot of planar, tubular, and triangular MEA stacks Figure 9.6: A/V comparison plot of planar, tubular, and triangular MEA single cells Figure 9.7: Corrugated MEA stack with spacers Figure 9.8: The electrical interconnects of fuel cell stack Figure 9.9: Fuel reservoir design for passive DMFC systems xiv
15 SUMMARY Micro-direct methanol fuel cells (μ-dmfc) can be the power supply solution for the next generation of handheld devices. The applications of the μ-dmfcs require them to have high compactness, high performance, light weight, and long life. The major goal of this research project is to enhance the volumetric power density of direct methanol fuel cells (DMFCs). A performance roadmap has been formulated and showed that patterning the planar membrane electrode assembly (MEA) to 2-D and 3-D corrugated manifolds can greatly increase the power generation with very modest overall volume increases. In this project, different manufacturing processes for patterning MEAs with corrugations have been investigated. A folding process was selected to form 2D triangular corrugations on MEAs for experimental validations of the performance prediction. The experimental results show that the volumetric power densities of the corrugated MEAs have improved by about 25% compared to the planar MEAs, which is lower than the expected performance enhancement. ABAQUS software was used to simulate the manufacturing process and identify the causes of deformations during manufacture. Experimental analysis methods like impedance analysis and 4 point-probes were used to quantify the performance loss and microstructure alteration during the forming process. A model was proposed to relate the expected performance of corrugated MEAs to manufacturing process variables. Finally, different stacking configurations and issues related to cell stacking for corrugated MEAs are also investigated. xv
16 CHAPTER 1 INTRODUCTION Air pollution and natural resources depletion encourage the development of various types of fuel cell systems to generate electricity in an environmentally friendly fashion. Different fuel cell technologies can be used to target different applications, such as high temperature solid oxide fuel cells (SOFC) for power plant, and low temperature (below 100 o C) operated proton exchange membrane fuel cell (PEMFC) for portable devices or automotive applications [1]. Hydrogen gas or methanol is commonly used as the fuel for PEMFC. Hydrogen gas operated PEMFCs must have either a gas reformation process unit attached to the fuel cell or they need to carry a compressed hydrogen gas cartridge, which is expensive and dangerous for portable applications [2]. However, PEM fuel cells are favored for use in automobiles due to their high power density, relatively quick start-up, rapid response to varying loads, and lower operating temperatures. PEMFCs are also called solid polymer electrolyte fuel cells (SPEFC). PEM fuel cells are low-temperature fuel cells, generally operating between o C. A PEM fuel cell consists of a proton exchange membrane and two electrodes (anode and cathode), as shown in Figure 1.1. The sandwich structure of a catalyzed membrane and the backing layers is also called a membrane electrode assembly (MEA). Each electrode has a porous and electrically conductive backing layer to supply the reactant gas to the active area where the noble metal catalyst is in contact with the ionic and electronic conductor. When hydrogen gas from the anode diffuses through the porous backing layer to the active area, hydrogen molecules are oxidized to hydrogen ions and free electrons in 1
![the presence of the platinum catalyst [3]. The hydrogen ions are conducted through the high acidity and ionic conductive membrane and eventually reach the cathode.](/docs-images/88/115672173/images/17-0.jpg "Free electrons generated at the anode are conducted back to the cathode after passing through an external circuit as current flow for power generation.")
17 the presence of the platinum catalyst [3]. The hydrogen ions are conducted through the high acidity and ionic conductive membrane and eventually reach the cathode. Free electrons generated at the anode are conducted back to the cathode after passing through an external circuit as current flow for power generation. At the cathode, oxygen molecules diffused from the air stream are reduced to oxygen ions and formed water molecules with the presence of protons and returning electrons from the circuit. Figure 1.1: The working mechanism of the proton exchange membrane fuel cells (PEMFCs). Common portable electronic devices, such as cellular phones, personal digital assistant (PDA), laptop computers, are getting more popular to the general public. As the functionalities of the portable devices increase, the demand for longer battery life becomes higher. Although the battery chemistry has been greatly improved and life of the battery has been greatly extended, the total amount of capacity that can be stored in a battery is still limited to a few hours [4]. Since the size of portable electronics is getting smaller and smaller, all the auxiliary components of the device are required to be more compact in size and lighter in weight [5, 6, 7]. Therefore, direct methanol fuel cells 2
18 might be a good solution for more compact, lightweight, and reliable power supply systems for portable applications. Direct methanol fuel cells can directly convert chemical energy to electrical energy at room temperature without the need to have a fuel reformer. Methanol has a relatively high energy density compared to hydrogen or many other hydrocarbon fuels. Thus, a small amount of methanol can last a longer period of time than other types of fuel. Methanol is widely available, inexpensive, has high fuel energy density, and can be distributed to consumers very easily. Methanol can be produced from carbon-based feedstock, such as wood, coal, and oil well flare gas, as well as natural gas. Methanol s physical properties resemble those of gasoline at room conditions, which means that it can be easily transported and stored for refills. The unique nature of methanol makes direct methanol fuel cells to be the promising candidates of power supply for portable electronics. Liquid methanol is easy to handle, and it can be converted to electrical energy at low operating temperature with no reformation process, which allows the DMFC to be targeted as a power generator for portable electronic devices, such as laptops and cellular phones. Although the power density of the direct methanol fuel cell is not as high as hydrogen fuel cells, the power consumption requirement for portable devices is also low. Micro fuel cells with power generation ranging from micro-watt to 1 W are being investigated in this thesis. The volume and efficiency of the fuel cells are very critical for portable applications; therefore, enhancing the volumetric power density of the direct methanol fuel cell was the general goal of this thesis. 3
19 1.1 DMFC Working Mechanism The core component of the DMFC is the MEA. Figure 1.2 shows that an MEA consists of a double-sided dispersed catalyst coated PEM that is sandwiched by two gas diffusion layers (GDL) or backing layers [8]. In PEM fuel cells, the fuel type dictates the type of catalyst needed. During the process of oxidizing methanol to protons and carbon dioxide gas, a small amount of carbon monoxide would be generated during the intermediate steps, which could cause corrosion or poisoning to the catalyst. Since Platinum/ Ruthenium supported on carbon (Pt/Ru/C) has the highest carbon-monoxide (CO) electrode poisoning tolerance, it is the most commonly used catalyst material as the anode electrode for DMFCs. However, a plain Pt/ C catalyst can be used on the cathode since the cathode side only contacts with air or oxygen [9]. The half cell and overall reactions of the DMFC are shown below. Anode side: CH OH H 2O 6H + CO2 + e Cathode side: + 3 6H + O2 + 6e 3H 2O 2 The overall reaction: 3 CH 3OH + O2 2H 2O + CO 2 2 The electrons created from the anode half reaction are forced to flow through an external circuit thereby creating current, and the electrons are returned to the other side of the fuel cell to complete the cathode half reaction that forms water. The electrochemical reactions of the fuel cell show that the GDL materials must be electrically conductive in 4

20 order to provide interconnections between the reaction sites and the current collector. Since the GDL is also located between the reactant channels and the catalyst layers, it must have a porous structure which can uniformly distribute reactants to the reaction surfaces through diffusion as shown in Figure 1.3. The additional functionality of the GDL is to transport carbon dioxide gas bubbles and water droplets away from the anode and cathode, respectively. A porous carbon paper is usually used as the GDL for the anode, and carbon cloth with higher porosity is usually used as the GDL for the cathode. The typical thickness of the carbon paper or carbon cloth ranges from 100 to 300 µm. Most of the time, GDLs are coated with a wet-proofing agent, such as PTFE to form hydrophobic surfaces, which prevents the GDL from water clogging and allows rapid gas diffusion for a good reaction rate at the electrodes. Current Collector Gas Diffusion Layer Proton Exchange Membrane Catalyst Layers Gas Diffusion Layer Current Collector Figure 1.2: The schematic of MEA structure. Anode Catalyst Cathode Catalyst Bipolar plate Bipolar plate Figure 1.3: The schematic of DMFC working mechanism. 5
21 Conventional membrane-electrode-assembly (MEA) designs for direct methanol fuel cells (DMFC) have been based on planar, repetitively stacked structures to transport reactants to the reactive catalyst surfaces and to conduct electrons to the external circuit. The planar MEA structures sandwiched between the serpentine-flow channels with significant wall thicknesses limit the active area of MEA exposed to the reactants, which reduces the volumetric power density of a DMFC. The schematic of the MEA in Figure 1.4 shows that there is only one anode and one cathode for each MEA. The distance between the electrodes is uniform and the shortest path from anode to cathode is always the same. The distance between the electrodes is very important for the transportation of protons. Analytical and empirical data show that the thicker electrolyte membranes give higher ohmic resistance to the fuel cell, which lowers the performance of the fuel cells. Therefore, the distance between the anode and cathode should always be shortened. Fuel Air MEA PEM Current collector Carbon cloth Catalyst Carbon paper Current collector Figure 1.4: The schematic of an MEA integrated with serpentine reactant flow channels. The amount of power generated from a fuel cell is highly dependent on the reactive area of MEA exposed to the reactants. Since all the oxidation and reduction processes participate at this region, it is very important to ensure the geometries of MEAs can be modified to achieve higher volumetric power density for portable devices. 6
22 1.2 Research Question & Hypotheses Based on the general goal of this thesis, the research question is defined: How to improve the volumetric power density of direct methanol fuel cells for portable applications? There are many ways to enhance the power density of the fuel cells. The major approaches can be classified into two categories: one approach is to improve the performance of the fuel cell, so the fuel cell can generate more power. The other approach is to decrease the overall size of the fuel cell system, so the volume can be lowered. Two hypotheses have been developed based on the approaches mentioned above: 1. Volumetric power density increases when MEAs have corrugated geometries. 2. Volumetric power density of fuel cell stacks can be improved by using novel stacking configurations. Hypothesis 1 suggests that the volumetric power density can be enhanced by corrugating the MEAs to reduce the overall volume of the fuel cell. Since this hypothesis involves design and fabrication of the corrugated MEA for performance enhancement, geometry design and manufacturing processes are explored and investigated. Hypothesis 2 is a follow-up to Hypothesis 1; that if a single corrugated MEA can improve the volumetric power density of the fuel cell, then the volumetric power density would also be improved for different stacking configurations. 7
23 1.3 Research Roadmap The research roadmap is summarized in Table 1.1, which includes the major task objectives, research tasks and the associated issues and approaches. In order to validate hypothesis 1, the major approach is divided into 4 subtasks. In task 1A, the analytical model of the corrugated geometries is formulated to compare with the baseline geometry. The analytical model contains the theoretical results of geometry comparison between the baseline geometry and the corrugated manifolds. The geometric models can also be used to predict the geometric properties of the corrugated manifolds for any targeted performance goal. In order to validate the analytical model developed in task 1A, the baseline MEAs are fabricated and the performances are tested in task 1B. By recording the performances of the baseline MEAs, the comparison can be made based on the performance change after the corrugation processes in task 1C. In task 1C, different manufacturing processes, which can form corrugated geometries, are also explored and investigated before the corrugated MEAs are formed for testing. Finally, based on the performance comparison before and after the corrugation process, the root causes of performance loss are identified and quantified using numerical and experimental methods. For the second research task, the ratio between active area and stacking volume is used to compare and predict the performance of different corrugated MEA stacks using geometric analysis. 8
24 Table 1.1: Summary of project objectives and research tasks. DMFC Design Objectives Research Task Issues Approach Metrics Increase MEA active area without volume increase Define the overall volume of fuel cell stacks for MEAs with different corrugations 1A. Analytical model of 2D and 3D manifolds 1B. Baseline MEAs 1C. Corrugated MEA for analytical model validation 1D. Evaluation and root causes identification Stacking Configurations Maximum A/V Shaping MEA with high aspect ratio geometries Deformation on the MEA from forming processes Electrode integration on corrugated MEAs Manufacturing Maximum A/V Performance comparison between MEAs with planar, 2D triangular corrugation, and 3D dome-shape geometries. Analyze the active area to overall stacking volume for MEAs with planar, 2D triangular, and 3D dome-shaped geometries. Power/Volume = mw/cm3 Active area / stacking volume = cm2 / cm3 The detail procedures of the research approaches are also illustrated in Figure 1.5. The single-headed red arrows represent the sequence of the steps. Double-headed red arrows are labeled with the word comparison, which means that the results from both steps are compared before any actions have been taken. The action is represented by the single-headed arrow pointed toward the third direction. 9
25 High Volumetric Power Density Task 1: Corrugated MEAs C o m p a r i s o n Task1A: Geometric Analysis Performance Roadmap Task 1B: Baseline MEA fabrication and testing Task 1B: Baseline Performance The Maximum volumetric power density is changed Task 2: Stacking Configurations Comparison Task 1D: Identify Issues for further power density enhancement: Methanol Crossover Reduced ionic and electrical conductivity Task 1C: Patterning MEAs with Corrugations Task 1C: Corrugated MEA Performance Task 1D: Visual Mechanical Deformations Task 1D: Validation causes of deformation using ABAQUS Figure 1.5: The schematic diagram of detail research approaches. 1.4 Thesis Organization In Chapter 2, the literature survey has been conducted and more background information on the development work on direct methanol fuel cells is reviewed. Chapter 3 introduces the theories behind the polarization curve and the mechanics of forming processes. Chapter 4 explains the details of the analytical model for geometric analysis and the development of the performance roadmap. The detail fabrication processes, testing setup and procedures of the baseline planar MEAs are described in Chapter 5. Results are shown for a repeatability test and the relationship between MEA size and power density of baseline MEAs. Different manufacturing processes for forming 10
26 corrugations and the performance results of the corrugated MEAs are evaluated in Chapter 6. In Chapter 7, the ABAQUS model is formulated to investigate the mechanics of the forming processes. Chapter 8 explains the in-depth understanding of the results presented in Chapter 6 and Chapter 7 and identifies the possible causes of performance loss using analytical and experimental methods. In Chapter 9, the geometric analysis and the integration related technical issues for different MEA stacking configurations are investigated. The final chapter gives some conclusions and future work recommendations based on the work presented here. 11
27 CHAPTER 2 LITERATURE SURVEY In Chapter 1, basic DMFC components and their functionalities have been introduced. The research question has also been defined to enhance the volumetric power density of the DMFCs. Many research groups are also trying to improve the performance and power density of the DMFCs by approaching it from different technical directions. Firstly, the design and performance of the state of the art passive MEAs are reviewed. Second, current DMFC technical issues are discussed. Third, different approaches people have taken to achieve higher power density are presented at the end. 2.1 State-of-the-art passive DMFCs Passive DMFCs operate at room temperature without active fuel and air supply to the electrodes using pumps and fans. The fuel is supplied to the anode by immersion and air is supplied to the cathode by natural convection. By operating the cells under this kind of configuration, no external power is needed to operate the fuel cell. Thus, the total power output from the fuel cell is equal to the net power output. Korea Institute of Science and Technology (KIST) reported that they have developed passive DMFCs to have single cell performance of about 5 mw/cm 2 in the year of 2000 [10]. Four years later, the cell performance has been improved to as high as 43 mw/cm 2 using 4M methanol with Nafion 115, which is higher than other reported results [11,12,13,14]. Their passive DMFC reaches the peak power density at 0.3V with current density of 140 ma/cm 2. On the other hand, another group has reported the cell performance of passive DMFCs with different Pt loading rates on Nafion 112 [15]. It found that the optimum Pt loading on anode and cathode should be about 2.5 mg/cm 2 and 12
28 2.6 mg/cm 2, respectively. They also reported that their passive DMFC can deliver 12.5 mw/cm 2 with unsupported Pt-Ru anode (6.4mg/cm 2 of Pt-Ru) and unsupported Pt cathode (3.9mg/cm 2 of Pt) using 4M methanol and Nafion 117 as the PEM. 2.2 Current DMFC Technical Issues Even though the performance of the passive DMFCs has been greatly improved in recent years, further improvement is required to make micro-dmfcs to be competitive with Li-ion batteries for portable applications. Therefore, many technical difficulties still need to be overcome before high efficiency, reliable, and low cost DMFCs can be ready for commercialization [16, 17]. One of the major obstacles for achieving high volumetric power density is that the commercially available solid polymer electrolyte material does not have high impermeability towards high concentration methanol. Consequences of methanol crossover can reduce the fuel efficiency of the fuel cell, lower the performance of the fuel cell, and also increase the volume of the fuel cell system with a larger fuel reservoir for less concentrated fuel. Another problem is based on the slow methanol oxidation and air reduction reactions, which reduce the efficiency of the fuel cell. Carbon dioxide gas bubble blockage and cathode water flooding are also critical issues for DMFCs. System integration, manufacturability, and reliability problems also need to be resolved before passive DMFCs are ready for commercialization Methanol Crossover When current density is high, the methanol crossover problem is mainly caused by electro-osmotic drag. During operation of the DMFC, some water molecules are dragged by the protons while protons move from anode to cathode. This is called ionic 13
29 drag or electro-osmotic drag. When the anode layers generate more protons at high power density, more water molecules will be dragged along with the protons towards the cathode, which can cause an electrode flooding problem at the cathode. When the cathode is flooded with water, no air molecules can diffuse into the active area, and the fuel cell is suffocated [18]. When current density is low, the major cause of methanol crossover is based on the diffusion across the steep concentration gradient between the anode and cathode. When methanol diffuses from anode to cathode, methanol is also oxidized via the catalyst on the cathode and generates mixed potential with the oxygen reduction reaction. Furthermore, the methanol crossover problem can also cause electrode poisoning on the cathode with incompleted oxidation reactions. The exothermic oxidation of the methanol at the cathode also produces relatively high, localized temperature increase in the cathode layer. The localized high temperature increases the rate of crystallite growth of the catalyst, which decreases the atomic surface area of the catalyst and the catalytic activity of the cathode. The localized high temperature can also decrease the reliability of the MEA. The factors that contribute to methanol crossover include membrane permeability and thickness, operating current density, methanol concentration of the fuel, fuel flow rate, operating temperature, cathode air pressure, and anode performance [19] Slow Reaction Rates Methanol oxidation and oxygen reduction are relatively slow electrochemical reactions. It usually takes more than 6 subsequent steps for methanol molecules to be oxidized to carbon dioxide gas and hydrogen protons. The oxygen reduction process is believed to be the biggest problem for PEMFC. The slow cathodic reaction causes high 14
30 overpotential at the cathode and lowers the cell voltage. Thus, the overall performance of the fuel cell drops. When the slow reactive activities are coupled with the cathode flooding problem at high current density, the performance of the cell significantly degrades Bubble Removal Problem In DMFCs, CO 2 gas is generated during the methanol oxidation process at the anode while the current is being generated. However, the CO 2 gas bubbles are nucleated in between the small porous cavities within the catalyst layer. Gas bubbles need time to build-up their pressure from catalyst layer through the porous gas diffusion layer, and then towards the anode surface before the bubbles can be detached. It usually takes a longer time for the bubbles to grow at low current density than at high current density. During the growth of the bubbles, the surface areas of the catalyst atoms are blocked by the bubble and prevent some of the reactive area from making contact with the fuel for power generation. This phenomenon also contributes to the instability of the DMFC performance. Since the partial pressure of CO 2 gas is lower at room temperature, CO 2 bubbles take an even longer to grow in a passive DMFC than a heated DMFC. The active fuel flow on the anode of an active DMFC can speedily remove the bubble on the surface of the anode to speed-up the fuel replenishment process of the anode catalyst. Therefore, the CO 2 bubble blockage problems become more significant for passive DMFC systems than active DMFC systems. 15
31 2.2.4 System Integration For standard DMFCs, other system level problems consist of the high power consumptions of the system auxiliary components, such as heater, pumps, valves, and so on. The auxiliary components can greatly reduce the net power output of small and low output DMFCs. Non-standardized design configurations with non-optimized design parameters and operating conditions also decrease the overall fuel cell performance. The design configurations include the patterns of flow channels and the dimensions of the channel and channel walls. These parameters can affect the fuel flow and current collection during the fuel cell operation. The other operating conditions can also impact the performance of the fuel cells, i.e. fuel and air flow rates, heating temperature, methanol concentration, etc. For passive DMFCs, many of these issues are eliminated for system simplification, which is also one of the biggest advantages of passive systems Manufacturing Problems Manufacturing processes are very important to the commercialization of DMFCs. The manufacturing processes can affect the performance of the fuel cell as well [20]. The non-uniformity of the Pt coating can lower the effectiveness of the catalyst loading and also vary the uniformity of reaction, gas forming, and water removal across the electrode areas. Therefore, different catalyst ink coating methods and their uniformity need to be investigated for scale-up manufacture. The manufacturing processes and fabrication methods of the channel patterns on the bipolar plates are limited to planar serpentine flow design, which limits the geometry of MEAs to be planar as well [21]. Finally, the materials for gas diffusion layers and (graphite) bipolar plates seem to be very limited. Carbon paper or carbon cloth are relatively good for compression but have limited 16
32 tolerance to tension. While the Nafion membrane is immersed in water or methanol, the membrane will swell about 15 to 20%. This elongation can apply tensile stresses on the carbon cloth since carbon cloth is hotpressed onto the Nafion membrane. This stress can cause delaminations between the Nafion and electrodes and increase the ohmic loss. Thus, manufacturing methods and new materials for gas diffusion layer also need to be developed. The sizes of DMFCs are also limited to millimeter and larger and the geometry of the MEAs is planar, which limit the applications of DMFCs to be applied to stationary systems and stacking geometries to be rectangular or cubic blocks Reliability and Cost Problems During DMFC operations, many degradation problems are found within the fuel cells. Ru atoms within the anode catalyst layer slowly migrate toward the cathode, which decreases the active area of the cathode for the oxygen reduction process [22]. On the other hand, the loss of Ru atoms from the anode can increase the risk of CO poisoning during the methanol oxidation process. Eventually, the catalyst poisoning can shorten the life of DMFCs. Nafion membrane can also degrade over time because of the general aging problem of polymers. Its aging can greatly decrease its conductivity for transporting protons from anode to cathode and also decrease its resistance to methanol crossover [23]. The graphite bipolar plates are brittle and cannot withstand high impact force. Its brittleness can limit the DMFCs to stationary applications and reduce the reliability. One of the critical reasons why DMFCs have not been commercialized is that the cost of the system is still too high for the general public [24]. Platinum is still a precious metal, which has limited production and high cost. Because of the slow reaction rates, 17
33 DMFCs require higher Pt loadings than PEMFCs. Thus, the Pt cost becomes a bigger problem for DMFC systems. Another major cost comes from the high machining and manufacturing cost of graphite bipolar plates. Since bipolar plates are very brittle, the machining time is longer and the yield of the product from the molding process becomes much lower. Therefore, the reliability and cost reduction problems have to be resolved before DMFCs can be successfully commercialized. 2.3 Current Research Status on Technical Issues Methanol Crossover The fuel crossover problem has been approached from different directions. Some groups approach the problem by precisely controlling the supply of the fuel to the exact amount of fuel that would be reacted for electrical energy at a specific load [25]. On the other hand, the fuel cell can also operate under a controlled load, which is below the limiting current of the fuel cell for a specific fuel concentration. These approaches are focused on controlling the operation parameters of the DMFCs to utilize the entire amount of supplied methanol and eliminate the methanol loss through crossover. Material scientists and chemists approach this problem differently. They have used electrochemical methods and simulation models to study the causes of methanol crossover in different thicknesses of Nafion membranes. Then, they have developed hybrid membranes [26] and also newly formulated membranes to overcome the methanol crossover problem. The Nafion hybrid membranes consist of Nafion/Exfoliated-ZrP [27], exfoliated zirconium phosphate/nafion [28], Nafion/Silica [29], and so on. The newly formulated membranes include: polyethylene Glycol (PEG)-lithium percholorate complexes [30], nano-size ceramic powder mixed with cyclopentanone and propylene 18
34 carbonate (PC) [31], sulfonated poly-(etheretherketone) (SPEEK) [32,33], dimethyl ether (DME) [34], etc. Although the new membranes might have improved tolerance towards methanol crossover, mechanical integrity, reliability, and reduced ionic conductivity become performance trade-off factors Slow Reaction Rates Because of the slow reaction rates between the catalyst and the reactants on anode and cathode, many new types of catalyst materials are under investigation. Most of the new catalysts are platinum based materials. Pt 3 Cr supported by carbon was developed by Los Alamos National Laboratory to improve the rate of oxygen reduction reactions [35]. Lead modified by Pt, Pt Ru and Pt Sn microparticles dispersed into poly (ophenylenediamine) film can improve the activity of methanol oxidation [36,37] System Integration Different designs of flow channels have been developed to accommodate the two phase flow of methanol and CO 2 gas [38]. A tree-like design of the flow distributors is developed based on the functionality of the fluid distribution system. It is found that tree network channels can provide substantially improved electric and net power densities compared to the traditional non-bifurcating single serpentine channels [39]. For passive micro-dmfcs, microchannels have been developed to utilize gravitational and capillary forces to feed the anode with liquid methanol and the cathode with natural convection to eliminate the use of a pump for active feeding [40,41]. For the recent trend of passive DMFCs, the system design of small DMFCs is dramatically simplified by recycling water from cathode to anode for fuel dilution to decrease the size 19
35 of the fuel reservoir [14]. Since the system integration and design become more challenging for passive cell stacks, some stacking configuration geometry and system integration solutions are discussed in Chapter Bubble Removal Problem Because of the buoyancy force acting on the methanol, the CO 2 gas bubbles tend to detach from the anode surface and float against the gravitational force direction. As a result, passive DMFCs should have a vent for CO 2 gas to leave the reservoir tank. On the other hand, the air-breathing cathode should be opened to the air to improve the aircirculation by placing it vertically for natural convection. The bubble dynamics have been investigated experimentally using a transparent cell [42]. CO 2 gas bubble evolution behavior in microchannels (400um) has been studied and found that the capillary force is increased as the bubble grows, thus the channel size needs to be optimized for the best performance [43]. A new channel design has been fabricated and tested to remove CO 2 gas bubbles inside of passive micro-dmfcs [44] Manufacturing and Design Problems Currently, some research work has been focused on the development of micro- DMFCs using microfabrication processes to decrease the footprint of the MEA and increase the power density. Some other groups have tried to modify the geometry of the MEAs to minimize the overall volume of the DMFCs. In order to apply DMFCs to microelectronics, the footprints of the DMFCs have to be minimized to fit on the circuit board. Microfabrication techniques were used to fabricate rectangular electrode manifolds on planar PEM fuel cells to increase the active 20
36 area between the fuel, catalyst, and the PEM. The preliminary performance result of the component prototypes demonstrated their basic functionality in the milliwatt range. It also demonstrated that microfabrication can be used to pattern finer footprint features of the MEA, which can enhance the power generation [45,46,47]. By modifying the geometries of the MEAs, the power density can also be improved. A sinusoidal waved non-planar MEA was fabricated with non-disclosed manufacturing steps with precise control of the temperature, pressure, and feed rate required to bond catalyzed electrodes to the polymer ionic conductor for hydrogen fuel cells [48, 49]. The non-planar MEA was tested and the performance of the MEA in the ohmic region was demonstrated to be comparable to the performance of the planar cell even though it has smaller current collector contact area. The testing result also showed that the non-planar MEA obtained about 1.5 times the volumetric power density of the planar MEA at the peak power density level. The good result indicated that this is a promising approach to improve the volumetric power density of DMFC as well. Since the performance of the corrugated MEA is closely related to the manufacturing process, different manufacturing processes to fabricate corrugated MEAs are explored in this dissertation. The performance of the corrugated MEA is also evaluated in Chapter 6. Micro-tubular fuel cells in Figure 2-1 have been developed by NASA to improve the volumetric power density for portable electronic equipment [50]. The MEAs are tubular in shape; they can be packed into a small case with oxygen/ hydrogen cross flow. Each MEA consists of a tubular PEM with the anode in the inner surface and the cathode on the outer surface with inner diameter of 600µm, membrane thickness of 50µm, anode thickness of 25µm, and cathode thickness of 125µm. One end of the tubular MEA is 21
37 closed, and the other is open and connected to a current-collection manifold. At the open end, a conical anode current collector and diffuser are inserted into the MEA tube and a crimping ring is a cathode current-collector, which is connected to the outside of the tube. Since each tubular MEA produces a relatively small current, either parallel or serial connection can be made without generating a large amount of ohmic loss. The elimination of the bipolar plates and the tubular design of MEA greatly utilize the available volume of the fuel cell. Thus, the power density of the fuel cell is also increased. Figure 2.1: A Micro-Tubular Fuel Cell contains multiple tubular membrane / electrode assemblies that operate in an oxygen/hydrogen cross flow [50]. 22
38 2.3.6 Reliability and Cost Problems New proton-electrolyte membranes are under development to overcome the aging problem of Nafion. In the mean time, the DMFCs are operating at temperatures below Nafion s glass transition temperature to reduce the aging process. The cost of the Pt loading on anode and cathode can be reduced by depositing nano-meter thick Pt layer using chemical vapor deposition processes [51]. By optimizing the amount of the Pt loading on Pt/C for the best performance of DMFCs, this can also improve the utilization of the catalyst [52]. Ultra-thin ( A ) platinum catalyst layers were deposited with the sputtering process using a vacuum sputter to decrease the catalyst loading on PEMFC electrodes without sacrificing performance. Instead of depositing the entire Pt loading on a single catalyst layer using the traditional coating method, the same amount of Pt loading was sputtered as separate thin catalyst layers. Nafion/carbon/isopropyl alcohol (NCI) ink was brushed on top of the thin Pt layers to satisfy the condition of triple access for protons, gas molecules, and electrons. The platinum utilization efficiency of sputtering can be about 10 times higher than the conventional methods [53]. Since the graphite bipolar plates are brittle and expensive to manufacture, stainless steel plates with corrosion resistant coatings are under development [54,55]. Enclosed flow channels are not necessary for passive DMFCs, a plastic housing with gold coated stainless steel wire-mesh current collectors are used [15]. 2.4 Summary This chapter presented the state-of-the-art passive direct methanol fuel cell performances, and the current technical issues that needed to be overcome before 23
39 portable DMFCs are ready for mass production and commercialization. Although manufacturing issues may not seem like a major area in DMFC scientific research, the problems may become too critical and too late for development when the DMFC technology is ready for commercialization. Therefore, it is important to investigate all of the related issues of DMFCs in parallel. This is inline with the research goals of this thesis to improve the power density of passive DMFCs by investigating the related issues of manufacturing processes and geometry designs. Before getting into the details of the research tasks, some theoretical background of fuel cell performance and mechanics behind the forming processes are presented in next chapter. 24
40 CHAPTER 3 THEORY In this chapter, the theories behind the fuel cell performance and the mechanics behind the forming process are presented. The fuel cell performance is usually evaluated using polarization curves. The common sources of voltage drop are also discussed in the first section. One of the major research tasks in this thesis is to investigate the forming process effects on the MEA performance. Therefore, it is also important to understand the mechanics behinds the corrugation forming process. Bending and stretching are two major processes during corrugation forming. It is important to understand the common causes of failure from those processes as well. 3.1 Polarization Curves of DMFCs A polarization curve is used to show the performance of a fuel cell by representing the cell voltage behavior against operating current density. An example of a polarization curve is shown in Figure 3.1. The plot shows the reversible cell voltage is above the actual open circuit voltage of the curve. This is the theoretical cell voltage calculated from the Gibbs free energy of the fuel cell reactions and assuming no exergy loss during the energy conversion process. The reversible cell voltages are about 1.2 V for low temperature PEMFCs and DMFCs and 1.0V for high temperature SOFCs [1]. The actual open circuit voltage is less than the theoretical value. This voltage drop is highly dependent on the operational temperature of the fuel cell, the types of chemical reactions, and the loss due to the internal current and fuel crossover. In generally, there are four major irreversibilities that cause the cell voltage to drop from open circuit voltage to zero. They are categorized as activation losses, ohmic losses, mass transport 25
41 or concentration losses, and fuel crossover and internal current. Although methanol crossover is dominant at lower current densities, it also occurs at other current range as well. Since fuel crossover happens across all the regions, the loss due to fuel crossover is distributed into the other regions labeled in Figure 3.1. The voltage drop caused by different types of losses is also called overpotential. Figure 3.1: Generalized polarization curve of a fuel cell showing regions dominated by different types of losses [1]. The shape of the polarization curve can also be described as there is a rapid drop from open circuit voltage caused by activation loss. Then ohmic loss causes the voltage to drop linearly. At higher current density, the voltage falls rapidly because of the concentration loss. The theoretical reasons behind those losses during cell operation are discussed in the following sections. 26
42 3.1.1 Activation Losses The activation overpotential usually occurs in the low current density region. The activation overpotential happens at the anode as well as cathode. The activation losses are caused by the sluggish nature of the reaction kinetics taking place on the surfaces of the anode and cathode. A portion of the voltage generated is lost in driving the chemical reaction that transfers the electrons to or from the electrodes. The activation loss can be characterized on a plot with overpotential against log of current density, which is also called Tafel Plot. The equation representing the plot is the Tafel equation i V = A ln (3.1) i o where V is the activation overpotential, A is a constant representing the reactivity of electrochemical reaction, i is the current density of the fuel cell, and i o is the exchange current density of the fuel cell. For PEMFCs, the constant A in Equation 3.1 is given as A RT = (3.2) 2 α F where R is the universal gas constant, T is the absolute cell temperature, F is the Faraday constant, and α is the charge transfer coefficient. Based on Equations 3.1 and 3.2, the overpotential increases as A increases, which means that the reaction is slow. For a larger i o, the reaction is faster. The charge transfer coefficient, α, and exchange current density, i o are dependent on the types of reaction involved and materials of the catalyst and electrolyte. Therefore, the activation overpotential can be lowered only if new materials of catalyst and electrolyte can be developed. 27
43 3.1.2 Ohmic Losses The voltage drop from the ohmic losses is caused by the resistance to the ionic and electronic flows. The resistance to the flow of ions through the electrolyte is the ionic resistance. The electronic resistance includes the resistance to the flow of electrons through the material of the electrodes and the interconnections. Similar to most of the electronic circuitry, the voltage drop is linearly proportional to current density. The overpotential of ohmic loss can be represented by Ohm s Law: V = ir (3.3) where i is the current density of the cell and r is the overall area specific resistance (Ω.cm 2 ) within the cell Concentration or Mass Transport Loss This overpotential primarily results from the change in concentration of the reactants at the surface of the electrodes as the fuel is used. The reduction in concentration is the result of the concentration gradient required to transport sufficient reactant to the electrode surface. Therefore, it s all called mass transport loss. Sometimes this type of loss is also called Nernstian because this is related to the concentration of the fuel and the Nernst equation used to model the effects of concentration. This type of loss usually occurs at high current density regions because of the high demand of the reactants and only limited amount of reactants can be transported to electrode surfaces. By assuming a limiting current i l at which reactant is used up at a rate 28
44 equal to its maximum supply speed, then the voltage drop of the cell from the concentration loss is given as i V = B ln 1 (3.4) i l where B is a constant that depends on the fuel cell and its operating state, and i is the current density. The theoretical value of B is different for different reactants. B is equal to RT/2F for hydrogen and RT/4F for oxygen. If the limiting current density of one electrode is reached, the voltage falls rapidly to zero, whatever the limiting current density at the other electrode Fuel Crossover & Internal Currents This overpotential loss is due to the diffusion of the fuel across the electrolyte and electron flow through the electrolyte. Although the magnitude of these types of loss for PEMFC is relatively small, they do affect the open circuit voltage of low temperature cells, especially for room temperature DMFCs. Since potential drop resulting from these factors occurs throughout all regions of the operational voltage, an equivalent current density of the internal and fuel crossover loss, i n is assigned to include this type of loss into the current density of the cell as shown in Equation Overall Operational Cell Voltage By combining four major irreversibilities, the operational cell voltage can be estimated by Equation (3.5): i + i + ( ) n i i n V = E i + i + n r A ln B ln 1 (3.5) i o i l 29
45 where E is the reversible (theoretical) open circuit voltage calculated from Gibbs free energy [1]. 3.2 Mechanics of Corrugation Forming The mechanics of corrugation forming are mostly based on the mechanics of sheet-metal forming processes. The basic mechanisms of all sheet-forming processes are bending and stretching, and certain factors can significantly affect the overall operation [56]. In this thesis, the major factors are elongation, residual stresses, springback, and wrinkling Elongation Figure 3.2 shows the engineering stress strain curve of a specimen subjected to a tension test. The sample first undergoes uniform elongation until it reaches its ultimate tensile strength (UTS). Then, the nonuniform elongation starts with necking and ends with fracture. When the material is being stretched in sheet forming, high uniform elongation is more desirable. When necking begins, many metals in the region of uniform plastic deformation can be represented by the power curve in Equation (3.6), the true uniform strain, ε is found to be equal to the strain-hardening exponent, n, as shown in Equation (3.7): n σ = Kε (3.6) ε = n (3.7) where σ is the true stress and K is the strength coefficient. The differences between the engineering stress-strain curve and the true stress-strain curve of a tension test is shown in Figure 3.3. Hence the true uniform strain in a simple stretching operation is 30


 Figure 3.")
46 numerically equal to the strain-hardening exponent. A large n indicates large uniform elongation, so it is more desirable for sheet forming. Plastic strains represent the amount of permanent deformations on the sheet that cannot be recovered. Plastic strains of polymers are nonlinear deformation, which is difficult to measure. Thus it is important to determine the plastic strain in terms of overall true strain, ε total, and elastic true strain, ε E, as shown in Equation 3.8. ε p σ E = ε total ε E = ε total (3.8) Figure 3.2: Outline of a tensile-test sequence showing different stages in the elongation of the specimen [57]. 31
![Figure 3.3: Comparison of engineering stress-strain curve and true stress- strain curve [58]. 3.2.](/docs-images/88/115672173/images/47-0.jpg "2 Residual Stresses During the forming process, the non-uniform deformations may be introduced onto the sheet.")
47 Figure 3.3: Comparison of engineering stress-strain curve and true stress- strain curve [58] Residual Stresses During the forming process, the non-uniform deformations may be introduced onto the sheet. When the constraint object, such as a punch, is removed, the part may be distorted and the tensile stresses on the surfaces can also lead to stress-corrosion cracking of the sheet-metal parts. The residual stresses for plastic materials are mostly thermal stress, which can be relieved by cooling the part with the mold, so polymers can have sufficient time to re-orient themselves around the new geometry Springback Sheet-metal parts are generally thin and subjected to relatively small strains, which are more likely to experience springback effect. This is very common in bending and other sheet-forming processes where the bend radius to thickness ratio is high. For 32
48 thermoplastics, if the thermal stress is relieved from the part, the amount of springback on the part is limited Wrinkling During the sheet forming process, the sheet is mostly subjected to tensile stresses. However, the bending process develops compressive stresses in the plane of the sheet as well. For the 3D corrugation forming process, when the edges of the sheet are under circumferential compression, the tendency for wrinkling increases Bending Process The bending process is usually used to form flanges and corrugations. Bending is used not only to form the geometry but also to impart stiffness to the part by increasing its moment of inertia. In bending, the outer surface of the material is in tension and the inner surface is in compression. Theoretically, the engineering strains, e, at the outer and inner surfaces should have equal magnitude and are given by Equation 3.9 e = e 1 = (2R / T ) + 1 o i (3.9) where R is the bend radius and T is the sheet thickness, as shown in Figure
 are two different variables [56]. From Equation 3.")
49 Figure 3.4: Bending terminology. The bending radius is measured to the inner surface of the bend. Note that the length of the bend is the width of the sheet. Also note that the bend angle and the bend radius (sharpness of the bend) are two different variables [56]. From Equation 3.9, as R/T ratio decreases, the tensile strain at the outer surface increases. This means that the material may break after a certain strain has been reached. The minimum bend radius is defined as the radius R at which a crack appears on the outer surface of the bend. The minimum radius is usually represented in terms of the sheet thickness, such as 5T, 6T, and so on. For large L/T ratio, the state of stress at the outer surface changes from uniaxial stress to biaxial stress. Biaxial stretching tends to reduce ductility, that is, strain to fracture. Thus as the length L increases, the minimum bend radius increases. However, when L is about 10T, a plane strain condition is fully developed. As the R/T ratio decreases, narrow sheets with smaller L crack at the edges and wider sheets with large L crack at the center, where the biaxial stress is the highest. Rough edges are points of stress concentration, bendability decreases as edge roughness 34
50 increases. Anisotropy of the sheet is also important in bendability. As the impurities are aligned in certain directions, the transverse ductility is reduced. Bending forces can be estimated by assuming that the process is similar to cantilever beam bending. Thus bending force is a function of material s ultimate strength, σ u, length and thickness of the part and the die opening W. By neglecting friction, the maximum bending force P max is P max σ ult k W 2 = (3.10) where factor k ranges from 1.2 to 1.33 for a V-die and 2.4 to 2.66 for U-die. Effects over various factors including friction are also included in factor k. The bending force is also a function of punch travel. It increases from zero to a maximum and may decrease as the bending process is completed. The force then increases dramatically as the punch reaches the bottom of the die Stretching Process In stretch forming, the blank is a rectangular sheet, clamped around its narrower edges and stretched lengthwise over a punch, which moves downward or sideways. Thus, the blank is allowed to shrink in width. One example of the stretching process is shown in Figure 3.5. During the stretching process, the material volume is constant. As the sheet deforms and elongates, the thickness of the sheet becomes thinner. The sheet will continue to elongate until the true strain reaches its fracture strain. 35
51 Figure 3.5: Steps of drape forming operation [59] Failure Modes Based on the mechanics of bending and stretching, most of the failures on the sheet are caused by the elongation of materials. If the extensive elongation passes the necking zone, the thickness of the material is deformed non-uniformly across the sheet surface and eventually reaches its fracture point. For MEA forming, uniformity across the MEA is very important to ensure the performance of the DMFCs. If there is any nonuniformity across the MEA surfaces, the current cannot be generated uniformly across the fuel cell. If some through holes were generated on the MEAs during the forming processes, MEAs were destroyed. Therefore, it is important to have well-controlled bending and stretching processes for forming corrugations. 3.3 Summary The theories behind different potential losses of DMFCs and the mechanics of corrugation forming are discussed in this chapter. Understanding the nature of these 36
52 overpotentials is very important for fuel cell development and identification of the causes of performance variation of modified fuel cell systems. Since corrugated MEAs are tested for performance in the following chapters and polarization curves are used for evaluations, it is necessary to understand the theory behind the curves. The mechanics of bending and stretching are presented to show the critical failure mode of the processes is due to large tensile strains. The theoretical equations are embedded in finite element method software, ABAQUS, which was used to analyze the corrugation forming processes (Chapter 7). Before starting the fabrication of corrugated MEAs, the corrugation geometry designs are presented in the next chapter to predict the performance enhancement of different corrugated geometries. 37
53 CHAPTER 4 GEOMETRIC ANALYSIS Before getting into the detail processes of MEA fabrication and forming corrugated MEAs, the shape and dimensions of the corrugated MEAs for the experiments need to be determined. In order to optimize the performance of the MEA based on the geometry of the corrugations, the relationship between the fuel cell performance and the corrugated geometries needs to be determined. In this chapter, the geometric analyses for different corrugated geometries have been developed. The geometries are basically classified into three categories: planar, 2D corrugations, and 3D corrugations. A figure of merit function is also defined and is used to perform comparison between different corrugated geometries. The relationship between the figure of merit and geometric parameters is also determined, which can provide the roadmap for designers to vary geometries to achieve certain performance goals. 4.1 Background Different groups involved in MEA geometry modification research have also developed different geometric analyses customized to their fuel cells. In those analyses, the definition of the reactive area and some geometric parameters of the geometries were interpreted differently. Prinz s group has investigated patterning a non-planar interface for hydrogen fuel cell using a microfabrication technique [60], [61]. The design of the microfabricated fuel cell is shown in Figure 4.1. Prinz s group has also conducted geometric analyses for planar, rectangular, triangular, circular disc tile, and square tile patterns. They show that 38

54 a square tile pattern with high aspect ratio has the largest area ratio between the textured and planar MEA surfaces, compared to the rest of the geometries. In their analyses, the designated areas for electrical contacts are also included as part of the total reactive areas for power generation. The active area (A) was defined to be reactive when both sides of that area make contact with reactants. Since reactants can reach the areas underneath the electrical contacts through the porous gas diffusion layer, some power can still be generated. This concept was adapted into the geometry analysis in this chapter by including all of the electrical contact areas into the overall active area of each cell. Figure 4.1: Micro-Bore electrodes with acid-gel electrolyte [61]. Djilali s group developed a patterning method to create a non-planar MEA for hydrogen PEMFCs [62], [48]. A series of theoretical volumetric power density gains were calculated based on the 1D planar and 2D MEA stacks which were presented in the paper. The geometric analyses from Djilali s group included the planar plate-and-frame architecture, planar corrugated stack, and 2D wave-tube MEA cell stack. The analyses were based on the comparison between the minimum volume of single corrugation unit and the reactive area. The analysis showed that the 2D waved MEA geometry required the smallest volume for its active membrane area. The sinusoidal topology design illustrated that, instead of relying upon channels in the separator plates to provide reactant 39

55 conduits, the MEA could be shaped to have large volume space which served as channels for reactant delivery. It showed that the minimum volumes for plate and frame architecture and corrugated stacking schemes require much more space than the waved MEA. The geometric analysis also did not include any parametric comparison on the design parameters of the waved MEA to other 2D and 3D corrugated geometries, which is included in this chapter. Figure 4.2: Cross-section of the two waved tube cell (WTC) designs: (a) waved MEA is supported by ribbed graphite plates and (b) waved MEA is supported by waved expanded metal structure [62]. 4.2 Definition of Figure of Merit, A/V The reactive area of the MEA is herein defined as all of the MEA reactive areas that make contact to fuel and air for power generation, therefore, the reactive area (A) should be maximized. The volume of the single cell is defined as the minimum required volume for the MEA to be functional. A functional single cell includes a MEA, reactant channels, and current collectors. The volumetric power density is defined as power generation per system volume, so the volume of the system should be minimized. In 40
56 order to evaluate MEAs with different reactive region manifolds for maximizing the volumetric power density, a figure of merit is defined to be A/V, which is the ratio of the reactive area to the single cell volume. For each aspect ratio of corrugation, the heights of the reactant channels, c were set to be constant for all corrugated geometries. Although planar MEA was independent of aspect ratio, the heights of the channels in bipolar plates were set to be the same as other corrugated MEA channel heights at that particular aspect ratio. The height of the MEA included the reactant channel height and the thickness of the MEA. Since the heights of the reactant channels, c were kept to be the same for all geometries, the projected power densities were evaluated instead of the volumetric power densities for different corrugated geometries. The projected power density was calculated based on the projected area of the MEA, which is the projected area perpendicular to the height of the reactant channel. 4.3 Geometric Models The geometric models of planar, 2D rectangular and triangular, and 3D square tile geometries were analyzed and the detail derivations were discussed as follows Planar Design The total volume of a single cell is given by V= wl(2f+2c+2e+d), where c is the height of the reactant channel, d is the thickness of the PEM, e is the thickness of the GDL, and f is the thickness of the cell separator plate, as shown in Figure 4.3. Since the thickness of the catalyst layer can be as thin as several hundred nanometers, its contribution to the fuel cell overall volume can be neglected for this analysis. The width of the reactive area is w and the length of the MEA is l. The overall active area to 41
57 volume ratio for planar MEA is shown in Equation (4.1) and can be simplified as shown in Equation (4.2). A wl V = wl( 2c + d + 2e + 2 f ) (4.1) A 1 V = (2c + d + 2e + 2 f ) (4.2) w f c Separator Plate e GDL PEM d e GDL a Separator Plate Figure 4.3: The cross-sectional schematic of a 1-D planar MEA fuel cell design with upper channels for airflow and lower channels for fuel supply (Not draw to scale) D Corrugations D Rectangular Manifold A similar geometric model is derived for MEAs with 2-D rectangular manifolds; there are three active areas within each manifold, 2cl and al. The aspect ratio of the manifold is defined to be c/(a/2) and the area to volume ratio is summarized as in Equations (4.3) and (4.4). 42
58 A (2c + a)( w / a) l = (4.3) V wl( c + d + 2e + 2 f ) A 2c + a = (4.4) V a( c + d + 2e + 2 f ) a is the width of each manifold unit. The schematic of the rectangular manifold design is shown in Figure 4.4. w f Separator Plate Air c Fuel Air Fuel Air Separator plate a e e GDL PEM GDL d Figure 4.4: The cross-sectional schematics of the 2-D rectangular manifold (top) and the MEA (bottom) D Triangular Manifold Triangular manifold geometry can be created by varying the draft angle of the rectangular manifold from 90 degrees to nearly zero degrees. The CAD drawing and schematic diagram of triangular corrugations are shown in Figures 4.5 and 4.6, respectively. The corrugation angle (θ) is introduced into Equation (4.5) to represent the surface area to volume ratio of triangular manifold structure. Total number of corrugations is equal to w/a, hence the total reactive area is equal to 2(w/a)(a/2cosθ)l = 43

 A 1 = V cosθ ( c + d + 2e + 2 f ) (4.5) Figure 4.")


59 wl/cosθ. The aspect ratio of triangular manifold is defined as c/(a/2) and A/V is simplified as shown in Equation (4.5) A 1 = V cosθ ( c + d + 2e + 2 f ) (4.5) Figure 4.5: The isometric image of 2-D triangular corrugated MEA. Separator Plate / Current Collector θ MEA Separator Plate / Current Collector e GDL PEM d e GDL Figure 4.6: The cross-sectional schematic of the 2-D triangular MEA manifold and zoom in image of MEA structure. 44
 tiles along the width of the MEA and (l/a) tiles along the length of the MEA. The total reactive area is equal to 4cwl/a+wl.")
60 D Square Tile Corrugations A similar geometric model is formulated for 3-D tile manifolds as shown in Figure 4.7. A 3-D tile manifold has 4 more reactive surfaces than a planar MEA. The square tile arrays have (w/a) tiles along the width of the MEA and (l/a) tiles along the length of the MEA. The total reactive area is equal to 4cwl/a+wl. The aspect ratio of the corrugation is defined as c/(a) and the reactive area to volume ratio is derived in Equation (4.6). A 4c + a = (4.6) V a( c + d + 2e + 2 f ) Figure 4.7: The isometric image of 3-D square tile corrugated MEA. For the 2D rectangular MEA model, A/V equation was the same as the equation in Prinz s group. However, the developments of other geometric models were not discussed in the paper for comparison. The relationships between area ratio between textured and planar MEAs, and aspect ratio of the corrugations were plotted for triangular, rectangular, circular disc tile, and square tile corrugation. However, A/V values of those corrugated geometries were not compared with the planar MEAs. The geometric analyses developed by Djilali s group did not include any 3D corrugation analyses and analyses of other corrugated geometries besides triangular 45
61 corrugations. The analyses were also only focused on the minimum required volume and reactive area of each corrugation but not the entire single cell. And also, the areas underneath the electrical contacts were not included as reactive area. A/V relationships for planar, rectangular, triangular, and square tile MEAs were developed and discussed in this chapter. These geometric models provide clear guidelines to designers how geometric parameters affect the A/V values of the geometries, which were not developed and reported in previous publications. 4.4 A/V Comparisons for All Geometries The ratios of the reactive area to volume of the single cell for planar MEA, 2-D rectangular and triangular MEA, and 3-D cubical tiles MEA are plotted in Figure 4.8 with respect to different aspect ratios of the corrugation patterns. The aspect ratio is defined as the ratio of the height to the width of the reactant conduit of the corrugation. Hence, the aspect ratios of 2D rectangular manifold and triangular manifold are determined to be 2c/a, and 3D square tile manifold is determined to be c/a. In order to compare the relationship between the A/V ratio and the aspect ratio of the geometries, numerical values are given to the geometric parameters as listed in Table 4.1. Figure 4.8 shows the comparison plot of the A/V ratio versus aspect ratio of all of the geometries investigated in this analysis. The plot shows that the A/V value of the planar MEA is constant for all aspect ratio geometries. However, the A/V ratio increases with the aspect ratio for 2-D and 3-D corrugated MEAs. Square tile corrugations have more reactive areas than 2D rectangular corrugations, so 3D square tile corrugations have the highest A/V values. This plot demonstrates that the A/V ratio of the MEA could be 46
62 substantially increased with the patterned corrugations. Hence, the projected power density should be greatly increased with higher aspect ratio geometries. Table 4.1: The summary of parameters used for geometric analysis. Parameters cm c 0.4 d e 0.03 f A/V (cm 2 /cm 3 ) Planar 2D rectangular 2D_triangular Planar_50% improvement planar_100% improvement 3D square tile Aspect Ratio Figure 4.8: The comparison plot between the A/V of different MEA geometric patterns. Figure 4.8 also shows that planar MEAs have the lowest A/V ratio than other geometries regardless of the value of the channel height, c. The A/V of triangular MEA is always lower than the corrugated rectangular and 3D square tile MEAs. This is because of the definition of aspect ratio of triangular MEA was set to be the ratio of the 47
63 channel height, c, to the average width of the channel a/2. This definition is highly dependent on the corrugation angle of the corrugation. The corrugation angle of triangular manifold, θ, was introduced in Equation (5). The correlation between the A/V and θ of the triangular MEA manifold is shown in Figure 4.9 by assuming that the total volume of the cell is constant. The plot illustrates that the A/V ratio increases with the corrugation angle. When θ approaches 90 degrees, the A/V ratio approaches to infinity, which is the similar as the rectangular manifold. The A/V ratio increases about 4 times as the corrugation angle changes from 30 to 76 degrees A/V (cm 2 /cm 3 ) Corrugation Angle (deg.) Figure 4.9: The A/V plot of triangular MEA manifold with respect to the corrugation angle,θ, assuming c and w are constant. 4.5 Performance Roadmap Figure 4.8 shows the theoretical relationship between the corrugation geometries and the gain in reactive area. The gain in reactive area also can be interpreted as the gain in power generation. Theoretically, Figure 4.8 can also be transformed into a 48
64 performance roadmap by assuming that the corrugated MEAs have the same performance as the planar MEAs and the power density is proportional to A/V, as shown in Figure Based on the constant A/V value of planar MEA, 50% and 100 % improvement lines are projected on Figure Those lines represent the performance requirement lines for corrugated MEAs. The required aspect ratios of the geometries for fabrication are determined by projecting the intersection points between the curves and the performance requirement line. Power Density (mw/cm 3 ) Project Target Aspect Ratio Planar 2D rectangular 2D_triangular Planar_50% improvement planar_100% improvement 3D square tile Figure 4.10: The performance roadmap for MEA geometry design. For example, the goal of this project is to enhance the performance of the planar MEA by 100%. The theoretical required aspect ratio for triangular corrugation is 1 as circled in Figure However, the required aspect ratios are only about 0.5 for 2D rectangular, and for 3D square tile corrugations. In this way, the performance 49
65 roadmap can provide sufficient geometric related information to the required performance enhancement. The geometry related information, such as corrugation type and aspect ratio, provides a starting point for the designer to layout the requirements of the MEA materials and fabrication processes, as well as a tool for the design of corrugated MEAs. 4.6 Performance Roadmap Limitations Although the performance roadmap of corrugated MEAs could provide geometric design guidelines to designers, many limitations were not included in the analytical models. The limitations arise from manufacturing and operation aspects of fuel cells. The manufacturing limitations consist of the size limitation of corrugations that can be fabricated. During the manufacturing process, deformations are also introduced to the MEA and affected its structural integrity and microstructures of the catalyst layers. The manufactured geometries may have limited space for integration of bipolar plates or wire meshes to MEAs for current collection. The operational limitations include the limited reactant supply and slow replenishment speed to densely-packed reactive areas, and the limited orientations of the MEA for CO 2 gas bubble removal. Since the scope of this research is mainly focused on the geometric and manufacturing aspects of the corrugated MEAs, the geometric limitation of the corrugations is investigated based on the MEA material properties and manufacturing processes. The minimum corrugation size, which can be manufactured by the forming processes, can be determined based on the minimum bending radius. The minimum bending radius was defined in Equation (3.9) of Chapter 3. The minimum bending radius is the smallest radius before a crack appears on the outside surface of the bend. In order 50
66 to prevent cracking of the MEA, the minimum bend radius was determined. According to the material property datasheet of carbon cloth shown in Appendix A, the fracture elongation of carbon cloth is 6.12%, hence the fracture strain, e f, is Equation (3.9) became e f = 1 = (2R / T ) + 1 T is the thickness of carbon cloth, which is 260µm. Therefore, the minimum bending radius, R, is calculated to be 1.99mm. In other words, the minimum spacing between two reactive surfaces has to be wider than 4mm as shown in Figure Carbon Cloth 4 mm Figure 4.11: The minimum corrugation width. During the forming process, limited bending or stretching occurs around the vertical, straight regions of the corrugations, so the heights of the corrugations are not restricted by the manufacturing processes. However, this did not indicate that the height of the corrugation could be increased infinitely. As the height of the corrugation increases towards the width or length of the planar MEA, the appearance of a horizontal corrugated MEA approaches the shape of a vertical MEA stack with small projected area but very high profile corrugations. In that case, the volumetric power densities of the planar and corrugated MEAs could not be evaluated by just comparing their projected areas anymore. 51
67 In order to compare only the projected area of the MEA, the total height of the MEA assembly is assumed to be fixed. Since the total height of planar MEA reactant channels includes channels from two bipolar plates, which is about two times that of the corrugated channels. For each bipolar plate channel height of 4mm, the total channel height of planar MEA is 8mm. If the minimum channel width of the corrugated MEA is 4mm, the highest aspect ratio of corrugated geometry should be lower than 2. Since the projected areas were used to calculate the projected MEA power densities, the targeted aspect ratios of the corrugations in this research were below 2. Another major concern for closely packed MEA corrugations is whether sufficient amount of reactants can be supplied to the reactive areas. This can be tested by calculating the maximum required fuel flow rate to operate the cell at its maximum power density. For the basic operation of a direct methanol fuel cell, methanol usage can be determined by the following equations: Charge = nf x amount of Methanol (4.1) Methanol usage = I/ nf moles/s (4.2) where I is the generated current and F is faraday s constant, n is the number of electrons generated from one mole of reactant. For direct methanol fuel cells, 6 moles of electrons are generated from one mole of methanol. Assuming a 4 cm 2 DMFC is operating at its peak power density of 50 mw/cm 2 at 0.3 V, then Equation (4.2) becomes Methanol usage = 0.667/ 6(96485) moles/s = 1.152e-6 mole/s The molar mass of methanol is kg/mole, so methanol usage is Methanol usage = 3.687e-8 kg/s 52
68 The density of methanol is 0.8g/cm 3. Methanol usage = 4.609e-5 cm 3 /s For MEAs with minimum size corrugations with an aspect ratio of 2, the crosssection areas of the reactant channels are equal to 0.32 cm 2. Then, the refill velocity of fuel within the corrugation is equal to 1.44e-4 cm/s. This refill speed is relatively slow within the corrugation and sufficient amount of reactants can be supplied to the MEAs with minimum size corrugations. Therefore, performances of the corrugated MEAs investigated in this research should not be affected by the reactant supply within the corrugations. 4.7 Summary This chapter presented the detail formulations which were used to develop the analytical model for A/V comparison between the planar geometry and different corrugated geometries. The comparison plot shows that 3D square-tile corrugated geometries have the largest A/V increment as the aspect ratio of the geometry increases. The relationship between A/V and corrugation angle of the 2D triangular corrugation is also determined. As the angle increases towards 90 degrees, A/V also increases infinitely. The performance roadmap is developed based on the relationship between A/V and the aspect ratio. For a specific performance enhancement requirement, the performance roadmap can determine the minimum aspect ratio requirements for different corrugations. The geometric limitation of the corrugated MEA is also discussed and determined to be 4 mm spacing between the corrugations. The geometry related information helps designer to start planning and designing for fabrication processes, which are discussed in the following chapter. 53
69 CHAPTER 5 BASELINE MEA FABRICATION AND RESULTS In order to compare the performance of the MEAs with different corrugations, the performance of the baseline planar MEAs should be evaluated. Since the hypothesis of this research is focused on the enhanced performance of the volumetric power density of corrugated MEAs, the performance of the corrugated MEAs will be evaluated relative to the performance of their corresponding planar MEAs before the forming process. Thus, the catalyst ink mixture and platinum loading ratios were not optimized for the best performance under the passive operation conditions. Although high quality MEAs can be purchased from many vendors such as E-Tek, Gore, and Fuel Cell Store, the standard MEA electrodes cannot be used for functional tests in this project. The specific reasons are explained in Section 5.1. The first part of this chapter details the steps taken to fabricate a functional membrane-electrode-assembly for performance testing of the fuel cells with planar and corrugated MEAs. The only difference between the corrugated MEAs and planar MEAs is the corrugation forming process, which is done after a PEM has been coated and hotpressed to a planar MEA. The second part of this chapter includes the design and fabrication of the test cells, performance test instrumentation, and the testing conditions. Finally, some results of the planar MEAs are discussed to illustrate the repeatability and the relationship between the power density and the active area of the planar MEAs. The details of the forming processes and performance results of corrugated MEAs are discussed in Chapter 6. 54
70 5.1 MEA Fabrication Process MEA is the core component in a direct methanol fuel cell system. For a conventional planar MEA, the flat cathode and anode are usually cut to standard shapes, such as square, circular, or rectangular. The major functionalities of an electrode include providing catalytic reaction sites for electrochemical reactions to take place, its porosity allows for gas or fuel diffusion, its stiffness provides mechanical support to the polymeric electrolyte membrane, and its high electrical conductivity provides the shortest electrical pathway for electron transport from reaction site to current collectors. Machined graphite bipolar plates are the common current collectors for direct methanol fuel cells. In the next step of this research task, the planar MEAs are shaped with corrugations and the performances of the corrugated MEAs are evaluated. However, since the flat bipolar plates cannot be used to support the structural integrity of the corrugated MEAs and provide the equivalent current collection function to corrugated MEAs, another temporary current collection solution has been developed for this project. Gold coated stainless steel wire meshes are widely used as current collectors for passive direct methanol fuel cells [15]. In order to simplify the testing setup and reduce the resultant discrepancies from inconsistent contact resistances between electrodes and current collectors during performance evaluation, the stainless steel wire meshes have been eliminated. Finally, a new carbon cloth with extended leads idea has been generated and implemented. Since carbon cloth is the backing material of electrodes and it is electrically conductive, the electrons can be collected outside of the fuel cell by cutting the shape of the electrodes to a standard square geometry with extended leads. Therefore, 55
71 the MEAs with customized electrode geometries have to be fabricated in-house and the details are discussed in the following sections Proton Electrolyte Membrane (PEM) Nafion 115 (thickness: 125µm, Ion-power) and Nafion 117 (thickness: 178 µm, Ion-power) membranes were used as the polymer electrolyte membrane for the planar and corrugated MEAs. Since the membranes were not protected from organic contaminants during shipment, they need to be cleaned to increase their protonic conductivity. The membranes were pretreated under the following immersion steps. The membranes were first immersed in 3% H 2 O 2 at 80 o C for 1 hour to remove any organic contaminants. Second, the membranes were rinsed in de-ionized (DI) water at 80 o C for 1 hour. Third, the membranes were held in 1M H 2 SO 4 solution at 80 o C for 1 hour to ensure full protonation and finally rinsed again in DI water to remove any trace acid Electrodes The fabrication of the electrode includes forming the reactive layer for power generation by coating a microporous layer on a gas diffusion layer and a catalyst layer on top of the microporous layer. The microporous layer improves the electrical conductivity of the carbon cloth and also provides larger supporting area for catalyst layer, which can increase the actual reactive area by providing more triple-point interfaces for power generation. The gas diffusion layers of the anode and cathode consisted of PTFE coated carbon cloth (E-Tek) of 260 µm thickness. Microporous layers were coated on the gas diffusion layers before the catalyst layers. The microporous layers were formed by coating a mixture of Vulcan 56
72 XC72R carbon black and 60% dry weight TEFLON emulsion (Aldrich) on the carbon cloth. Carbon black powder consists of carbon nanoparticles, which have large surface areas and are electrically conductive. The TEFLON solution allows the microporous layer to have a hydrophobic surface property, which prevents the cathode from being flooded by water. Subsequently, the coated carbon cloth was dried at 100 o C for 5 minutes and then 350 o C for 15 minutes. The glass transition temperature of PTFE is near 350 o C, so PTFE can reflow and level itself to form a uniform layer for better performance. Carbon and PTFE loading of the microporous layer were controlled at 2 mg/cm 2. Before the catalyst layer can be loaded onto the microporous layer, the catalyst ink for anode and cathode has to be prepared. Platinum is the commonly used catalyst material for PEM fuel cells. Since there are at least 6 consecutive reaction steps to oxidize methanol to carbon dioxide gas on the anode of DMFCs, carbon monoxide can be produced during the reaction steps, which would cause CO poisoning on reactive surface of platinum particles. However, many studies have also found that adding Ruthenium (Ru) to Platinum (Pt) can reduce CO poisoning. The carbon supported catalyst mixture purchased from E-Tek, Inc., was 60% Pt/Ru supported with Vulcan XC 72R carbon black, the atomic ratio between Pt and Ru is 1:1. The carbon particles in the catalyst mixture provide supporting surfaces for catalyst particles, which increase the reactive area of the catalyst layer and also provide a higher electrically conductive layer for electron transfer. During power generation, electrons, protons, and CO 2 gas are being generated at anode side triple-point interfaces. In order to effectively transport the protons from anode 57
73 to cathode to complete the cathodic half reaction, a continuous path of electrolyte is required between the catalyst layer and PEM. Therefore, 5 wt. % Nafion solution (Aldrich) was also mixed with catalyst mixture to provide ionic conduction for protons to transport from anode to cathode. After mixing the catalyst and Nafion solution with an ultrasonic agitator for few hours, the catalyst ink was ready to be used. The resultant catalyst ink was coated on the microporous layer to form the anode catalyst layer with 2.5 mg/cm 2 Pt. Since CO gas will not be generated during the cathodic half-reaction, no Ru particles need to be added to the catalyst mixture. The catalyst mixture purchased from E- Tek only contains 40% weight of carbon black and 60% weight of Pt. Catalyst ink for cathode is prepared based on the similar procedures as preparation of anode catalyst ink by mixing the catalyst material with Nafion solution. The catalyst loading on the cathode was controlled to be about 2.6 mg/cm 2 Pt. The coating technique is very critical for the uniform distribution of catalyst and, hence, the uniformity of power generation across the catalyst layer. The catalyst ink was coated to the microporous layer using a small paint brush. Since multiple thin layers of coating can improve the uniformity of the coating, the ink viscosity needs to be controlled by adding or evaporating the liquid content of the mixture until the viscosity is optimized. On the other hand, the size of the electrode can also affect the uniformity of catalyst distribution. The rule of thumb is that the larger electrode size has better chance to achieve more uniformly coated catalyst layer. The coating process takes place on a heated hotplate at 100 o C, so the ink can be dried very fast and cannot diffuse through the carbon cloth. A heavy metallic roller can 58

74 be used to compact each layer of coating to the backing layers and also can ensure the flatness of the catalyst layer for hotpress process. In order to achieve accurate Pt loading of each electrode, the weight of the electrode was recorded after each coating and drying process until the total weight of the electrode reached its intended weight Hotpress Finally, the anode and cathode are aligned and hot pressed to the pretreated Nafion 115 membrane. In order to form a good interface between the electrode and the Nafion membrane, a thin layer of Nafion solution is coated to the electrode to enhance the bond and ensure the ionic conductivity across the interface. A thin layer of Nafion is coated on the electrode and dried at 100 o C for 5 minutes. The planar MEA shown in Figure 5.1 was formed by placing a Nafion membrane between the anode and cathode, and hotpressing them together using a Carver Hotpress (Carver Inc., Model: 3912) at 150 o C and 100kgf/cm 2 for 5 minutes. Figure 5.1: MEA with carbon cloth electrodes with current leads. 59
75 5.2 MEA Reconditioning When the MEA is formed by hotpressing at high temperature, the Nafion membrane becomes dehydrated. As a result, it has very low ionic conductivity for ionic transport. In order to increase the ionic conductivity of the Nafion membrane and also enhance the catalytic reactions of the catalyst, MEAs need to be reconditioned before they can reach their good performances. During the cell reconditioning process, dehydrated Nafion membrane and Nafion ionomer in the catalyst absorb a lot of water to increase their ionic conductivities. In addition to the electrolyte membrane needing to be hydrated, the reconditioning process also removes the oxide layer outside of the catalyst, in this case, Pt and Pt/Ru. Removing the catalyst oxide layer can improve the catalytic activity of Pt and Pt/Ru. The catalyst oxides are usually removed by electrochemical methods such as applying reversed current flow to the cell to change the half reactions of the electrodes. Research groups have performed many studies to better understand the MEA reconditioning processes. Different reconditioning methods have been developed at different research groups; however, their methods can be summarized as followed. Method 1: Polarization curves were plotted from OCV to 0.1V repeatedly for 2 hours to condition the MEA at room temperature with 2M methanol and water mixture flow towards the anode and air supply to the cathode [63]. Method 2: Wet hydrogen gas can be supplied to both anode and cathode of the assembled cell at 60 o C for 12 hours while cycling between 0-0.2V versus the counter hydrogen electrode. The anode stream is then switched to 0.5M methanol. Then the fuel cell is conditioned by cycling between 0 and 0.7V until steady-state performance was attained [64]. Method 3: Cathode of the MEA is 60
76 sealed by a film which prohibits any air supply. 1 V (having the same polarity as an operating DMFC) is then applied to the cell from an external power supply for about 1 hour. In this process, surface oxides on the anode catalyst are reduced by electrochemically generated hydrogen [65]. The basic principle of MEA reconditioning is to hydrate the electrolyte membrane and improve the ionic conductivity of the membrane to enhance the efficiency of ionic transport. Since access to hydrogen gas in the laboratory is limited and hydrogen gas is dangerous, the above methods were not applied. In this project, MEAs were conditioned by flowing DI water across the MEA anode side at room temperature overnight. The electrodes were further activated by operating the cell under medium power generation range for many cycles. In this project, this step is usually done by operating the MEA with fuel and air at constant operation voltage of 0.3V for 30 minutes, stopping for another 30 minutes, and repeating many times until the MEA achieved its stabilized optimum performance. 5.3 Testing Process Test Cell In order to evaluate the performance of the fuel cell, the functionalities of the MEAs have to be evaluated. Since the performance of the planar MEAs and corrugated MEAs need to be measured under the same testing setup for comparison, the conventional graphite bipolar flow plates cannot be used for the corrugated MEAs. Conventional bipolar plates can only be used to perform functional tests on planar MEAs because the channel ribs of the serpentine flow channels would interfere with the 61
77 corrugations of the MEA. In order to perform functional tests on the 3D corrugated MEAs, a new test cell assembly must be designed and fabricated. The new test cell design and fabrication are summarized as follows. The design of the new test cell assembly must provide reactive areas with fuel and oxidant, which include a reservoir for methanol and water and a reservoir for air or oxygen. Since the ultimate goal of corrugated MEAs is to be used as portable power sources for handheld devices, no active pumping of air or fuel should be utilized in order to maximize the overall system power generation and to minimize the weight. In other words, the air reservoir can be exposed to the atmosphere as an air-breathing system. On the anode side, a simple fuel chamber for methanol and water is required for fuel storage with inlet and outlet for fuel refilling and CO 2 degassing. In order to prevent leakage of methanol and water to the cathode chamber, Poly-DiMethyl Siloxane (PDMS) gaskets are clamped between the chambers. The images of the test cell with a 3D MEA are shown in Fig. 5.2 and the cross-sectional schematic of the assembled test cell is shown in Fig This test cell design approach can also be applied to DMFC with active pumping of fuel and air, which requires having an enclosed cathode chamber for controlled airflow. 62

 from")
78 Figure 5.2: The cathode side of the cell (left) and the side view of the cell assembly with inlets and outlets of the methanol and water chamber (right). Air out CH3OH + H2O Perforate cathode chamber plate for air breathing Air in Fuel Reservoir Corrugated MEA Figure 5.3: The cross-sectional schematic of polymer test cells for 3-D corrugated MEAs. After designing the cell assembly from 3D CAD software, the CAD drawings were converted to STL files for rapid prototyping in a stereolithography apparatus (SLA) from 3D Systems, Inc. SLA is an additive, layer-by-layer fabrication process and has the capability to fabricate true 3D complex geometries rapidly [66]. 63
79 Many papers have reported that current collector corrosion and catalyst contamination problems came from the contacts between the flow plates and mixture of methanol and water, and polymer electrolyte membrane [67,68]. Although there were no current collectors within our test cell, preventing catalyst layers from contamination was still necessary. The test cell assemblies were placed into a Parylene deposition station for the coating process. Parylene is a type of polymer, which has low permeability towards most chemicals and gases [69]. After depositing a thin (10µm) parylene barrier layer on the internal surfaces of the cell assembly, MEAs can be assembled into the cell assembly with bolts and nuts for clamping. Since the perimeter clamping is only for preventing fuel leakage and not for reducing contact resistance between the electrodes and current collector, the overall clamping force can be reduced Test Setup The test setup consists of a PC computer with an IEEE data acquisition card installed to remotely control and store the collected data from the Solartron 1287 Potentiostat (Solartron Analytical, Berkshire, UK). The potentiostat acts as an electronic loader, which creates electrical resistance to drive the current flow from the fuel cell. The potentiostat has three connectors, working electrode is connected to the anode and the reference electrode was shorted with counter-electrode and was connected to the cathode of the fuel cell. The schematic diagram of the measurement setup is shown in Figure 5.4. In order to ease the refill process to the anode chamber, a mini-variable speed pump (VWR Scientific Product) was used to connect to the inlet of the chamber. The pump is turned off during the measurement to maintain the passive operation conditions, which are discussed in the following section. 64
80 - + Solartron Potentiostat CH 3 OH + H 2 O Figure 5.4: The schematic diagram of performance test setup Testing Conditions In order to simulate the portable operation conditions and to minimize the weight of the system, the MEAs were tested under passive operation conditions. The passive operation conditions are defined as operating the cell at room temperature without any external heating and no active pumping of fuel and air. The external heating source requires extra power supply, which can significantly lower the net power output of micro fuel cells for portable applications. The supply of the fuel and air to the anode and cathode is only through free convection without the forced flow, or with the aid of a pump or a fan. The fuel was supplied to the anode by immersing the anode to the methanol water mixture chamber and the air was supplied to the cathode by natural convection on cathode surface through a perforated plate. By eliminating the auxiliary components of the systems for heating and cooling, the weight of the micro fuel cell is dramatically decreased and the design of the passive fuel cell system is also simplified. 65
81 Air and 2M methanol were supplied to the electrodes passively at room temperature for all the tests discussed in this chapter Test Protocol The MEAs were tested after the MEAs were reconditioned for many hours with 2M methanol and water mixture. In order to avoid the problem of cathode flooding or water condensation on the cathode, the current output of the constant voltage measurement as a time function was measured sequentially from 0.5 V to 0.3 V with an increment of 0.1V for low current output, then from 0.3 V to 0.1V with an increment of 0.05V for high current output. Each measurement would usually take about 15 to 30 minutes, which is highly dependent on the stability of the current as a function of time. Since more fuel was consumed for energy conversion and fuel crossover at lower operation voltage, the fuel reservoir was replenished with fresh methanol water mixture for each of the constant voltage measurements to avoid the performance reduction caused by insufficient fuel supply. The average current for that particular voltage was calculated based on the last 10 minutes of the reading. Finally, all the average current values with their respective voltages were used to generate the polarization curve for performance evaluation. Although most of the time the current measurement would take 30 minutes of measurement, when low electronic load with high voltage reading close to the OCV was applied to the cell to drive the MEA for low current flow, instability of the current flow was observed. When MEAs are exposed to highly concentrated methanol water mixture and only a small amount of fuel is converted to power at low electronic load, large concentration gradient is formed across the electrolyte membrane. Thus, a large amount 66
82 of methanol diffuses across the electrolyte membrane and lowers the current density of the fuel cell. Therefore, the reading was taken for 30 minutes only if the current flow was stable. Many papers have documented that the electrolyte membrane and electrodes of direct methanol fuel cells will degrade within a few days or weeks during operation [70, 71]. Thus, during the measurement of the MEAs, the performance of each MEA was measured within the same day or two consecutive days to ensure the consistency of the MEA performance. After each set of average current and voltage readings has been recorded, a potentiodynamic measurement was also used to dynamically measure the performance of MEAs. Starting voltage (near OCV) and ending voltage (0 Volt) values were input into the menu of Potentiodynamic test. The potentiostat applied varied electronic loads between the electrodes at a preselected scan rate, usually 10mV/sec. The current reading was recorded at a preset sampling rate to record the dynamic response of the MEA towards the dynamic loads. 5.4 Performance Results The performance results of the planar MEAs are summarized in this section. In the first part of this section, the quality of the MEAs fabricated in-house has been studied by characterizing the MEAs with a repeatability test. The repeatability test has been conducted by fabricating several 4 cm 2 MEAs with similar Pt loading rate and testing under the same operation conditions. In the second part of this section, the relationship between the size of the reactive area and their power density has also been studied. Three MEAs were fabricated with size ranges of 1cm 2, 4cm 2, and 6.25cm 2. 67
83 5.4.1 Repeatability Tests The planar MEAs have Pt loadings on cathodes from mg/cm 2 and on anodes from mg/cm 2, as shown in Table 5.1. Although the Pt loadings of anode and cathode are not exactly the same for comparison, the greatest loading difference is less than ±15%. Since the catalyst coating process is handled manually using a painting method, the coating consistency between MEAs is difficult to control. Table 5.1: Platinum loading on anode and cathode of MEA used for repeatability test. MEA # Anode Pt loading (mg/cm 2 ) Cathode Pt loading (mg/cm 2 ) The polarization curves of the above MEAs are shown in Figure 5.5 and the projected power density performances are plotted in Figure 5.6 for the repeatability test. The power densities were calculated based on the projected areas (4 cm 2 ) of the planar MEAs. The plot shows that the performances of MEA 19 and MEA 23 are very similar with less than 10% difference for all operation voltages. The platinum loadings of MEA 19 and MEA 23 in Table 5.1 only have ± 0.12 mg/cm 2 difference on anode and ± 0.01 mg/cm 2 difference on cathode. Hence, the performances of the MEAs are consistent with the Pt loadings on the MEAs. Furthermore, Figure 5.6 also showed that when platinum loadings on cathode and anode on MEA 24 and MEA 27 were increased, the performance was further improved. Although, MEA 26 has very similar Pt loadings as MEA 24, its performance was not as 68
84 good as MEA 24. After MEA 26 was assembled for testing, the swelling of the Nafion delaminated one corner of the anode. This is usually caused by the non-uniform pressing force on the MEA during the hotpressing. MEA 26 was hotpressed again to ensure its electrode interface integrities. However, the rework has lowered the performance of MEA26. Although the MEA performance is closely related to the platinum loading, optimizing the platinum loading for best MEA performance was not the scope of this project. Therefore, the platinum loadings on MEAs throughout this thesis were not optimized but the fabrication processes were followed consistently for all of the MEAs. 4 cm 2 MEA Repeatability Test Operating voltage(v) MEA26 MEA 27 MEA 28 MEA 24 MEA 23 MEA Current Density (ma/cm 2 ) Figure 5.5: Polarization curves of repeatability test of 4cm 2 cells. 69
85 3.5 Projected Power Density (mw/cm 2 ) MEA 26 MEA 27 MEA 28 MEA 24 MEA 23 MEA Current Density (ma/cm 2 ) Figure 5.6: Power density curves of repeatability test of 4cm 2 cells Reactive Area vs. Power Density The major goal for this project is to increase the volumetric power density of the fuel cell by patterning MEAs with 2D or 3D corrugations. In other words, the size of the MEA can be increased while it can still fit within a small volume and maintain its performance as a planar MEA. For large size planar MEA that was assembled between bipolar plates, the distance between the reactive sites to the nearest current collector should be very similar across the assembly if the current collector ribs on the bipolar plates were well designed. The current collection contacts on bipolar plates are evenly distributed as illustrated in Figure 5.7. In this project, no external current collectors were integrated within the cell, thus the distance between the reactive sites to the nearest current collection lead changes as the size of the electrode changes, which is shown in Figure 5.8. The width of the current collection leads is about 25% of the width of the 70
86 reactive area. Therefore, it is important to identify the performance degradation caused by the size change of the reactive areas. The planar MEAs have Pt loading on cathodes from mg/cm 2 and on anodes from mg/cm 2, as shown in Table 5.2. Although the Pt loadings of anode and cathode are not exactly the same for comparison, the causes of the resultant performances should be dominated by the size of the reactive areas. A MEA A Serpentine Reactant channel Rib of Serpentine channel on bipolar plate (A) Electrode Ribs of Serpentine Bipolar Plate Channels (B) Figure 5.7: (A) is the side view of a fuel cell assembly with MEA clamped between two graphite bipolar plates machined with serpentine flow channels. (B) is the A-A cross-sectional view figure (A). The equal distance between the reactive areas to the nearest channel ribs for current collection is shown in blue arrows. 71
87 Figure 5.8: The schematic diagram of electrodes with current collection lead. The path and distance differences from different reaction sites are shown in yellow dashed lines. Table 5.2: Platinum loadings on anode and cathode of MEAs used for correlation study of reactive area versus power density. Anode Pt loading (mg/cm 2 ) MEA Area (cm 2 ) Cathode Pt loading (mg/cm 2 ) The polarization curves of three MEAs with 1cm 2, 4 cm 2, and 6.25 cm 2 are summarized as shown in Figure 5.9 and the power density performance curves are shown in Figure Figure 5.9 shows that the open circuit voltage of 1 cm 2 MEA is relatively lower than 4 and 6.25 cm 2 MEAs. One of the possible reasons for this might come from the non-uniformity of the catalyst coating process, which has been mentioned in Section 5.1 that smaller electrode size can have uneven catalyst distribution during the coating process. Based on the above results, the relationship between the maximum power density and different MEA sizes is illustrated in Figure It shows that the power density decreases as the MEA size increases. For this particular electrode design, the power densities of small MEAs are higher than the power densities of larger MEAs. Although the poor performances of these MEAs may be caused by the inconsistent Pt loading on 72
88 the electrode, their internal ohmic resistances are also very high. In order to keep the performance results to be consistent and be able to eliminate the effects from the size changes, same size MEAs (4 cm 2 ) were used to compare the performances of MEAs before and after the corrugation processes in Chapter 6. For conventional bipolar plate design, if the areas of the current collection contacts on the bipolar plate are well designed, the power densities of different size MEAs should remain constant. If the bipolar plates were not designed correctly, the internal resistances of the MEA and bipolar plate could also increase. The results in Figures 5.9 and 5.10 indicate that the ohmic loss across the electrode area is significant and external current collectors, such as gold-plated stainless steel wire meshes, are necessary to be integrated into the cell assembly for performance enhancement. However, no external current collectors were used in the test cell assemblies of this project in order to maintain the simplicity of the experimental setup. 0.6 Operating Voltage (V) cm2 4cm cm Current Density(mA/cm 2 ) Figure 5.9: Polarization curves of repeatability test of 4cm 2 cells. 73
89 3.5 Projected Power Density (mw/cm2) cm2 4cm2 6.25cm Current Density (ma/cm 2 ) Figure 5.10: The power density curves of different sizes of MEAs. Power density vs. Planar Area 3.5 Max. Power Density (mw/cm 2 ) Area (cm 2 ) Figure 5.11: The relationship between the maximum power density and MEA sizes. 74
90 5.5 Summary This chapter presented the detail fabrication processes to prepare the components of the MEAs, formation of planar MEAs, and testing setups. The consistency of the fabrication processes of the baseline MEAs is illustrated by showing the results of a repeatability test of 4cm 2 MEAs. Then the relationship between the power density and MEA sizes was also investigated for the electrode with current lead design. The result is consistent with the conventional bipolar plate configurations. Although the performance drop is significant from this current lead design, a simplified system with consistent current lead size is more important for the performance evaluation of the corrugated MEAs. In Chapter 6, the different manufacturing processes, which can be applied to the forming of MEA corrugations, will be discussed. The detailed forming processes will be described and the performance of the corrugated MEAs will be evaluated based on the planar MEAs discussed in this chapter. 75
91 CHAPTER 6 CORRUGATED MEA FABRICATION AND RESULTS After the fabrication process and quality of the planar MEAs had been evaluated and characterized in the last chapter, the planar MEAs were ready to be formed with corrugations. Several alternative manufacturing forming processes were investigated and discussed in the first section of this chapter. The forming process investigation found that the pressing and folding processes were the most feasible processes, which could be implemented in the laboratory for experimental evaluations. The detail design and fabrication procedures of the aluminum molds for the forming processes are described in the second section of this chapter. In the third section, the detail pressing and folding procedures are disclosed for forming 2D and 3D geometries. Before getting into the performance results of the corrugated MEAs, some visual observations of the corrugated MEAs are discussed in the fourth section. The performance comparisons between the planar MEAs and corrugated MEAs are presented in the last section of this chapter. 6.1 Alternative Manufacturing Processes to Form Corrugated MEAs Before a specific method was adopted for forming the MEA corrugations, various manufacturing processes were investigated. There are mainly four methods of fabricating corrugated MEAs using standard manufacturing techniques. The detail fabrication and integration processes for each method are described in this section. 76
92 6.1.1 Method 1 The Nafion membrane needs to be formed uniformly with corrugations. Then, the catalyst layers are painted or sprayed onto the Nafion membrane directly or onto the carbon cloth directly in order to have good mechanical support for the thin catalyst layers. Finally, the pre-formed Nafion membrane needs to be pressed together with catalyzed carbon cloth using corrugated molds. Or, the catalyzed Nafion will be pressed together with the carbon cloth. In this method, Nafion is required to be formed with corrugations. The available forms of Nafion and the possible forming processes need to be investigated. Nafion is classified as one type of thermoplastic polymer, so it can be shaped with corrugations using different manufacturing processes. DuPont NAFION PFSA materials are sold in pellet, finished membrane, or dispersion forms [72]. Therefore, corrugated Nafion can be formed by injection molding Nafion pellets using machined molds with corrugated patterns. Most of the Nafion membranes are finished by extrusion, therefore, extrusion process can also be used to fabricate corrugated Nafion membranes. Rolling can form corrugated geometries as well but the corrugations come from the reduction of its original thickness using compressive forces. Although extrusion and rolling processes can fabricate corrugated Nafion membranes, the corrugation geometries are limited to 2D. In order to fabricate Nafion membrane with 3D corrugations, injection molding and casting could be the possible processes to form simple 3D geometries. Since most of the commercially available Nafion dispersions are less than 20 weight percent (wt. %) solution, it will not be possible to fabricate corrugated Nafion using liquid casting process. Since most of the volume of the solution will be vaporized during the drying 77
93 process, only non-uniform thickness membrane could be formed as illustrated in Figure 6.1. (A) (B) Figure 6.1: Liquid casting processes of Nafion. (A) High aspect ratio geometries; (B) low aspect ratio geometries. Although the process may seem simple and straight forward, there are many technical problems that may appear and affect the performance of the MEAs. First, if the Nafion is pre-formed with corrugations and then catalyst ink is sprayed or coated onto its surfaces, the liquid content in the catalyst ink may cause the Nafion membrane to swell during the coating process, which affects the uniformity of the catalyst layer. Second, carbon cloth is quite fragile and has low tensile strength for stretching during the pressing process. If the carbon fibers on the carbon cloth were torn and ragged, the electrical conductivity of that electrode may drop and the ohmic resistance of the cell may increase. Third, since the corrugated Nafion membrane must be assembled together with the carbon cloth backing layers in the corrugated molds, non-uniform pressing force would be applied to the corrugated MEA surfaces. The non-uniformity of the pressing force can greatly affect the interfacial properties of the MEA and decrease the ionic conductivity of the cell. This method was not pursued in this project because of its long fabrication process with associated technical issues. 78
94 6.1.2 Method 2 Woven carbon cloth pre-formed with corrugated geometries is required for this method, so the carbon fibers would not be damaged during the integration process with the electrolyte membrane. Then, the catalyst ink can be sprayed or painted on the corrugated carbon cloth. For the integration of the Nafion membrane, many possible processes can be applied. If high concentration Nafion dispersion is available, Nafion can be sprayed uniformly to the catalyzed carbon cloth, which can maintain good ionic connectivity at the catalyst-electrolyte interface. A corrugated Nafion membrane can also be assembled with the catalyzed carbon cloth, and then they can be pressed together between the corrugated molds. Carbon fibers are high strength materials. However, they are quite brittle and can not withstand high tensile stress during the bending and drawing processes. Therefore, it will be difficult to form the corrugations after the carbon fibers are woven as carbon cloth. Forming techniques of woven carbon fiber to 2D or 3D geometries have been widely applied to other commercial applications, such as reinforcement of pressure vessels, speakers, and carbon fiber sleeves for strength enhancement, as shown in Figure 6.2. Thus, it will be easier to form carbon fibers to corrugated geometries during the weaving process. The biggest problem of this method is the non-uniform pressure distribution during the assembly process of catalyzed gas diffusion layers and Nafion membrane. The geometries of the molds can be optimized to reduce the non-uniformity across the molding area. Besides this issue, this method seems like a promising method to fabricate corrugated MEAs. However, since corrugated carbon cloth is not available for purchase 79
 3D Woven Pressure Vessel [73].")
![(B) Carbon fiber cone of a speaker [74], (C) carbon fiber sleeve [75]. 6.1.](/docs-images/88/115672173/images/95-1.jpg "3 Method 3 In this method, non-uniform distribution of pressing force during the hot-press process is avoided by forming the planar MEA conventionally at the beginning by applying uniform force")
95 and the cost of customized corrugated carbon cloth will be very high, this method can not be investigated in this project. If the corrugated carbon cloth is mass produced in industry, the method can be implemented for corrugated MEA manufacturing. A B C Figure 6.2: (A) 3D Woven Pressure Vessel [73]. (B) Carbon fiber cone of a speaker [74], (C) carbon fiber sleeve [75] Method 3 In this method, non-uniform distribution of pressing force during the hot-press process is avoided by forming the planar MEA conventionally at the beginning by applying uniform force across the MEA as described in Chapter 5. This approach can ensure the quality of the interfaces between the catalyst layers and Nafion. Then the planar MEA is placed between a set of molds, which are made of metallic materials and machined with 2D or 3D geometries. By pressing down on the top piece of the mold set, 80
96 the MEA is forced into the cavities of the molds and formed into the shape of the mold geometries. Carbon fibers in carbon cloth are quite brittle for bending and stretching, which are the major phenomena during this pressing process. Large deformations are generated because only limited material volume above the projected area of the cavity is forced into the cavity. Based on the conservation of volume, the MEA has to reduce its thickness in order to conform to the shape of the cavity. The carbon cloth could not withstand high tensile stress during the forming process; it would just fracture. Thus, Nafion would be the only component to take on the high tensile stress by elongating itself. And also, the deformation is non-uniform across the mold. Since the material around the perimeter of the molds would flow towards the cavities around the perimeter, the deformation level around the perimeter of the mold is smaller. Since this method is the simplest and easiest process to form corrugated MEAs, this forming method will be investigated to form corrugated MEAs for validation of power density enhancements Method 4 Similarly to Method 3, the conventional planar MEA process was utilized. The second step of this method is to form 2D corrugations using rotational molds. The rotational molds are driven by the rotational motors and gear trains at slow speed. While the molds are rotating, MEA is folded into the cavities of the molds one by one. The manual version of this process is similar to the folding process. This process is adapted from the corrugated paper cardboard process as shown in Figure 6.3. During the paper corrugating process, paper with adhesive is steam heated to 81
97 150 o C and turns adhesive into the gelatinized form. Then the paper wraps itself around the top corrugating roll and corrugations are continuously formed. Although paper is quite brittle, the adhesive in the paper changes forms and maintains the final shape of the corrugated paper. A similar idea is also applied to this method, wherein Nafion acts as the adhesive of the carbon cloth layers. Nafion becomes softer at high temperature and changes the planar MEA to conform to the geometries of the molds. When Nafion is cooled to room temperature, it maintains the shape of the corrugated MEA. There are some technical issues with this method as well. Although the adhesion of Nafion can keep most of the carbon fibers in the carbon cloth in corrugated form, some of the carbon fibers break during the bending and stretching of the forming process and detach from the electrodes. A possible solution will be adding more electrically conductive polymeric binder into carbon cloth to increase its tensile strength, but the binder may decrease the porosity and electrical conductivity of the gas diffusion layers. Even though this forming process can only corrugate 2D geometries and rotational molds are not available in the laboratory, it seems like a feasible method for forming corrugated MEAs to validate their volumetric power density enhancement. Since the rotational molds form corrugations with the continuous supply of MEA, the motion causes lower stress on the MEA than the pressing process. Hence, this method has higher yield of forming corrugated MEAs with fewer deformations. Therefore, this method is used to evaluate the forming process of corrugated MEAs. 82
98 Figure 6.3: The schematic diagram of corrugated paper cardboard forming process with rotational molds [76]. 6.2 Forming Process Since Method 3 and Method 4 would be applied to fabricate corrugated MEAs and both of the methods require molds to define the corrugated geometries, molds needed to be designed and fabricated. The detail design and fabrication tools and procedures are described in this section Mold Design and Fabrication Patterning corrugated MEAs requires metallic molds, which provides the corrugated surfaces for the MEA to be formed. In terms of material selection, mold materials should always be stronger and harder than the forming materials. Since the MEA is not such a high strength laminated structure, either aluminum or stainless steel would be good materials for mold sets. Aluminum is a softer metal than stainless steel, so the machining time for aluminum will be much shorter than stainless steel. Therefore, aluminum was selected to be the mold material. The computer-aided design (CAD) software, SOLIDWORKS (Solidworks Corporation, Concord, MA), was used to draw and generate 3D geometries. After the corrugated geometries are modeled using SOLIDWORKS software, the Initial Graphics 83
, was used to prepare and generate the machining codes for the machine.")
 2cmx2cm, 3D corrugation aspect ratio= 0.")
99 Exchange Specification (IGS) files are exported. Since SOLIDWORKS could not export the computer numerical control (CNC) machining codes, intermediate software, SURFCAM (Surfware Inc., Westlake Village, CA), was used to prepare and generate the machining codes for the machine. In SURFCAM, the cutting speed, layer depth, and path are defined before the codes are generated for the machine to follow. After several hours of machine setup and milling process, 2D and 3D aluminum molds are finished as shown in Figure 6.4. Figure 6.4: CNC machined Aluminum molds (left) 2cmx2cm, 3D corrugation aspect ratio= 0.25 and (right) 5cmx5cm, 2D corrugation aspect ratio= Pressing process 2D and 3D corrugations Mold halves include male and female pieces of the mold. Two pieces can fit into one another with predefined spacing and tolerances between the corrugations. When the MEA is placed between two mold halves, it is necessary to ensure the protrusion geometries on the male half would fit into the cavities on the female half. Since the mold halves have the same outside dimensions and have the same offset distance between the corrugations, the corrugations can be easily aligned by lining up the edges of the molds. After the planar MEA is placed between the molds and the molds are aligned, they are placed between the platens of the hotpress to heat the assembly above Nafion s 84
100 glass transition temperature at 120 o C. Once the temp is reached, pressure is applied to the top piece of the mold which forces the MEA to be deformed into the shape of the corrugations as shown in Figure 6.5. The function of this step is only to form corrugations onto the MEA; it is not necessary to apply an external pressure towards the MEA after the bottom surface of the MEA has made contacts with the bottom mold half. If extra pressure is applied to the MEA beyond that point, the ribs of the MEA corrugations would be further compressed and become thinner. After the MEA is conformed to the shape of the molds, it is cooled with the molds to allow the monomers within the Nafion to have sufficient time to reorient themselves to the new geometry. In that way, no thermal strain or stress will be generated during the cooling process. This pressing process allows all of the corrugations on the MEAs to be formed within the same step. Therefore, it is a very effective process to form corrugations. Pressure Figure 6.5: The schematic diagrams of pressing process to form MEA corrugations. 85
101 6.2.3 Folding process - 2D corrugations The folding process is modified from Method 4. Rotational molds are used to form corrugations in Method 4. Since rotational molds are not available in the laboratory, regular stationary molds are used for this process instead. In order to simulate the similar forming process as using rotational molds, corrugations are formed one at a time as shown in Figure 6.6. In the first step, the first pair of cavity and protrusion is aligned for compression of the planar MEA. Once the first corrugation is formed, then the top piece of the mold moves forward and aligns with the lower piece for second corrugation. Then the second corrugation is formed. The procedure is repeated until the entire MEA reactive area is formed with corrugations. Pressure Pressure Figure 6.6: The schematic diagram of folding process to form MEA corrugations one by one. Since the edges of the mold pieces are not aligned with each other during the processes, a special alignment feature has been added to the mold set as shown in Figure 6.7. The biggest concern for misalignment of the molds is that the uneven spacing between left and right of the mold cavity can severely damage the MEA or even the molds. The alignment feature includes a row of holes on both sides of the molds. For each corrugation forming process, two dowel pins are inserted into the holes next to the 86

102 corrugation of the bottom mold piece. By aligning the holes of the top mold piece to the dowel pins, the geometry on the top piece can be centered with the bottom piece to ensure the spacing is even on either side of the cavity. This feature can also ensure there is a uniform spacing between the corrugations. Figure 6.7: The image of aluminum molds with 2D corrugations and alignment pins. 6.3 Testing Procedures After the planar MEAs had been patterned with corrugations, the high temperature at the forming process dehydrated the MEA. Therefore, a similar hydration process as mentioned in Chapter 5 needs to be followed in order to recondition the cell before it can be used for power generation. The hydration step usually takes more than 24 hours to condition the cell at room temperature with the continuous flow of DI water into the fuel chamber of the test cell. After the hydration process, 2M methanol is filled with the chamber and allowed it to diffuse into anode. Then, 0.3V to 0.4V of electronic load is applied to drive the cell and activate the catalyst for 30 minutes. Similar steps are repeated until the performance of the cell is stabilized. For the performance test, constant voltage load from 0.1V to 0.5V is applied for 30 minutes and the corresponding current 87

103 density is averaged. The test is completed when sufficient data points are collected for the polarization curve. 6.4 Experimental Results Pressing Process After the pressing process, the corrugated MEAs were visually inspected. 3D corrugated MEAs with low aspect ratio of 0.25 showed no visual deformation as shown in Figure 6.8. However, severe deformations were found on 3D corrugated MEAs with aspect ratio of 0.5, as shown in Figure 6.9. The majority of the visual deformations are shown on the carbon cloth. Many of the carbon fibers are detached from the Nafion membrane. This shows that this kind of severe physical deformation can greatly reduce the performance of the MEA. Figure 6.8: Corrugated MEA patterned with 3D dome-shaped geometry (aspect ratio = 0.25). 88

104 Delaminated carbon fibers near the bottom of the cavity Figure 6.9: Deformations on corrugated MEA patterned with 3D dome-shaped geometry (aspect ratio = 0.5). Based on the performance roadmap in Chapter 4, the performance goal of this project is targeted at 50% performance enhancement. For 3D square tile or dome-shaped geometry, the aspect ratio of the corrugated geometry is required to be 0.5. After the forming process, the overall projected area of the MEA was reduced from 5.06 cm 2 to 4.74 cm 2, which is a reduction of 6% of its projected area. Since the pressing process is forcing a fixed amount of material into a deep cavity instead of pulling materials from the sides into the cavity, the projected area was not reduced significantly. If many visual deformations have already been observed after the forming process and the volume of the cell is not drastically reduced, 50% performance enhancement could probably not be achieved electrochemically. The experimental results of the MEA (shown in Figure 6.9) before and after the 3D corrugation formation are shown in Figure The results were collected using potentiodynamic sweep from OCV (0.434V for planar MEA and 0.405V for 3D MEA) to 0 volt with scan rate of 10 mv/s. The figure shows that the maximum power density of the corrugated MEA was only about half of the power density of the 89
105 planar MEA after it had been corrugated with 3D geometries. The poor power density performance and the severity of the physical deformations indicated that the pressing process is not a good method to form corrugations on MEAs and the process should not be further pursued Power density (mw/cm2) D planar Operating voltage (V) Figure 6.10: Projected power density comparison of the planar and 3D corrugated shapes of the MEA Folding Process The folding process has been applied to pattern planar MEAs with 2D rectangular corrugation. After the forming process, no significant deformations were found on carbon cloth electrodes as shown in Figure Based on the performance roadmap, the rectangular corrugations with aspect ratio 0.75 and 1.25 should have power density improvement of about 20% and 100%, respectively. However, if the distance between the top and bottom molds is not well controlled, large compression force may cause some deformations on the carbon cloth. The location of the deformation is primarily near the edge of the ribs as show in Figure
. A crack was found on the carbon cloth.")


106 A B Figure 6.11: Images of corrugated MEAs with aspect ratio of (A) 1.25, (B) Crack on the carbon cloth Figure 6.12: Image of a MEA with rectangular corrugations (Aspect Ratio =0.75). A crack was found on the carbon cloth. Since the pressing process failed to pattern MEAs with 3D corrugations, the folding process is also applied to form 3D corrugated MEAs. Since the working mechanism of the folding process is based on pulling materials from the free end and folds into the cavity, a similar concept can also be applied to 3D geometries. Instead of forming all the corrugations at once, each corrugation is formed one at a time. For each corrugation, two sides of the cavity are fixed and material can be pulled into the cavity from the other two free sides. Although winkles may be created near the corner of the 91

107 cavity, where two free sides met, 3D corrugations should be formed. After applying this method towards the 3D corrugations, many deformations are still found near the bottom of the cavities as shown in Figure One of the explanations for this phenomenon is that carbon fibers are too stiff for bending. Because of the small cavity size in the mold, the bending angle within each cavity is quite large. Thus the carbon fibers fractured near the bottom of the cavities. Deformations Figure 6.13: 3D corrugated MEA with delaminated carbon fibers after corrugations are formed one by one (Aspect ratio = 0.75). After the multiple failures from forming 3D corrugated MEAs, the investigation of the forming process was decided to focus on the folding of 2D corrugated geometries. The performances of the MEAs before and after the folding process are also compared in this section by forming MEAs with rectangular corrugations with aspect ratios of 1.25 and Corrugated MEAs with aspect ratio =1.25 From the repeatability test results of Chapter 5, MEA 24 has one of the highest maximum power densities compared to the other MEAs. After forming 2D rectangular 92
108 corrugations with aspect ratio of 1.25, the projected area of the planar MEA is reduced from 4 cm 2 to 2 cm 2. The corrugated MEA was tested for performance and the projected power density curve is shown in Figure The power densities of the planar and corrugated MEA 24 were calculated based on projected areas of 4 cm 2 and 2 cm 2, respectively. The actual power output from the corrugated MEA is about 25 to 30% lower than the power output from the planar MEA. However, the significant volume reduction allows the maximum volumetric power density of the corrugated MEA to increase by over 45%. The repeatability test results in Chapter 5 also showed that MEA 19 and MEA 23 have the most repeatable performances based on their similar Pt loading rates on anode and cathode. Figure 6.15 shows the polarization curves of MEA 19 and MEA 23 by projecting polarization curves of the corrugated MEAs on top of the planar MEAs. It shows that after the forming processes, their performances are still very similar to each other. This repeatability indicates that the forming processes have been performed consistently. 93
109 Polarization Curve of MEA 24 Projected Power density (mw/cm 2 ) Current Density (ma/cm 2 ) planar (4cm2) 2d (2cm2) Figure 6.14: The power density curve comparison of MEA 24 before and after the corrugation process. Polarization Curve (AR=1.25) Operating Voltage (V) MEA 19 planar MEA 19 2D MEA 23 Planar MEA 23 2D Current Density (ma/cm 2 ) Figure 6.15: The polarization curve comparison between the planar and corrugated geometries of MEA 19 and MEA
110 After the corrugation process, the overall power output of the planar MEAs had been reduced by 40 to 50%. Despite the large power output reduction, the volumetric power densities of the corrugated MEAs are still increased by 20 to 25% as shown in Figure Performance Curve (AR=1.25) Projected Power Density(mW/cm 2 ) MEA19_planar (4cm2) MEA19_2D (2cm2) MEA23_planar (4cm2) MEA23_2D (2cm2) Current Density (ma/cm 2 ) Figure 6.16: The power density curve comparison of planar and corrugated MEA 19 and MEA 23. One phenomenon was observed from the performance results of the corrugated MEAs discussed in this section. The performance enhancement of the corrugated MEAs is highly dependent on the quality of the planar MEAs. Since MEA 24 has better performance than MEA 19 and MEA 23, it has gained 45% volumetric power density, but the volumetric power densities of MEA 19 and MEA 23 have only improved by 20%. This indicated that the performance can be further enhanced on the state-of-the-art, high quality MEAs. 95
111 Corrugated MEAs with aspect ratio =0.75 MEAs 26, 27, 28, and 29 were corrugated with rectangular corrugations with aspect ratio of 0.75 to evaluate the performance impact from the forming process. Figure 6.17 shows the polarization curves of the MEAs before and after the corrugation process. The figure shows that all of them have lower current outputs after the corrugations have been formed. The actual power output loss caused by the forming process ranges between 20 and 30% of their original planar geometry. As the slopes of the polarization curves become steeper, the resistances that they represent within the corrugated MEAs become higher. The detailed investigations of the internal and system resistances are discussed in Chapter 8. Figure 6.18 shows the projected power density comparison of the MEAs before and after the corrugation processes. After the corrugation processes, the projected areas of planar MEAs were reduced from 4 cm 2 to 3 cm 2, which were used to calculate the projected power densities of the MEAs. Although the projected areas of the 2D MEAs have been reduced by 25%, the power densities after the corrugating process are about the same or even lower than the power densities of the planar MEAs. The enhanced area cannot compensate the loss of power output due to the deformation process. Therefore, the performance loss due to mechanical deformations and alteration of electrode microstructures surpasses the reactive area gain from the corrugations. 96
112 0.6 Operating Voltage (V) MEA 26, planar,4cm2 MEA 27, planar,4cm2 MEA 28, planar,4cm2 MEA 29, Planar,4cm2 MEA 26, 2D,3cm2 MEA 27, 2D,3cm2 MEA 28, 2D,3cm2 MEA 29, 2D,3cm Current Density (ma/cm 2 ) Figure 6.17: The polarization curve comparison of planar and corrugated MEA26, MEA 27, MEA 28, and MEA Projected Power Density (mw/cm 2 ) MEA 26, planar,4cm2 MEA 27, planar,4cm2 MEA 28, planar,4cm2 MEA 29, Planar,4cm2 MEA 26, 2D,3cm2 MEA 27, 2D,3cm2 MEA 28, 2D,3cm2 MEA 29, 2D,3cm Current Density (ma/cm 2 ) Figure 6.18: The power density curve comparison of planar and corrugated MEA26, MEA 27, MEA 28, and MEA
113 For MEA corrugations with aspect ratio of 1.25, the average performance enhancement is only about 20%, as labeled as current status in Figure For MEA corrugations with aspect ratio of 0.75, the projected power density is about the same as the planar MEAs. By reviewing the performance roadmap developed in Chapter 4, the power densities of the corrugated MEAs were expected to gain 72% for aspect ratio of 0.75 and to gain 120% for aspect ratio of In order to further enhance the performance of the corrugated MEAs using the folding process, the root causes of the performance degradation during the forming processes need to be identified. After the performance losses due to the forming processes are quantified, the performance roadmap would be able to provide more accurate performance prediction information to future designers. 8.5 Planar 7.5 2D rectangular Power Density (mw/cm 3 ) Project Target 2D_triangular Planar_50% improvement planar_100% improvement 3D square tile 1.5 Current Status Aspect Ratio Figure 6.19: The projection of current performance status on the performance roadmap of corrugated MEAs. 98
114 6.5 Summary Different methods for corrugating MEAs have been investigated. Pressing and folding processes have been experimentally studied. However, the results of the visual observation and fuel cell performance test showed that 3D corrugations cannot be patterned on MEAs using either of the fabrication processes. Therefore, the direction of investigation is focused on forming MEAs with 2D rectangular corrugations. The experimental results show the overall power outputs of the corrugated MEAs have reduced but the reactive area enhancement increases the projected volumetric power densities by 20% in average. However, some empirical data also showed that the performance can even be improved up to 45% for the high quality planar MEAs. Therefore, the root causes of the mechanical deformations and performance loss during the forming processes are identified in Chapter 7 and Chapter 8, respectively. Then, the performance loss caused by the forming process is also quantified and incorporated into the performance roadmap in Chapter 8. 99
115 CHAPTER 7 MANUFACTURING PROCESS SIMULATIONS This chapter presents the procedures and results for the finite element analyses (FEA) of the forming processes. First, the applications of FEA in other metal and plastic forming processes are reported. Second, assumptions and preprocessing steps of the pressing and folding process simulations are described. Finally, the results from FEA, including the strain responses and high stress locations are discussed. In recent years, the finite element method (FEM) has been widely applied to model different forming processes, such as sheet metal stamping, deep-drawing, and injection molding [77]. FEM is a good design tool that has the ability to perform simulation analysis at a low cost and reduce development time compared with conventional, iterative experimental methods. It also has the capability to perform parametric analysis for design and optimization. FEM is a tool to relate physical phenomena to analytical models, which helps a designer to better understand and visualize the critical issues within the design. The diagnosis from FEM guides the designers to realize and correct the problems in early design stages. Many sheet metal forming models have been developed for automotive industries. The FEM-based sheet metal forming models can predict the microstructure and properties of formed parts from the computationally obtained distributions of stress, strain, and temperature; failure prediction of formed parts and dies; optimization of perform and blank geometries; practical design of metal forming dies; and optimization of metal forming process sequences for desired metal flow and product microstructure. In this chapter, similar simulation of pressing and folding processes as the metal forming 100

116 process is carried out using a commercial FEA package ABAQUS/CAE. However, the major differences between the metal forming process and the forming processes in this research are the material properties of the blank and the boundary conditions of the process, which are discussed in the pre-processing section. Before getting into the detail procedures of preprocessing, the terminologies of the common components used in forming processes need to be defined as labeled in Figure 7.1. The blank is the material that needs to be shaped or patterning during the forming process. For metal sheet forming process, the blank is usually a sheet of metal. Die is the bottom piece of the mold, which usually has open cavity geometries. Punch is the top piece of the mold, which usually has protrusion geometries. Sometimes a fixed blankholder is also used to hold down the blank during stamping. In this chapter, the blank is the planar MEA and the die and punch are CNC-machined aluminum molds as introduced in Chapter 6. Bending & Stretching Friction Displacement Blank Figure 7.1: The schematic diagram of sheet metal forming process. 101
117 7.1 Problem For 2D rectangular corrugations, the forming process consists of a blank, a die, and a punch. The components are placed from top to the bottom in the order of punch, blank, and die. The center of the punch nose is aligned with the center of the cavity of the die. The displacement of the punch pushes the blank into the cavity until the bottom surface of the blank makes contact with the die. For the pressing process, since all the corrugations are formed at the same time, only a limited amount of material located on top of each cavity is forced into the cavity. This phenomenon can be translated to the boundary conditions of the model as fixed boundaries as shown in Figure 7.2. On the other hand, there are two types of scenarios in folding process. During the forming of the first corrugation, materials are free to flow into the cavity from all directions. Therefore, the boundary conditions on the edges of the blank are free with no constraints as shown in Figure 7.3. The second scenario consists of the forming process beyond the first corrugation. Since the boundary shared by the first and second corrugations needed to be fixed to prevent materials from pulling into the second corrugation, it is a fixed-end and only one remaining end of the blank is free to move into the cavity. Thus, this process consists of one fixed- and one freeboundary condition as shown in Figure 7.4. The model results need to illustrate the critical locations on the punch and die that cause large deformations on the MEA. The distortions of the MEA need to be quantified. Parametric analyses are required to study the relationships between the geometric parameters of molds and the deformations on the MEAs. 102
118 Displacement Fixed end Fixed end Figure 7.2: The schematic diagram of the boundary conditions of the pressing process. Displacement Free end Free end Figure 7.3: The schematic diagram of the boundary conditions of the first corrugation of folding process. 103
119 Displacement Free end Fixed end Figure 7.4: The schematic diagram of the boundary conditions of the folding process after the first corrugation. 7.2 FEM Analysis Processes A FEM model consists of pre-processing, analysis procedure, and post-processing steps. In pre-processing, the component geometries, the material properties, element type, meshing density, boundary conditions of the initial step, and interfacial properties of the contact surfaces are required to be defined before the analysis starts. The initial step is the static step, all the components have no movement. The analysis procedure includes the boundary and loading conditions of Step 2. The downward movements of the punch and the displacement of the blank occur in Step 2. After the computations of the steps are finished, the stress and strain results can be retrieved from post-processing. 104
120 7.2.1 Pre-processing Before the preprocessing starts, there are a few assumptions that have been made throughout the processes. Since the geometry of the corrugation is a 2D rectangular shape with certain draft angle, a 2D model was created to model the geometry of the forming components. Die and punch are made of aluminum, which is much harder than MEA structure. The die and punch should exhibit no deformation, and the major focus of the model is the mechanical deformations on the MEAs. Therefore, die and punch are modeled as rigid bodies. The MEA is a laminated structure consisting of many layers, porous carbon cloth, catalyst layer, and Nafion membrane. Carbon cloth is woven from bundles of carbon fibers, which do not have homogeneous mechanical properties in all directions. It is also in a porous film structure with non-uniform cross-sectional geometry. Therefore, it is very difficult to obtain the mechanical properties of the carbon cloth from standard tensile tests. Since the material properties of carbon cloth are unavailable, only the Nafion membrane with an equivalent MEA thickness is modeled as the blank in the geometry model. This assumption allows the model to capture the type of deformation on the Nafion membrane in the middle of the MEA, the amount of shear strains are applied on the carbon cloth backing layers from the Nafion membrane, and the high stress/strain locations on the MEA. Since the actual material properties of carbon cloth are different from Nafion membrane, the simulation analysis can only provide qualitatively results to determine the general trends and high level understanding of the forming processes. In order to neglect the strains from the thermal effect, the material properties and simulation are modeled at room temperature. 105
121 7.2.2 Geometric Modeling and Assembly The geometries of the blank, punch, and die are created using the built-in geometric modeling tool in ABAQUS/CAE. After the geometries of the die and punch are drawn as 2D analytical rigid shell elements, reference points were placed on them. The reference points are the points where the boundary conditions and loads can be applied. The MEA was modeled as 2D shell elements. The parts were assembled together in the order of die, MEA, and then punch, from bottom to top. They are aligned on top of each other by centering all of them along the axis of the global coordinate system, and then the punch can move down toward the center of the cavity of the die. The dimensions and the assembly of the model are shown in Figure mm 4mm 1.5 mm Punch Radius 5mm 8mm 0.66mm 4mm Die Radius 3mm Figure 7.5: Schematic diagram of die and punch radius. 106
122 7.2.3 Material Properties The material properties of the components are required for the analysis. Since the stress-strain curve of Nafion is not available from the manufacturer, it was obtained by performing the tensile test on the Nafion film using MicroInstron tester (Instron Corp., Norwood, MA). Nafion 115 film was clamped between two clamps, which are attached to the tester. The bottom clamp is fixed to the test station, and the top clamp can move up vertically. The sample s width, length, and thickness were input into the control program for stress and strain analysis. The top clamp pulls one end upward at a preset speed of 10 mm/min. True stress and strain data were calculated while the tester was pulling on the film. Since sample heating was not available for the test, the data was taken at room temperature. The data was converted from true stress and strain to engineering stressstrain using Equations 7.1 and 7.2 and the curve is shown in Figure 7.6. σ = E ( 1+ ε E ) σ T (7.1) ln( 1+ ε E ) = ε T (7.2) where σ E is the engineering stress, σ T is the true stress, ε E is the engineering strain, and ε T is the true strain. The stress and strain curve of Nafion can provide the software information related to the behavior of Nafion during the plastic region of the deformation. For the elastic deformation region, Young s Modulus of Nafion is also required. However, the Young s Modulus, E, can be calculated based on the linear region of the stress-strain relationship. Based on Hooke s Law in Equation (7.3), 107
123 σ ε E = E E (7.3) At room temperature, Young s modulus was calculated to be 236 MPa based on the linear elastic region of Figure 7.6 and Poisson s ratio was assumed to be 0.3 for Nafion. 18 Eng. Stress vs. Eng. Strain stress (MPa) strain (%) Figure 7.6: The stress-strain curve of Nafion 115 at room temperature Element Type and Meshing Defining element types was not necessary for the punch and die, because they were modeled as rigid bodies. The MEA is meshed with the quadrilateral element type, CPS4I, using the structured technique. CPS4I is a 4-noded, bilinear, incompatible modes plane stress element. Since the 4-noded lower order element is used, it is better to use the incompatible mode element. Then the meshing density was controlled by the edge seeding process. The thickness of the MEA was divided into 10 elements and the width of the MEA is divided into 150 elements. Based on different iterations of simulations, it was found that large deformations are located near the bottom surface of the MEA. 108
124 Therefore, the mesh density is higher on the bottom surface of the MEA than the top surface Contact Interactions Since the forming process is categorized as a contact problem, therefore, the interactions between the surfaces needed to be defined in the initial state. There are two contact interactions within this problem; one is between surfaces of the die and MEA, and the other is between surfaces of the punch and MEA. After the contact surfaces have been selected, the interaction properties between them are defined. Since both interactions occur between Nafion and aluminum surfaces, the same interaction properties have been applied for both interactions. The interactions are tangential behavior with isotropic properties. The friction coefficients between the surfaces are defined to be 0.3 with finite sliding for sliding formulation [78] Boundary Conditions In initial step, the boundary condition of the die is fixed without any displacement and rotation in any directions. The punch cannot move horizontally along the x-axis and cannot rotate. It can only move vertically along the y-axis. For the pressing process, the MEA has both ends fixed to the die. For the first corrugation of the folding process, the MEA has two free ends. For the following corrugations of the folding process, the MEA has one free end and one fixed end Analysis Procedure Step 2 of the analysis is to move the punch down and push the MEA into the cavity of the die. Therefore, the loading condition is to displace the punch downward by 109
125 4mm in 10 seconds. Since the problem is considered to be a quasi-static transient problem, auto time step was applied to solve the problem. The time step starts with 0.05 and the step size is automatically increased between 1e-8 and 0.1. A dissipated energy fraction of was applied for stabilization of the simulation. 7.3 Results & Discussions Magnitude of plastic strain (PEMAG) is used to quantify the deformation on the MEA after the corrugation process. Under the load, the total strain on a specimen is equal to the sum of plastic strain and elastic strain. Plastic strain is the unrecoverable strain after removing the load from a specimen under a high strain. The theory and definition of plastic strain were discussed in second section of Chapter Plastic Strain Distribution of a Fixed-end Model In order to better understand the causes of failure from the pressing process, the process has been simulated using ABAQUS. Based on the fixed boundary conditions all around the boundaries of the corrugation, the plastic strain distribution on the MEA is plotted in Figure 7.7. It shows that the large plastic strain zones are located around the die radius and punch radius areas as represented in red and yellow. The parameters of geometry in this model are listed in Table 7.1. Based on the result from the output file, the maximum magnitude of plastic strain (PEMAG) on the MEA is about 72.35%, which is a large amount of elongation for Nafion. This also indicates that there is a large amount of thinning occurring within the Nafion membrane, and especially at the regions located inside the cavities. 110
126 Draft Angle 0.75mm Figure 7.7: PEMAG distribution of the fixed-end boundary conditions model. Table 7.1: The geometric parameters of fixed-end model. Die Radius (mm) 1 Punch Radius (mm) 0.75 Draft Angle (degree) 12.5 Maximum PEMAG (%) Plastic Strain Distribution of Free-end Model For the free-end model, the plastic strain distribution is shown in Figure 7.8. The plot shows that the highest strain regions are located near the punch radius areas. The plastic strain on the bottom surface of the MEA has larger plastic strain than the top surface. Since the material can flow into the cavity freely without any constraints, there is nearly no strain at the edges of the MEA. The geometric parameters used in this simulation model are listed in Table 7.2. The maximum PEMAG across the MEA is 111
127 found to be 22.71%. However, the maximum PEMAG can be further decreased if the geometric parameters of the molds are optimized for the smallest strain. Top surface Bottom surface Figure 7.8: PEMAG distribution of free-end boundary conditions model. Table 7.2: The geometric parameters of free-end model. Die Radius (mm) 1 Punch Radius (mm) 0.75 Draft Angle (degree) 12.5 Maximum PEMAG (%) Parametric Results of Free-fixed Ends Model Since free-fixed boundary conditions have occurred many times during the forming process, it is important to optimize the mold design based upon this scenario to lower the plastic strain occurring within the MEA. Based on the results from the fixedend and free-end scenarios, the die and punch radius are the critical locations where the maximum plastic strain occurs. Based on the theories behind the mechanics of materials, 112
128 the corners of the geometries with small radius are also the high stress concentration zones. The aspect ratio of the geometry is also studied to predict the plastic strain magnitude within the MEA as a function of aspect ratio of the geometry. Thus, the die radius, punch radius, and the aspect ratio of the geometry are studied in this section. The die radius and punch radius are defined as shown in Figure 7.5 and the aspect ratio of the geometry is defined to be the ratio of height to width of the corrugation Die Radius vs. Maximum Plastic Strain The relationship between the die radius and maximum plastic strain was studied based on the fixed-free end model with punch radius of 0.75mm and die depth of 4mm. The die radius varies between 0.25 and 1.75 as shown in Figure 7.9. The figure shows that the maximum plastic strain decreases from 45% to about 20% as the die radius is increased from 0.25 to 1.5, then the plastic strain increases again when the die radius is The plot shows that the optimum die radius is about 1.5 for the lowest PEMAG. 113
129 Max. Plastic Strain Magnitude vs. Die Radius (Punch Radius = 0.75) Max. PEMAG (%) Die radius (mm) Figure 7.9: The relationship between MEA maximum plastic strain magnitude and die radius was determined from ABAQUS models Punch Radius vs. Maximum Plastic Strain From Figure 7.9, the optimum die radius was found to be about 1.5mm. Therefore, die radius of 1.5mm and die depth of 4mm were used to study the relationship between the punch radius and MEA maximum plastic strain based on the same fixed-free end models. The punch radius varies between 0.25 and 0.9 with an increment of about 0.25 as shown in Figure The figure shows that the maximum plastic strain decreases from 40% to about 19% as the punch radius is increased from 0.25 to 0.9. The speed of dropping the maximum PEMAG slows down as the punch radius is approaching from 0.75 to 0.9 mm, which means that the punch radius is slowly reaching its optimum value for the lowest PEMAG. 114
130 Max. Plastic Strain Magnitude vs. Punch Radius (Die Radius=1.5) Max. PEMAG (%) Punch Radius (mm) Figure 7.10: The relationship between MEA maximum plastic strain magnitude and punch radius was determined from ABAQUS models Corrugation Aspect Ratio vs. Maximum Plastic Strain A performance roadmap for the corrugated MEA was discussed in Chapter 4. However, the roadmap did not include the deformations caused during the corrugation forming processes. In order to predict more accurate corrugated MEA performance by taking plastic strain into account, it is important to understand the relationship between the maximum plastic strains on MEAs and the aspect ratio of the corrugation. In this parametric analysis, the aspect ratio of rectangular corrugation varies from 0.67 to 1.08 as shown in Figure The plot shows that the maximum plastic strain increases linearly from 22.5 % to 23.4% between aspect ratio of 0.67 and 0.9. Then the increment of the plastic strain increases slowly towards 23.6% when aspect ratio is approaching
131 This plot shows that the magnitude of plastic strain becomes stabilized when the corrugation reaches higher aspect ratios. Max. Plastic Strain Magnitude vs. Aspect Ratio Max. PEMAG (%) Aspect Ratio Figure 7.11: The relationship between MEA maximum PEMAG and aspect ratio of the corrugation was determined from ABAQUS models Mold Geometry Optimization After the parametric analysis on the geometric parameters of the molds, the optimized parameters were applied towards another model for validation. Based on the previous analyses, the optimized geometric parameters of the molds are summarized in Table 7.3. The plastic strain distribution of the MEA is shown in Figure The figure shows that the high strain regions are still located near the die and punch radius areas. However, the magnitude of the maximum plastic strain is decreased to 17.22%, which is the lowest plastic strain magnitude compared to all of the former analyses. This means that by combining the optimum geometric parameters from different analyses, one can 116
132 actually optimize the mold geometries to obtain the lowest plastic strain for MEA corrugation forming. Table 7.3: The geometric parameters of optimized mold geometries model. Die Radius (mm) 1.4 Punch Radius (mm) 0.9 Aspect Ratio 0.67 Maximum PEMAG (%) Figure 7.12: Plastic strain magnitude (PEMAG) distribution of the optimized geometric parameters of the molds Physical Interpretation For the model of the fixed end pressing process, the maximum PEMAG is over 70% on Nafion as shown in Figure 7.6. If an equivalent amount of stress is applied to the MEA with carbon cloth, the carbon cloth would not be able to elongate that much before it fractured. This result explains why carbon cloth fractures during the pressing process discussed in Chapter 6. The locations of the high plastic strains on the Nafion membrane are near the outside radius of the punch radius. The locations of the torn carbon fibers on 117
133 the carbon cloth are also located near the same locations. Since the distance between the radii of the punches is small, the tip of the punch becomes the stress concentration zone. Therefore, the fractured carbon fibers are located around that high stress zone. For the first corrugation of the folding process, the maximum PEMAG in the freeend model was determined to be about 22.71%. After the first corrugation of the folding process, the maximum PEMAG in the free-fixed end model with the same geometric parameters became 23.05%, which was higher than the free-end model. This is not a surprise that the free-end scenario actually has slightly lower plastic strain than the freefixed end model. This was caused by the fixed end constraint on the MEA, which introduced more tensile stress on the MEA than the free end model. As shown in the strain distribution of the free-fixed end model, the strains are not symmetrically located around the punch radius. Because of the constraint of the fixed end, the strain is higher towards that side of the model as well. Based on the distribution of the plastic strains on the free end models, large plastic strain regions are located near the top and bottom surfaces of the punch radius. For the real MEA structure with carbon cloth as gas diffusion layers, the bottom carbon cloth could fracture before the top carbon cloth. Because carbon cloth is porous, it has lower mechanical strength than solid material. However, carbon fibers are brittle as ceramic materials, they can take on more compressive load than tensile load. During the bending process, there is higher tensile stress on the bottom surface than the top surface of the MEA. This relationship between the maximum plastic strain and aspect ratio of the corrugations shows that higher aspect ratio corrugations do not have significantly larger 118
134 plastic strains than the ones in lower aspect ratio corrugations. In other words, if the reactive area gain for higher aspect ratio corrugation is high and the performance penalty coming from the plastic strain is not significantly higher, the performance can be further enhanced for higher aspect ratio corrugations than the lower ones. The PEMAG values from the simulation results should be served as references only, since the model used material properties of Nafion membrane only and the material properties of carbon cloth backing layers were not included. And also, the forming processes were taking place at 120 o C, so thermal strains should also be included in the model. However, the PEMAG should be able to illustrate the trends of deformations on the MEAs, such as molds with larger die radii and larger punch radii introduced relatively smaller plastic strains within the MEAs, higher aspect ratio corrugations had larger plastic strains than lower aspect ratio corrugations. On the other hand, the punch and die radius values of the mold, which introduced the lowest plastic strain within the MEA, were believed to be the optimal punch and die geometry values. 7.4 Summary Finite element analysis was used to study the strain distributions across the MEA during the pressing and folding processes. The pressing process with all fixed boundaries causes large tensile stress and large plastic strain. The large strain areas are located near the punch radius and die radius. For the free-end scenario of the folding process, the large plastic strain areas are located near the punch radius areas. Parametric analyses have been performed on the geometric parameters of the molds. Based on the relationships between the geometric parameters and the maximum plastic strain magnitude, the parameters have been optimized and validated with another simulation model. The 119
135 correlation between the aspect ratio and maximum PEMAG indicates that higher aspect ratio corrugations have slightly increased plastic strains compared to the lower aspect ratio corrugations, which could further enhance the performance of the corrugated MEAs. The experimental results from Chapter 6 and the numerical results from this chapter are further discussed in Chapter 8 to better understand the correlation between the mechanical deformations and electrochemical performance drop of the fuel cell caused by the corrugating process. 120
136 CHAPTER 8 ROOT CAUSE ANALYSIS AND PERFORMANCE PREDICTION In order to investigate the root causes of performance drop after the forming process, a hypothesis was defined to relate the mechanical deformations with the working mechanisms of DMFCs. The hypothesis in this chapter is that the performance loss due to the forming process is caused by the alteration of the microstructure of the electrode, the increase in ohmic resistance of the electrodes, and the overpotential of methanol crossover from membrane thinning. In the first part of this chapter, some experimental results are incorporated with the numerical results from Chapter 7 to discuss and explain the experimental results from Chapter 5 and Chapter 6. Since the DMFC performance loss is hypothesized to be caused by the mechanical deformations from the forming process, the relationship between the mechanical deformations and performance drop needs to be established. The mechanical deformations are summarized from the numerical results of the finite element model of forming process. However, microstructure alterations can only be quantified using some electrochemical methods. Therefore, the properties of the mechanical deformations are interpreted into the alteration of electrode microstructures to explain the performance losses of the corrugated MEAs. In the second part of this chapter, the performance losses due to the forming processes have been quantified and implemented into the performance roadmap from Chapter 4. The modified roadmap represents more accurate predictions of the performance enhancement for that particular aspect ratio geometry using folding process. 121
137 8.1 Root-Cause Analysis of Performance Reduction Mechanical Deformations Based on the theories behind the mechanics of bending and stretching processes, the major mechanical deformations are caused by the plastic strains. The most damaging plastic strains on MEAs are the tensile strains. The tensile strains can tear the carbon cloth backing layer, which can increase the electronic resistance of the electrodes. Since the carbon cloth backing layers also serve as the current collectors of the MEA, torn carbon cloth can increase the ohmic loss of the MEA. On the other hand, the large tensile strains can also provide large shearing forces between the Nafion membrane and the carbon cloth electrodes. The shearing force can deteriorate the interfacial bonding between the Nafion membrane and carbon cloth electrodes. The interfaces are the locations of the catalyst layers. It is very important to have good connectivity between the electrically conductive backing layer and the ionic conductive membrane for each of the electrodes. The delaminations between the electrodes and the membrane can greatly increase the ionic and electronic resistances of the MEA. Finally, the large plastic strains on the Nafion membrane can greatly reduce the thickness of the membrane. The thickness reduction of the membrane can decrease the ionic resistance across the membrane, but it can also increase the rate of methanol crossover. In Chapter 7, the magnitude of plastic strain (PEMAG) was used to quantify and compare the deformations of different forming processes and different process parameters. Two sets of molds with geometry aspect ratios of 0.75 and 1.25 were used for experimental work of this thesis. The simulation results of the models with the same design parameters as the experimental molds are summarized in Table
138 Corrugation Aspect Ratio Table 8.1: Maximum PEMAG within the MEA Max. PEMAG (%) Impedance Measurement In order to validate the hypothesis, the types of deformations within the structures of the MEA needed to be identified. The locations of the deformations can occur at the carbon cloth backing layers, the interfaces between the electrodes and the Nafion membrane, and the Nafion membrane. To quantify the performance and material property degradation within each of the region, electrochemical impedance spectroscopy was used to measure the overall resistances of the operating MEAs before and after the corrugation processes. Fuel cells are electrochemical systems, which consist of a frequency-independent part and a frequency-dependent part. Ohmic resistance is frequency-independent part, which does not change with the operation conditions of the fuel cell. Polarization resistance is the frequency-dependent part, which varies with the operating voltage and current flow of the fuel cell. Impedance measurement is a good electrochemical method to quantify ohmic and polarization resistances of fuel cells. The impedance measurements were performed on MEAs 27, 28, and 29, using HF frequency response analyzer, Solartron 1255 (Solartron Analytical, Berkshire, UK). The theory behind electrochemical impedance spectroscopy is discussed in the reference [79]. An impedance curve is comprised of the ohmic resistance, R o, and the polarization resistance, R pol, as labeled in Figure 8.1. The total impedance of the system is equal to the sum of R o and R pol, as shown in Equation
139 R = R o + R pol (8.1) Since R o represents the ohmic resistance of the cell, it is also called the bulk resistance of the cell. The bulk resistance of the cell includes the ohmic resistance of the electrolyte, the resistance of the electrodes, and resistances of wiring and contacts. The bulk resistance is the inherent resistance of the MEA, so it doesn t change with the operation condition of the cell as shown in Figure 8.2. When the cell is operating at different voltages, the bulk resistances remain the same but the polarization resistances change. At different operating voltages, the resistances within the cell change as well. Impedances of the MEAs presented in this chapter were measured by applying a DC potential of 0.45, 0.3, or 0.1V with AC perturbation amplitude of 40mV. Frequency was swept from 100k Hz to low frequencies such as 0.01Hz or Hz with 10 steps per logarithmic decade. The reference electrode was shorted with a counter-electrode and connected to the cathode and the working electrode was connected to the anode of the MEA Ohmic Resistance Since the bulk resistance represents the ohmic resistance within the cell, it is important to determine the ohmic resistance changes before and after the corrugation process in order to quantify the performance loss due to the ohmic resistance of the cell. Based on the impedance measurements in Figures 8.3, 8.4, and 8.5, the ohmic resistances of the MEAs before and after the corrugation process are summarized in Table
140 Impedance Measurement of Planar MEA Im(Z) (Ohm) V R R pol Re(Z) (Ohm) R o Figure 8.1: Impedance plot for Planar MEA 27 operating at 0.5V. Impedance Measurement of Planar MEA Im(Z) (Ohm) Measured at 0.01 Hz 0.3V 0.4V 0.5V 0.45V 0.1V Re(Z) (Ohm) Figure 8.2: Impedance plot for Planar MEA 27 operating from 0.1V to 0.5V. 125
141 Table 8.2: Ohmic resistances of planar and 2D corrugated MEAs. Bulk Resistance, R o, (Ω) MEA Planar 2D Increment % The results show that MEA 28 has a larger increment than the other two MEAs; this is because MEA28 even has a visual crack shown on one of its electrode surfaces after the forming process. This means that the fracture on carbon cloth increased the ohmic resistance of the MEA. The ohmic resistance of the planar MEA 29 is much higher than MEA 27 and MEA 28, because the electrodes of MEA 29 were assembled with Nafion 117 (thickness = 178µm). Nafion 115 (thickness = 125µm) membranes were used for other MEAs in this thesis. This shows that the ohmic resistance increases with the thickness of the electrolyte membrane as well Polarization Resistance Two half circle loops overlapped in the impedance plot shown in Figure 8.3. The first loop is based on the measurements at higher frequency, ω>1hz, and the second loop is based on the measurements at lower frequency, ω<1hz. According to the fuel cell handbook, kinetic control is found in the high frequency region, while mass-transfer control is found in the low frequency region. Since the reaction on the anode is relatively faster than the reaction on the cathode, the first loop represents the interfacial resistance of the anode and the second loop represents the interfacial resistance of the cathode [80]. If the semi-circle loops are uniform, the radii of the loops can be used to compare the polarization resistances of each electrode before and after the forming processes. Figures 8.3, 8.4, and 8.5 show the impedance plot comparisons of the MEAs before and 126
142 after the corrugation process. The collected impedance measurement data of MEA 27 are included in Appendix B. Because of the complex electrochemical mechanisms of DMFCs, the loops are also distorted. The figures show that most of the 2 nd loops for the corrugated MEAs are larger than the planar ones. This also means that the deformations caused by the forming process have also affected the polarization resistances of the cathodes. Comparing the radius change of the first loops, the size of the first loop is barely changed; i.e., the change is insignificant. This means that the deformations on the MEA do not cause too much influence on the performance of the anode. However, the radii of the second loops are much larger than the radii of the first loops. This shows that the cathode resistances are large. This problem becomes more significant when cells are operating near the open-circuit voltages, such as at 0.45V. -6 Impedance Measurement of MEA 27 Im(Z) (Ohm) st Loop 2 nd Loop 0.3V 0.45V 0.1V 2d_ 0.1V 2d_0.3V 2d_0.45V Re(Z) (Ohm) Figure 8.3: Impedance plots of MEA 27 (planar and 2d) operating at 0.1, 0.3, and 0.45V. 127
143 -7 Impedance Measurement of MEA 28 Im(Z) (Ohm) V 0.3V 0.45V 0.1V_2d 0.3V_2d 0.45V_2d Re(Z) (Ohm) Figure 8.4: Impedance plots of MEA 28 (planar and 2d) operating at 0.1, 0.3, and 0.45V Impedance Measurement of MEA 29 Im(Z) (Ohm) V 0.3V 0.45V 0.1V_2D 0.3V_2D 0.45V_2D Re(Z) (Ohm) Figure 8.5: Impedance plots of MEA 29 (planar and 2d) operating at 0.1, 0.3, and 0.45V. 128
144 The polarization resistances are different for different operating voltages. The polarization resistances of planar and 2D MEAs are summarized in Table 8.3. The percentages of resistance increment are also listed in the table to compare the resistance increment at each of the operating regions. The polarization resistances of most of the corrugated MEAs have increased by over 50% compared to the R pol of the planar MEAs. The polarization resistances increase as the operating voltage increases. Comparing the increment of polarization resistances to ohmic resistances, ohmic resistances have only increased by 10% to 35%. This indicates that the deformations from the forming process make more impacts on the polarization than on the ohmic regions of the cell. These impacts may come from the microstructure alterations at the electrode-membrane interfaces due to the shear strain mismatch between the carbon cloth backing layer and Nafion membrane. The large elongation of the Nafion membrane can also greatly reduce the thickness of the Nafion and induce higher methanol crossover rate. Then, the overpotential of the cathodes increases due to the high mass transport resistances of air supply to the cathode for oxygen reduction. The resistance of mass transport of air on the cathode becomes higher because oxygen consumption competes with the crossover methanol oxidation and oxygen reduction processes on the cathodes. Therefore, the polarization resistances of operating cells at 0.45V are much higher than the ones from other operating voltages, 0.3V and 0.1V. 129
145 Table 8.3: Polarization resistances of planar and 2D corrugated MEAs at different operating voltages. Polarization Resistance, R pol, (Ω) MEA 27 MEA 28 MEA 29 V Planar 2d Increment % Planar 2d Increment % Planar 2d Increment % Since some of the loops almost entirely overlap each other, it is quite difficult to compare their magnitudes. Therefore, the system resistances are used for performance loss comparisons, as discussed in the next section Performance Reduction vs. System Resistance Increment In order to quantify the performance loss from the forming process, it is important to relate the system resistance (R) with the performance of the MEA which, in this case, is the current flow. For each operating voltage, the operating voltage is related to the current flow by Ohm s Law V = i p R p (8.2) V = i c R c (8.3) where subscripts p and c stands for planar MEA and corrugated MEA, respectively. For constant voltage measurement, operating voltage is the same for both cases and the performances of the MEAs can be related as follows V = i R = i R (8.4) p p c c By dividing R p on both sides of the equation, the current flow of the planar MEA is related to the corrugated MEA current flow by a factor of R c /R p, as shown in Equation
146 R c i p = i (8.5) c R p Based on the results of impedance measurements of MEAs 27, 28, and 29, R c /R p values have been calculated for each operating voltage as listed in Table 8.4. The calculated results show that the system resistances of the corrugated MEAs are always higher than the planar MEAs, which means that the forming process has altered the microstructures within the MEAs to cause increases in system resistance. Table 8.4: System resistances of planar and 2D corrugated MEAs at different operating voltages. System Resistance, R (Ω) MEA 27 MEA 28 MEA 29 V Planar 2d Rc/Rp Planar 2d Rc/Rp Planar 2d Rc/Rp In Table 8.4, the system resistances of corrugated MEAs increase the most at the highest operating voltage, 0.45V. Since the cell operation at 0.45V is in the activation limited region, the performance of the cell is highly dominated by the kinetics of the reactions. The kinetics of the reaction is also controlled by the microstructures of the catalyst layers of the electrodes. This indicated that the microstructures of the electrodes have been altered during the forming process. The performances of the MEAs at 0.3V and 0.1V are dominated by the ohmic loss and mass transport loss, respectively. Thus, the performance loss due to the microstructure alteration is not that significant Four-Point Probe Measurement In order to determine the contribution of bulk resistance of the MEA from the electrodes, the resistivities of the electrodes were measured by the four-point probe 131


147 measurement technique. Since the electrodes are assembled with Nafion membranes and are in arbitrary shapes, it is necessary to measure the resistivities and sheet resistances of the electrodes before and after the corrugation process. The four-point probe technique is the most common method for measuring semiconductor resistivity, as shown in Figure 8.6. Although the two-point probe methods are easier to implement, the interpretation of the measured data is more difficult. For the two-point probe arrangement, the measured resistance is the sum of the probe resistance, R p, the contact resistance, R c, the spreading resistance, R sp, and the sample resistance, R s. In the four-point probe, the parasitic resistances R c, R p, and R sp can be neglected. This is because only very small currents flow through the probes, and the voltage drops across them are also negligibly small. Figure 8.6: The schematic diagram of 4-point probe [81]. The collinear probe configuration is the most common 4-point probe arrangemen; however, arranging the points in a square or arbitrary shape is also possible and the resistivity is given by [82] ( R 12,34 + R 23, 41 ) F πt ρ = (8.6) ln( 2 ) 2 132
148 The resistance R 12,34 is defined as V 34 R 12,34 = (8.7) I12 where t is the thickness of the sample, the current I 12 enters the sample through contact 1 and leaves through contact 2 and V 34 = V 3 V 4 is the voltage difference between contacts 3 and 4; R 23,41 is defined similarly. F is a function only of the ratio R r = R 12,34 / R 23, 41, satisfying the relation Sheet resistance, R s, can be calculated as Rr 1 F exp[ln(2) / F] = arccos h (8.8) R + 1 ln(2) 2 r R s ρ = (8.9) t In order to determine the ohmic loss across the electrode areas, the 4-point probe method is used to measure the sheet resistances of the anode and cathode before and after the corrugation process. The four probes are located at 3 corners of the electrode and the fourth one is pointed on top of the current lead to include the non-uniform geometry of the electrode into the measurement. A constant voltage power supply is used to generate current that flows from one probe into the electrode, and then back to another probe. The current is calculated from the Ohm s law using the known value of the dummy resistor and the voltage reading across the dummy resistor. The electrical circuitry for the setup is shown in Figure 8.7. The voltage readings are taken for each voltage source input. The voltage source was increased from 0.5 to 5V with an increment of 0.5V. By taking the voltage readings 133

149 for different voltage source inputs, the measurements eventually converge to a consistent value. Vs Resistor (500Ohm) Figure 8.7: The electrical circuitry of 4-point probe setup. Based on the equations above, the sheet resistances are calculated by taking the arbitrary geometry factor F into account. In this case, F is calculated to be Figure 8.8 shows the sheet resistance of the anode is increased from 2.45Ω to 3.2Ω as a result of corrugating MEA 27. Figure 8.9 show that the sheet resistance of the cathode is increased from 1.6Ω to 1.9Ω. It shows that the sheet resistance of the cathode is lower than the anode s. It is reasonable because the cathode has higher platinum loading than on the anode. Pt/Ru particles were supported by highly conductive carbon particles, so the cathode is more electrically conductive. The resistivity of the plain carbon cloth listed in Appendix A was 0.41 Ω.cm and the resistivities of MEA 27 anode and cathode were measured to be and Ω.cm, respectively. Therefore, the resistivity of the carbon cloth was greatly lowered by the coating of catalyst ink. On the other hand, the molding process is not symmetrical. The anode was the side facing the bottom of the die. 134
150 More surfaces on the anode were deformed by larger tensile stresses than on the cathode side. This forming orientation should also make an impact on the sheet resistance. MEA 27 Anode Sheet Resistance (Ohm) Source Voltage (V) Planar 2D Figure 8.8: Sheet resistance comparison of the anode before and after the corrugation process. 2.5 MEA 27 Cathode Sheet Resistance (Ohm) Planar 2D Source Voltage (V) Figure 8.9: Sheet resistance comparison of the cathode before and after the corrugation process. 135
151 8.1.4 Nafion Membrane Thinning In order to validate if there is any Nafion membrane thinning due to the forming process, the thickness of Nafion membranes needed to be quantified before and after the forming process. A limited number of non-destructive methods can be used to measure the thinning of Nafion membranes after the MEAs have been formed with corrugations. Access to those instruments is limited, so membrane thinning is evaluated based on the performance degradations inclusive of the increased methanol crossover phenomenon. Basically, performances of the MEAs are tested using the standard testing setup and passive operating conditions. In order to see the methanol crossover effects, methanol of various concentrations has been used to test the performance of the MEAs. Figures 8.10 and 8.11 are the polarization curve comparisons of MEAs before and after the forming process at different fuel concentrations. In this study, 0.5, 1, and 2M methanol mixtures were used to study the methanol crossover effects on planar and 2D corrugated MEAs. 136
152 Performance vs. Concentration (MEA 27) Voltage (V) M 1M 2M 0.5M_2d 1M_2D 2M_2D Projected Current Density (ma/cm 2 ) Figure 8.10: Concentration effects on the performance of MEA 27 before and after the corrugation forming process. Performance vs. Concentration (MEA 28) Voltage (V) M_Planar 2M_Planar 0.5M_2D 2M_2D Projected Current Density (ma/cm 2 ) Figure 8.11: Concentration effects on the performance of MEA 28 before and after the corrugation forming process. 137
153 For the planar MEA 27, the open circuit voltages (OCVs) of 0.5M and 2M were 0.68V and 0.63V, respectively. Figures 8.10 and 8.11 showed that MEA OCVs at lower fuel concentration are always higher than at higher fuel concentration. This is because the overpotential on the cathode due to the methanol crossover is limited at low fuel concentration, so the cell voltage at open circuit condition is relatively higher. At low operating voltage ranges, the mass transport or concentration loss overpotential is high, therefore, the performance of the cell with low concentration fuel decreases rapidly. Since the limiting current is reached for that specific fuel concentration and supply rate, the performance cannot be further enhanced. In Figures 8.10 and 8.11, all of the open circuit voltages of the corrugated MEAs are reduced for different fuel concentrations. This may indicate that the overpotential caused by the methanol crossover is increased for the corrugated MEAs. Because of the nature of the forming process as discussed in Chapter 7, the Nafion thinning across the MEA is not uniform and the actual thinning amount is also very difficult to determine. However, the numerical simulations and the MEA performance comparisons with different fuel concentrations indicated the significant affects of methanol crossover on performance reduction at low current density. On the other hand, the membrane thinning effect would also be beneficial to the performance of the cell operating at high current density. The thinning of Nafion membrane indicates that the ohmic resistance across the electrolyte is also lower and protons can be transported across the membrane easier. Therefore, it is important to be able to quantify the amount of membrane thinning due to the forming process. 138
154 Assuming the sole reason for OCV drop was from membrane thinning, Nafion membrane thinning could be estimated using OCV measurements. Thus, the relationship between the membrane thickness and OCV drop needs to be established. Figure 8.12 is the published OCV and polarization results of MEAs with different thickness Nafion membranes operated at 2M methanol. The OCV measurements of MEAs with different Nafion thicknesses are summarized in Table 8.5. Figure 8.12: Polarization and power density curves of the passive DMFCs with various membranes operated with 2.0M methanol [83]. Table 8.5: Nafion thickness and OCVs. Nafion t(cm) OCV (V) The relationship between the thickness difference (Nafion 112 and 115 versus Nafion 117) and OCV drop was established using the information from Table
155 Assuming the relationship between the thickness difference and OCV drop is linear. Then the thickness difference and OCV drop were calculated and plotted in Figure y = 3.937x OCV Drop (V) dv Linear (dv) Thickness Difference (cm) Figure 8.13: OCV drop versus Nafion thickness difference relative to Nafion 117. The linear relationship is determined to be OCV drop =3.937 x (thickness difference) The OCV values of planar and corrugated MEA 27 in Figure 8.10 were and V, respectively. The OCV drop was 0.040V, so the membrane was cm less than Nafion 117. The membrane thickness was calculated to be cm. Comparing to the original thickness of Nafion 115, the membrane was 26 percent thinner after corrugation. Since the ionic conductivity of Nafion membrane is 0.1 S/cm, the resistance of the thin Nafion membrane has been reduced by Ω. 140
156 8.2 Sources of Bulk Resistance Bulk / ohmic resistance difference (ΔR bulk ) between planar and corrugated MEAs were measured with an impedance analyzer and divided into ohmic resistances of different components and regions: ΔR Bulk = ΔR membrane + ΔR anode _ + ΔR cathode _ + ΔR anode _// + ΔR cathode _// ΔR membrane is the ohmic resistance drop from membrane thinning; ΔR anode_ and ΔR cathode_ are the resistance differences across the thicknesses of the anode and cathode, respectively; and ΔR anode_// and ΔR cathode_// are the sheet resistance differences across the electrode surfaces and to the current leads of the anode and cathode, respectively. Using the resistivities of the MEA 27 anode and cathode calculated from the results of 4-point probe measurements for ΔR anode_ and ΔR cathode_, and membrane resistance drop of Ω, the sum of ΔR anode_// and ΔR cathode_// was calculated to be 0.253Ω using the following equations R = ρ t wl R // = ρ w lt = ρ t Ω = Ω + E Ω + E Ω + ΔR anode + ΔR _// cathode _// ΔR + ΔR = Ω anode _// cathode _// where ρ is the resistivity measured with 4-point probes, t is the thickness of the electrode, w is the width of the electrode, l is the length of the electrode. This is higher than the bulk resistance drop measured from the impedance measurement. This also indicated that the major source of bulk resistance of the MEA 141
157 came from the insufficient current collection through the single current lead instead of the membrane thinning and resistance across the thickness of the electrodes. For MEA 27, the impedance measurement shows that the bulk resistances of the MEA before and after the forming process are only 2.35Ω and 2.59Ω, respectively. However, the measurements from this section indicated that the sum of sheet resistances of both electrodes was 1.24Ω, which was higher than the estimated value of 0.253Ω. This sheet resistance difference might be caused by the inaccuracy during the 4-point probe testing. Since the thickness of the electrode is difficult to be measured, error from the thickness of the electrode might be introduced. During the test, the tips of the probes are very sharp, which can penetrate into the catalyst layer instead of touching the surface of the carbon cloth. Overall, the test results are consistent with the bulk resistance from the impedance measurement, indicating that the sheet resistances of both electrodes increased after the corrugation process. The experimental results and analyses of the impedance measurement, four-point probe measurement, and membrane thickness estimation validated that the sources of performance loss were caused by the alteration of the catalyst layers, deformed carbon cloth supported electrodes, and methanol crossover overpotential due to the membrane thinning. 8.3 Performance Prediction Performance Reduction vs. Area Enhancement In Chapter 6, the experimental results have shown that some MEA performance reductions are due to the corrugation forming processes. It is also found that if the 142
158 projected area reduction is large, the projected volumetric power density of the fuel cell can also be improved. An analytical model is developed to relate the performance loss (due to the forming process) to the projected area of the corrugated MEA. The derivation of the model is shown below: I V = (8.10) p P p I p is the current output of the planar MEA, V is the voltage, and P p is the power output of the planar MEA. A similar equation can be applied to the corrugated MEA as shown in Equation 8.11 I V = (8.11) c P c where I c and P c is the current output and power output of the corrugated MEA, and V is the voltage. By assuming x % is the performance reduction due to the forming process, then ( 1 x ) P p = P c (8.12) For the corrugated MEA to have power density y % more than the planar MEA, then P p c ( 1+ y ) = (8.13) A where A p is the area of the planar MEA and A c is the projected area of the corrugated MEA. By substituting Equation 8.12 into Equation 8.13, p P A c (1 P p p + y) = (8.14) A p (1 x) P A c Finally, the relationship between the performance reduction and performance goal is determined in Equation (1 x) Ap Ac = (8.15) (1 + y) 143
159 Equation 8.15 is not dependent on any fuel cell operational parameters, such as current, voltage, or power. It is only dependent on the design requirements and geometric parameters, which can serve as a handy design tool. Based on the performance expectation and the performance drop percentage data from experiments, the project area of the corrugated MEA can be calculated. The calculated area would become the threshold size of the forming process. Therefore, it is necessary to verify the targeted corrugated MEA size is within the limitation of the forming process Experimental Results The percentages of performance losses of corrugated MEAs are summarized in Tables 8.6 and 8.7 for corrugation aspect ratios of 0.75 and The average percent of performance reduction is also calculated. It shows that higher aspect ratio corrugations cause larger performance losses than the lower aspect ratio corrugations. Table 8.6: Summary of performance loss due to 2D corrugation of rectangular geometry with aspect ratio of D Corrugations Aspect Ratio = 0.75 MEA Power Loss % Average %
160 Table 8.7: Summary of performance loss due to 2D corrugation of rectangular geometry with aspect ratio of D Corrugations Aspect Ratio = 1.25 MEA Power Loss % Average % Modified Performance Roadmap The performance roadmap for the triangular corrugation curve was modified utilizing the experimental results, as shown in Figure The new performance curve was predicted by substituting the average performance loss percent of corrugated MEAs with aspect ratios of 0.75 and 1.25 into Equation Then, the expected area enhancement, y, can be determined. In this case, x is 26.62% and y is -2.16% for corrugations with aspect ratios of For corrugations with aspect ratio of 1.25, x is 38.17% and y is 23.66%. The negative value of y indicates that the power density of the corrugated MEA is lower than the power density of the planar MEA. When the volumetric power density of the planar MEA is assumed to be mw/cm 3, as shown in Figure 8.14, the expected power density of the corrugated MEA can be calculated by substituting x and y values back into Equation For corrugations with aspect ratios of 0.75 and 1.25, the expected volumetric power densities are calculated to be and mw/cm 3, respectively. In Figure 8.14, the curve labeled with 2D triangular (predicted) was the same curve from the original performance roadmap shown in Chapter 4. 2D triangular (modified) curve represents the new performance prediction which includes the 145
161 information from the manufacturing processes. It shows that the expected performances of the corrugated MEAs with aspect ratios 0.75 and 1.25 are below the lines of 50% and 100% improvement. For corrugated MEA with aspect ratio of 0.75, its expected performance is even lower than the planar MEA. Performance Roadmap (Modified) Power Density (mw/cm 3 ) Aspect Ratio Planar 2D Triangular (Predicted) Planar_50% improvement planar_100% improvement 2D Triangular(Modified) Figure 8.14: Modified performance roadmap for 2D rectangular corrugated MEAs. 8.5 Summary The major causes of the performance reduction are from the alterations of the microstructures of the electrodes and overpotential of methanol crossover due to Nafion membrane thinning. The major sources of bulk resistance of the MEA came from the inplane resistances of the electrodes. The microstructure changes affect the kinetic and mass transport properties of the electrodes. Therefore, the polarization resistance is the major source of system resistance increase, which eventually lowers the performance of 146
162 the cell. Both of the causes resulted from the large tensile strains during the corrugation forming process as illustrated in the numerical simulations of Chapter 7. However, the results from Chapter 7 also indicated that the parameters of the manufacturing processes can be optimized to lower the magnitudes of plastic strains. Although it is impossible to eliminate all of the plastic strains within the MEA during the corrugating process, the modified performance roadmap can still provide a good prediction for power density enhancement. Since the modified performance roadmap has already incorporated the experimentally determined performance loss due to the forming process, it can provide a good design guideline for a fuel cell designer to select the proper geometry and aspect ratio of the corrugated MEAs. The modified performance roadmap predicted that higher volumetric power densities can be obtained with higher aspect ratio geometries. The FEA model showed that the magnitudes of the plastic strains are reaching their maximum values after an aspect ratio of the corrugation is higher than 1.1. This means that the performance drop due to the mechanical deformation should also start to reach its maximum values as well. For higher aspect ratio corrugation, a large reduction of the projected area can greatly reduce the volume of the cell and ultimately increase the volumetric power densities. However, MEA corrugation is not a good approach for volumetric power density enhancement if the rectangular corrugations have aspect ratio lower than 1. The reduction in volume still cannot compensate for the large performance loss due to the forming process. Therefore, it is not worth pursuing this approach to improve the volumetric power density of the MEA with low profile corrugations. 147
163 CHAPTER 9 STACKING CONFIGURATION DESIGN After investigating the manufacturing process and the performance of a single cell with corrugated geometries, different stacking configurations of the corrugated geometries are presented in this chapter. In order to supply power to portable electronics, the voltage requirement is higher than what a single cell can provide. Therefore, the cells need to be connected in series in order to increase the output voltage. When multiple cells are connected in series, many system integration problems need to be resolved. Since fuel cell stack integration is not the major research task of this thesis, only the system integration related technical questions are discussed in this chapter. 9.1 Requirements for Passive Fuel Cell Stacks Configurations Passive direct methanol fuel cell stacks require zero power to supply fuel to the anodes and zero power for oxygen supply to the anode. No power is applied to heat the fuel to jump start the electrochemical reactions of the DMFC. CO 2 gas is generated during the anodic reaction, so carbon dioxide gas must be exhausted outside of the fuel chamber to maintain the power generation process without gas bubbles blocking the reaction sites. Since the reaction on the cathode is slower than the reaction on the anode, a sufficient amount of air circulation is required to continue the power generation process. 9.2 Corrugated Stacking Configurations The same figure of merit, A/V, defined in Chapter 4, is used to compare the power density of different cell stack designs. Since the major goal of this research is to improve the volumetric power density of passive DMFCs, the stack designs are targeted 148
164 for DMFCs operating under passive conditions. Instead of using graphite bipolar plate as flow channels, the reactants are supplied to the electrodes through natural convection and wire meshes are used to provide mechanical supports as well as current collectors. In order to allow CO 2 gas bubbles to be removed from the reactive areas by buoyancy force, the MEAs are placed vertically. Instead of connecting the fuel channels in series, channels are connected in parallel, so the fuel can be refilled from the fuel reservoir located at the bottom of the cell stack. Alternative integrated system is also discussed in the second section of this chapter Planar MEA Stack Figure 9.1 illustrates the configuration of the planar MEA stack. Planar MEAs are mounted vertically with even spacing between them. The MEAs with electrodes facing the outside of the cell stacks must be cathodes to take advantages of the airbreathing condition. Then, the anodes of the MEAs are facing toward the enclosed cavities filled with methanol. Each methanol cavity is shared by anodes of two MEAs to save space. Finally, the middle cavity is open to air to maintain the air-breathing condition of the cathodes. Spacing for Methanol Spacing for Air Wire Mesh MEA Figure 9.1: The top view of the planar MEA stack. 149
165 A/V of the planar MEA is calculated using Equations (9.1) and (9.2), and Table 9.1. A = Nwl (9.1) ( l + 2c)( w + 2c)( 2Nm + Nd + ( N 1 s) V = ) (9.2) Each MEA is 5 x 5 cm 2. The length of the stack is equal to l+2c, which is the sum of the length of a MEA and the width of two clamping ends. The same formulation is applied to calculate the height of the stack. Finally, the width of the cell stack is the sum of all thicknesses of MEAs, wire meshes, and spacing as shown in Figure 9.1. Table 9.1: Parameters used for A/V calculation. Symbol # of MEA N 4 # of spacing N-1 3 Spacing (mm) s 5 MEA width(mm) w 50 MEA length(mm) l 50 Each MEA area(mm2) a 2500 MEA thickness(mm) d Wire mesh thickness (mm) m 1 clamping width(mm) c Corrugated MEA Stack Figure 9.2 illustrates the configuration of the triangular corrugated MEA stack. Similar to the planar MEA stack, the corrugated MEAs are mounted vertically with even spacing between them for fuel and air circulations. 150
166 t b θ Figure 9.2: The top view of corrugated MEA stack. Triangular corrugation is a function of corrugation angle (θ) and aspect ratio (AR). By assuming t=3mm, b+t=7mm, an aspect ratio, A/V, is determined based on the following equations. AR = ( b t) tanθ 2( b + t) (9.3) l = N b + ( N 1 t (9.4) c c ) ( b t) tanθ V = ( l + 2c)( w + 2c) 2Nm + Nd + ( N 1) s + (9.5) 2 where N c is number of corrugations Tubular MEA Stack Figure 9.3 illustrates the configuration of the cylindrical MEA stack. Similar to the planar MEA stack, the corrugated MEAs are mounted vertically with even spacing between them for fuel and air circulations. 151
167 R Figure 9.3: The top view of tubular MEA stack. As shown in Figure 9.3, the area of the MEA is not the same for each layer of the stack, the reactive area changes with the radius of the cylinder as well. Assume the radius of the cavity at the center of the cylinder is r 0. Starting from the center with MEA # = n, r d = rn 1 + m + + ( n 1 s (9.6) 2 n ) A = 2π (9.7) n lr n V 2 n n + = π r ( l 2c) (9.8) where r n is the radius, A n is the reactive area, and V n is the volume of the n th MEA D Square-Tile MEA Stack 3D square tile corrugated MEAs can be stacked one on top of the other linearly. However, many practical issues restrict 3D corrugated MEAs to be stacked linearly for achieving high packing density. The major concern of stacking 3D corrugated MEA is the CO 2 gas bubble removal problem. For passively operated DMFCs, the gas bubbles are removed from the MEA surfaces by the buoyancy force in liquid. Since buoyancy force is related to 152
168 gravitational force, the orientations of the MEA reactive areas are critical for gas bubble removal. Corrugated MEA with 3D geometries has reactive areas in all directions, so it can only be placed horizontally. In order to stack multiple 3D corrugated MEA together horizontally and be able to achieve high packing density, the spacing between them has to be small. Under the passive operational conditions without active fuel flow, CO 2 gas bubbles generated from the reactive area can block and restrict fuel flow within the spacing as shown in Figure 9.4. The CO 2 gas bubbles stop reactive areas from making contacts with methanol fuel. The actual available reactive areas can be greatly reduced. Methanol Wire mesh Air Air MEAs Methanol CO 2 gas bubbles Figure 9.4: Side view of horizontal stacking configuration of 3D square tile MEAs. Another concern of stacking 3D corrugated MEA is that fuel cannot be replenished to all regions of reactive areas. One advantage of stacking corrugated MEAs is that they can be nested one on top of the other to achieve high packing density. However, when 3D corrugated MEAs are nested, there is only limited spacing between them. Since the small gap between them is not a straight linear pathway for fuel to flow through, the flow rate can be greatly reduced and fuel may not reach every corner of the corrugations. 3D corrugated geometries consist of peaks and valleys, the reactants can flow across the peaks easily but it is almost impossible to reach the bottom of the valleys. Bottoms of the valleys are also the stagnation points for fluid flows or dead volume zone. 153
169 If those dead volumes cannot be replenished with reactants, those areas are not reactive areas. Because of all of these issues related to the operational conditions of passive DMFCs, stacking of 3D corrugated MEAs is not recommended as the approach for power density enhancement. Therefore, the analytical models for their stacking configurations were not investigated. 9.3 Results A/V vs. Aspect Ratio of Corrugations The power density gain by stacking corrugated MEAs is illustrated by comparing A/V of planar MEA stack to the A/V of corrugated MEA stack. A/Vs of triangular corrugated MEA stack and other stacking configurations were plotted on Figure 9.5 as a function of aspect ratio of the corrugations. The plot is based on stacking of 4 MEAs with a minimum reactive area of 125 cm 2. In the figure, A/Vs of the planar and tubular MEAs are independent of aspect ratio of corrugations. However, the triangularly corrugated MEA stack shows a steep slope for A/V as aspect ratio increases from 0.1 to 2. A/V of triangularly corrugated MEAs is much higher than the planar or even tubular MEA stacks. This shows the great potential to have power density enhancement. Since this curve is a theoretical curve without including the possible performance loss during the corrugation forming process, another curve is also projected on Figure 9.5. The new project curve is determined by deducting 50 percent of A/V from the theoretical curve to compensate the fact that about 50 percent of the performance may be 154
170 lost during the forming process. Comparing to the planar MEA stack, the new curve shows that there is no power density enhancement until the aspect ratio of the triangular corrugation is larger than 0.5. Therefore, the corrugated MEA approach can still be able to improve the volumetric power density of the stack of passive DMFCs A/V (cm2/cm3) Planar Triangular_no deformation Tubular Triangular_ 50% performance loss Corrugation Aspect Ratio Figure 9.5: A/V comparison plot of planar, tubular, and triangular MEA stacks A/V vs. Individual MEA As described before, tubular MEAs have different A/V ratios from layer to layer. In order to determine the relationship between A/V and the individual MEA cells, Figure 9.6 is plotted. MEA # 1 is the closest MEA from the center of the cylinder and MEA # 5 is the outermost cell from the center of the cylinder. A/Vs of individual MEAs of planar and corrugated MEA are also plotted in the figure for comparison even though they have the same reactive areas and are stacked linearly. For the tubular MEA stack, the first MEA shows a large A/V compared to the planar MEAs. Then, A/Vs of the MEAs 155
171 increase as the MEAs locations are further away from the center of the cylinder. However, the trend of the increment is quite slow. Although the reactive area of the tubular MEA increases as the radius of the cylinder increases, the volume of the cylinder increases even faster. Therefore, dimensions of the center space of the cylinder and the spacing between the MEAs are the critical parameters for geometry optimizations. On the other hand, A of the tubular stack is the sum of all reactive areas of MEA layers but the volume is the same as the largest radius of the cylinder; therefore, it can have 3 times larger A/V values compared to the planar MEA stack as shown in Figure 9.5. Therefore, tubular stack design can also improve the power density of the stack compared to the planar MEA stack. Since the sizes of the MEAs are different for each layer, the current density of each layer is also different as well. By connecting all the cells in series to increase the operating voltage, the cell stacks can be either underperformed or over-heated. If the inner cell was operating at its maximum, the current densities of the outer cells would be lower than the inner cell. Then the outer cells would be underperformed because they were not operating at their best performance. If the outer cell was operating at its peak current density, the inner cell would be overheated by the massive current flow. In order to maintain the high packing density of this stacking configuration, alternative wiring solutions are needed to solve this practical issue. One possible solution to this problem is to keep all of the MEAs to have the same reactive areas. The minimum MEA size is defined by the size of the inner cell. The outer cells must be the size of multiple inner cells, i.e. second cell is consisted of two MEAs and the MEAs are the same size as the inner cell. By connecting each of the MEAs in series, the voltage can be 156
172 increased but the current density across each MEA remains the same. In this way, the cell stacks can still maintain their good performances and still be able to achieve high packaging density A/V (cm2/cm3) MEA # Tubular stack Planar stack Triangular MEA(AR=0.5) Figure 9.6: A/V comparison plot of planar, tubular, and triangular MEA single cells. 9.4 Technical Issues of Corrugated System Integrations Structural Support The corrugated MEA needed to be structurally supported to maintain its corrugated geometries. Otherwise, the corrugated MEA can be distorted and the channels can be collapsed due to the swelling and shrinking of the Nafion membrane. Since the applications of the corrugated MEA stacks are in portable devices, it is important to keep the overall weight low by replacing the conventional graphite bipolar plates and current collectors with metallic wire meshes. The metallic wire meshes can be corrugated to 157
173 have the same geometries as the corrugated MEAs. The corrugated wire meshes have higher strength and stiffness than the corrugated MEAs. They can provide mechanical support to maintain the structure integrity of the MEA. The corrugated MEA can be sandwiched between the corrugated wire meshes, which still allow the reactants to make contact with the electrodes as well as provide electrical pathway for current collection from the electrodes. The main concern of the wire meshes support is the corrosion resistance of the wire meshes towards acidic media from the hydrated Nafion membrane. Wire mesh current collectors are placed close to the acidic medium with current flow, which are the perfect conditions for electrochemical corrosion of metallic materials. In order to prevent wire mesh corrosion, the wire meshes can be electroplated with thin layers of gold. Gold is a highly inert material towards chemicals, and it also has good electrical conductivity for electrical connections. Since the amount of gold coated on the wire meshes is low and the current collectors can be recycled from the old DMFCs, the extra cost associate with the gold coated current collectors is relatively low. For stacking configurations, the fuel reservoir is located between two corrugated MEAs. Under passive operating conditions, fuel is not actively supply to the MEAs. In order to supply fuel uniformly to both of the MEAs by natural convection, it is important to keep even distances between the MEAs. The even spacing between the MEAs can maintain the same fuel concentration across the reactive areas, so the power generation across the MEA is uniform. The even spacing between the MEAs can be implemented by integrating uniform-length rigid spacers between the wire meshes, as shown in Figure
174 Spacer MEA Wire mesh / Current collector Figure 9.7: Corrugated MEA stack with spacers Perimeter Seal & Contact Resistance For the 2D corrugations, two edges of the MEA are wavy. Since the gaskets around the cell assembly are flat, the Nafion membranes around the perimeter of the MEAs need to be flattened before they can be assembled into the cell. It is always easier to make good seals for flat surfaces than corrugated surfaces. Even though the edges of the MEAs are wavy, the corrugated perimeter can still be sealed by dispensing liquid gasket material around it. After the liquid gasket material, such as silicon, is dispensed, compressive force is applied to the assembled cell to eliminate any voids between the MEA and the cell assembly. For DMFCs with polymer cell assembly, the perimeters of MEAs can also permanently bond to the cell assembly using ultrasonic welding. The contact resistance between the electrode and graphite bipolar plate is always one of the major issues for fuel cell stacks. One of the reasons is because of the peripheral clamping configuration. The clamping force can only be applied to the perimeter of the cell to prevent the leakage problem. Only some limited pressure can be distributed across the MEA regions based on the stiffness of the end plates. For the 2D corrugated MEAs, the contact resistance between the current collector and the electrode is highly dependent on the clearance of their geometries. When the corrugated MEAs are 159
175 assembled between the corrugations of the wire meshes, the compressive force from the wire mesh is pushing against the electrodes; the contact resistance between them can be minimized. Forming wire meshes with corrugations is changing flat wire meshes to spring-like geometries. Energy is stored in springs, so the corrugated wire mesh can release its energy as compression force on the electrodes to reduce the contact resistance between them. Springs are also characterized by their spring constant, which is dependent on the material property and the corrugated geometries. In other words, the compressive force from the corrugated wire mesh can be adjusted by changing its material or geometry to achieve the lowest contact resistance. For the fuel cell stacks, the rigid spacers between the cells can also help to ensure the uniform spacing between the cells. This also means that the corrugated wire meshes would also be able to push against each other as well to keep the equal distance between them Interconnects The interconnections between the MEAs need to be connected in series in order to increase the operating voltage for practical applications. For a batch of corrugated MEA stacks, the electrical connections can be wired from anode of cell 1 to the cathode of cell 2, then from cathode of cell 2 to anode of cell 3, and so on, as show in Figure 9.8. The figure shows that there are overlapping between the wires. This only means that they share the area of that side of the cell assembly. The voltage of the cell stack is equal to the sum of voltages of the single cells. The ohmic resistances of the wiring and interconnects between the single cells are also introduced into the circuitry. Therefore, the current flow from cell stack operation is lower than the current flow from the single 160
176 cell operation. The ohmic resistance can be reduced by using very short and highly conductive wires for the interconnections between the electrodes and also by reducing the contact resistances between the interfaces of the electrodes, current collectors, and the interconnections. Terminal 1 Fuel Terminal 2 Air Figure 9.8: The electrical interconnects of fuel cell stack Fuel Injection Because of the passive operating conditions, the fuel cannot be pumped into the cell stack, only gravitational force and pressure difference can be utilized. One of the possible solutions is shown in Figure 9.9. In Figure 9.9, two corrugated MEAs are mounted in the middle of an enclosed chamber. Their anodes are facing each other with an even space between them. Their cathodes are facing outside of the chamber for airbreathing. Only the anode fuel chamber is fully enclosed. The top of the anode chamber has an opening, which is connected to the CO 2 gas exhaust chamber of the cell. The CO 2 chamber collects all the exhausted gas from DMFCs and returns the gas to the fuel reservoir chamber. When CO 2 gas starts to fill the volume of the fuel reservoir, the fuel reservoir is pressurized. The pressure can force the fuel to enter the wick structures, 161
177 which are connected to the fuel chamber between the MEA anodes. Because this is a closed system with constant volumes in different chambers, the fuel chamber refilling process can be continued until the fuel reservoir is empty. Then, the fuel level of the fuel chamber will start to drop until the entire amount of methanol or water is consumed. One of the important advantages of this closed-system design is that the system can be operated by rotating the cell stack upside down or tilted, which is one of the important design criteria for portable fuel cells. In order to maximize the usage of the fuel and be able to jump start the fuel cell, this design does require pre-filling the fuel reservoir and fuel chamber before enclosure of the system. Other possible solutions for low power fuel injection include a constant spring loaded fuel pump or pressurized fuel cartridge. CO 2 Exhaust Chamber Fuel chamber between two vertical corrugated MEAs Fuel Reservoir Capillary wicks Figure 9.9: Fuel reservoir design for passive DMFC systems. 9.5 Summary In the first section of this chapter, the stacking configuration and packaging requirement for passive DMFCs were described. Several different types of stacking configurations have been explored and investigated. Figure of merit, A/V was used to 162
178 compare the volumetric power density of different stacking configurations. The results show that high aspect ratio corrugated MEA stack has a much higher A/V ratio than the planar MEA stack. A/V ratios of tubular MEA stacks are different from layer to layer, which has potential to achieve higher packing density than the planar MEA stack. Some technical issues related to the system integration of the MEA stack for passive operation conditions have been presented and possible solutions are also proposed in the second part of this chapter. In the next chapter, the conclusions were drawn to answer the research questions from Chapter 1 and recommendations are made for future research directions. 163
179 CHAPTER 10 CONCLUSIONS AND RECOMMENDATIONS Conclusions of the research and recommendations for future work are presented in this chapter. The results of the project are related to the research question described in Chapter 1. The potential contributions of the research are also presented. Finally, the limitations and shortcoming of the research approach are discussed, and future research directions are also stated as future work Conclusions The primary goal of the research was to enhance the volumetric power density of direct methanol fuel cells for portable applications. Based on the research hypotheses, the research question was approached by reducing the minimum required volume for a single MEA. Then, the volumetric power density of the DMFC can be enhanced by patterning MEAs with corrugations. Assuming the height of the flow channel is the same for planar and corrugated MEAs, the minimum required volumes for corrugated MEAs are smaller than the volumes for the planar MEAs. An analytical model was developed to determine the relationships between A/V and the corrugation aspect ratios of the planar and other corrugated geometries in Chapter 4. The comparison plot showed that 3D corrugated geometry has the largest A/V increment as the aspect ratio of the geometry increases. The relationship between A/V and corrugation angle of the 2D triangular corrugation was also determined. As the angle increases towards 90 degrees, A/V value also increases. The performance roadmap was developed based on the relationship between A/V and the 164
180 aspect ratio of the geometries. In theory, for a specific performance enhancement requirement, the performance roadmap can determine the minimum aspect ratio requirements for different corrugations. The performance roadmap assumed that no deformations are introduced during the forming process and the performance of the corrugated MEA remains the same as planar MEAs, then the performance of the corrugated MEA can be predicted by the roadmap. In practice, the forming process will cause changes to the structure of the MEA and affect the performance of the MEA. Experiments were used to validate the analytical model of the performance roadmap. The performance results of the repeatability test illustrated the consistency of the fabrication processes of the baseline MEAs. For the electrode with current lead design, the power densities were not constant for different size MEAs. Therefore, same sizes MEAs were used to compare the performance of MEAs before and after the corrugation processes. Although the performance drop is significant from this current lead design, the simplified system with consistent current lead size is more important for the performance evaluation of the corrugated MEAs. Before planar MEAs were formed into corrugated MEAs, different manufacturing methods for corrugating MEAs were investigated. It was found that pressing and folding processes are the most feasible to be studied experimentally. However, the results of the visual observation and fuel cell performance test showed that 3D corrugations could not be patterned on MEAs using either of the fabrication processes. Therefore, the direction of investigation was redirected to the forming of 2D triangular corrugated MEAs. The experimental results showed that the overall power outputs of the corrugated MEAs were reduced after the forming process. For corrugations with aspect ratios of 1.25, since the 165
181 projected area of the MEA was reduced, the projected area power density of the corrugated MEA was increased by 20% in average. However, some empirical data also showed that the performance could be improved up to 45% for the high quality planar MEAs. For MEA corrugations with aspect ratios of 0.75, the projected area power density of the corrugated MEA stayed the same or even lower than projected area power density of the planar MEA. The performance drop indicated that mechanical deformations were introduced from the corrugating process and affected the electrochemical performance of the MEA. Therefore, the root cause analyses of the mechanical deformations and performance loss during the forming processes have been conducted. The mechanical deformations were studied using finite element analysis. Because large plastic strain can cause many changes to microstructures, which affect the performance of the cell, the strain distribution across the MEA during the pressing and folding processes was the focus of the analysis. The pressing process with all fixed boundaries causes large tensile stress and large plastic strain. The large strain areas are located near the punch radius and die radius. For the free-end scenario of the folding process, the large plastic strain areas are located near the punch radius areas. Parametric analyses have also been conducted on the geometric parameters of the molds, including the die radius, punch radius, and corrugation aspect ratio. Based on the results of the parametric studies, the favorable parameters have been applied to another simulation model, which showed that the magnitudes of the plastic strains have been greatly reduced. The correlation between the aspect ratio and maximum PEMAG indicates that higher aspect ratio corrugations have slightly higher plastic strains compared to the lower aspect ratio corrugations, which 166
182 could further enhance the performance of the corrugated MEAs. The FEA models illustrated that plastic strain is the dominant mechanical deformation during the corrugating process. It also showed that when the design parameters of the mold are optimized, the deformations across the MEA could be further reduced. After the mechanical deformations have been quantified, the increment of the MEA system resistance has been investigated and quantified using electrochemical impedance spectroscopy. The major causes of the performance reduction were confirmed to be the alterations of the microstructure of the electrodes and Nafion membrane thinning. The microstructural changes of the electrodes affect the kinetic and mass transport properties of the electrodes. The polarization resistance is the major source of system resistance increment, which eventually lowers the performance of the cell. Both of the causes result from the large tensile strains. An analytical model has been developed to relate the performance enhancement and performance loss due to the forming process. The analytical model can predict the performance of the corrugated MEA as a function of performance of the planar MEA and the forming die geometries. Based on this model, the original performance roadmap has been modified with the information related to the performance drop due to the forming process. The modified roadmap can provide a more realistic prediction for power density enhancement with corrugated MEAs. Since the modified performance roadmap has incorporated the experimentally determined performance loss due to the forming process, it can provide a better design guideline for the fuel cell designer to select the proper geometry and aspect ratio of the corrugated MEAs. 167
183 Different types of stacking configurations were defined and their potential power density enhancements were determined. The A/V comparison plot showed that corrugated MEA stacks could achieve higher power density than planar MEA stacks. This also validated hypothesis 2 of the research question. Although each of the MEAs in tubular MEA stacks has different reactive area, it could still obtain higher power density than planar MEA stacks if the connection patterns of the MEAs were properly designed. In conclusion, better volumetric power densities can be obtained with higher aspect ratio geometries. The FEA model showed that the magnitudes of plastic strains are reaching their maximum values after the aspect ratio of the corrugation is higher than 1.1. This means that the performance drop due to the mechanical deformation should also start to reach its maximum values as well. For higher aspect ratio corrugation, large reduction of the projected area can greatly reduce the volume of the cell and ultimately increase the volumetric power densities. However, MEA corrugation is not a good approach for volumetric power density enhancement if the rectangular corrugations have lower aspect ratios than 1. The reduction in volume still cannot compensate the large performance loss due to the forming process. Therefore, it is not worth pursuing this approach to improve the volumetric power density of the MEA with low profile corrugations. Different configurations of MEA stacks have been investigated. Although A/V values of different stacks were plotted for performance predictions, the plot only included the theoretical value of geometric model. Similar as single MEAs, the performance cannot be greatly improved by stacking low aspect ratio corrugated MEAs. 168
184 The major intellectual contribution of this thesis is the determination of the relationship between corrugated MEA manufacturing process and fuel cell performance. Root cause analysis of performance loss has been conducted by combining an analytical model of the manufacturing process with electrochemical analysis. In other words, this thesis has established a basis for investigating interdisciplinary problems by combining methodologies from multiple disciplines. Other contributions are also included: this research has identified the trade-off factors and limitations of power density enhancement by forming corrugations on MEAs. The performance loss due to the manufacturing process has been quantified for rectangular corrugations with aspect ratios of 0.75 and The modified performance roadmap is developed, which can help designers making decisions on enhancement of the volumetric power density with corrugated MEAs. The root cause analyses identified and related the mechanical deformations and alteration of microstructure of electrodes that result from the manufacturing processes. The hypotheses of the research have been validated and indicated that the volumetric power density can be enhanced by forming MEAs with corrugations only if the aspect ratio of the rectangular corrugation is larger than Recommendations for Future Work In this research, the catalyst ink mixture and platinum loading on the MEA electrodes were not optimized for the best performance. The under-performing MEAs may greatly affect the performance of the corrugated MEAs. As illustrated in Chapter 6, higher qualities MEAs have much better performance after the corrugation process than other MEAs. By optimizing the recipe of the catalyst ink, Pt loading conditions, and forming parameters, the performance loss of the corrugated MEA can be reduced. 169
185 The FEA models in this research are only based on the material property of Nafion membrane and the forming processes simulated at room temperature. Carbon cloth has totally different mechanical properties than Nafion, and the corrugation forming processes actually occurred above the glass transition temperature of Nafion. It will be very useful to incorporate this information into the simulation model to achieve more accurate results. To relate the mechanical deformations to electrochemistry, a multiphysics model that couples the geometric change from the forming process with the kinetics of the reactions needs to be developed. Such a model should be free from the flaws of the fabrication and testing discrepancies, so that the theoretical performance can be predicted for performance comparison. Although the performance of the corrugated MEA could be predicted with the modified performance roadmap, the information related to the additional manufacturing cost was not included in the roadmap. Additional manufacturing cost is very important to the manufacturer of passive DMFCs. This concern can be address by determining the relationship between the manufacturing cost and the enhanced power density of the corrugated MEAs. Finally, different stacking configuration design and system integrations are very important for practical applications. It is necessary to further investigate the limitations and problems related to the cell stack integration. Because of the passive operating conditions, many other issues related to the cell stack design need to be further investigated. For example, since air would not be pumped towards the cathode sides of the MEAs, it is necessary to determine the minimum required space between cathodes for sufficient air-circulations. 170

186 APPENDIX A Material Property Datasheets of Carbon Cloth Gas Diffusion Layers 171
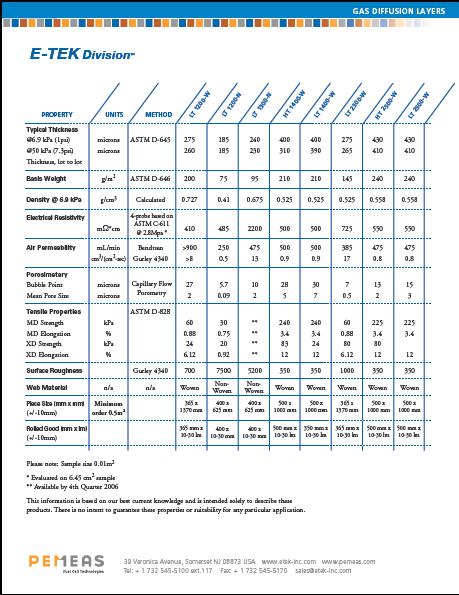
187 172