Geological Storage of CO2. Evaluating the Risk of Leakag! Injection & Leakage
|
|
|
- Allyson Stevenson
- 5 years ago
- Views:
Transcription


1 Geological Storage of CO Evaluating the Risk of Leakag! Injection & Leakage Reservoir model must predict composition of brine that comes into contact with cement From Canadian CO Capture and Storage Roadmap Strawdog, Bill Gunter, Alberta Research Council
2 Potential Leakage Routes Greatest risk is from acid!ow through annulus Well plug Well casing Well cement Injection, Transport & Leakage Model of injection & transport What is the "uid that reaches the cement? Experimental study of cement corrosion How does cement respond to acidic brine? Model of acidic brine in annulus How quickly does a leak increase?
3 Reservoir Model : Dyna"ow Jean Pr#vost, Dick Fu$er, Mohammad Piri Dependence of solubility of CO in the brine on Evaporation, Changing salinity, P, T Transport of salt & CO Evaporation of water behind the front, close to the injection well Precipitation of salt due to evaporation Compressibility of!uids & matrix Porosity change by salt precipitation & matrix compressibility Permeability change due to change in porosity Acidity & solute content of brine Simulation Parameters T = 45 C, P = 1 MPa K abs = 0 md! = 0.1 "NaCl# = 15 wt$ q = 0 kg/s R = 0 km H = 0 m S gr = 0.05, S lr = 0.30 Matrix compressibility = 0.45 GPa %1 Incompressible!uids R q H
4 Comparison to Literature Signi'cant di&erences owing to proper treatment of solubility & evaporation 1 Salting out Fractional Gas Saturation Evaporation 0.4 Literature 33 mos 60 mos 84 mos 96 mos 10 mos R /t (m /s) Comparison to Literature Correct e&ect of evaporation on salinity NaCl Mass Fraction in Liquid Phase 0.30 Literature 33 mos 60 mos 84 mos 96 mos 10 mos Sudden precipitation imposed due to boundary condition R /t (m /s)
5 Comparison to Literature E&ect of evaporation on CO content of brine Mass Fraction of CO in Liquid No effects of water evaporation on solubility of CO in brine Literature 33 mos 60 mos 84 mos 96 mos 10 mos R / t ( m / s ) Conclusions CO storage is a&ected by evaporation (salting out) e&ect = reduction in CO solubility as salt concentration rises New (!ash) algorithm works with 3%phase reservoir simulation *vapor + brine + solid salt+ extendable to include HS, CH4, etc. Injection simulated by controlling!ux Numerical procedures yield exceptional stability
6 Future Plans D and 3D Simulations E&ects on CO storage of buoyancy heterogeneous permeability 'eld hysteresis in relative permeability & capillary pressure geochemistry *dissolution and precipitation+ Extend!ash to include CH4 and HS injection *" second liquid+ Hydrocarbons in formation *" 3%phase!ow+ Physically%based 3%phase relative permeabilities Model of leakage through annulus Corrosion of Cement *Andrew Duguid, Mileva Radonjic, GWS% Cement paste with 0, 6, or 1 $ bentonite Flow%through experiments to 'nd maximum reaction rate Batch reactions to study transport control Field samples from Teapot Dome High P & T studies with NETL Simulate Teapot Dome cement recipe
7 Flow%Through Experiment * Continuous fresh acid+ Acidi'ed brine passes over rod of cement Provides maximum rate of reaction *i.e., no limitation from saturation of solution or di&usion of reaction products+ CO line FLOW Pump FLOW FLOW Reacted brine out FLOW FLOW Cement sample Carbonated brine Reactor vessel Bubbler Brine reservoir Flow%Through Experiment * Continuous fresh acid+ Sandstone formation: ph 3, 50 C 0 hours 6 hours 4 hours 30 hours days 3 days 4 days 6 days 7 days 8 days days 1 days 14 days 17 days 0 days


8 Composition Maps Calcium removed from outer layer Silicon slightly depleted Iron unchanged Iron Silicon Calcium Quantitative Pro'les Calcium is gone from outer layer Calcium Distribution This layer is so soft that it washes o& CaO equivalent Distance from Surface ( mm )
9 Quantitative Pro'les Silica content remains uniform Outer layer is primarily silica gel SiO equivalent Silicon Distribution Distance from Surface ( mm ) Quantitative Pro'les Sodium from brine invades porous outer layer Na O equivalent Sodium Distribution Distance from Surface ( mm )
10 Flow%Through Experiment * Continuous fresh acid+ Corrosion is strongly accelerated by lower ph higher temperature 3 C ph.4 3 C ph C ph.4 50 C ph 3.7 Flow%Through Experiment * Continuous fresh acid+ Under typical conditions of a sandstone formation at,1 km depth, the rate of attack would be roughly % 3 mm per month if &esh acid "owed over the cement 3 50 C and ph.4 50 C and ph Time (min) Time (min)
11 Batch Experiments *Static acidic brine+ Sandstone + Cement 3 & 50 C ph 3, 4, 5 Distinct reaction rim after exposure *ph 3, 3 C+ One Month Two Months Three Months Batch Experiments *Static acidic brine+ Limestone + Cement 3 & 50 C ph 5, 6, 7 Higher ph and dissolved calcium content reduces rate of attack *no reaction rim yet+ One Month Three Months Six Months
12 Permeability of Batch Samples Sandstone samples show %fold increase in 1 month Equivalent to hole 0.4 mm in diameter Permeability ( m ) Sandstone Limestone Limestone shows little change Months of Exposure Composition of E-uent Water exiting reactor shows initial rise in calcium as acid attacks cement Subsequent exponential drop may re!ect protect e&ect of white calcite layer Consistent with plateau in permeability Ca + Conc ( mg / L ) Leaching 1 C, ph C, ph.4 50 C, ph C, ph Elapsed time ( min ) Formation of protective calcite layer?

13 Conclusions Reaction rate is fast % several mm per month % under steady!ow of acidic brine Even under di&usion control, attack is evident within weeks under conditions characteristic of sandstone formation Much less rapid attack in limestone Rate of attack slows as layers develop Protective calcite layer? Quantitative data will permit modeling of attack in annulus Wall Creek Tensleep
14 Teapot Dome Cement Cement retrieved from 3000% years old, made with formation water *high sulfate content+ using class G cement + Flocele *cellophane!akes+ Extremely complex microstructure, may be consequence of Aging at high T & P Use of sulfate%rich brine for mixing cement Schlumberger Coring Tool Electronics Pressure shoe Motor Motor Drill Sample catcher a) Drill Bit b)

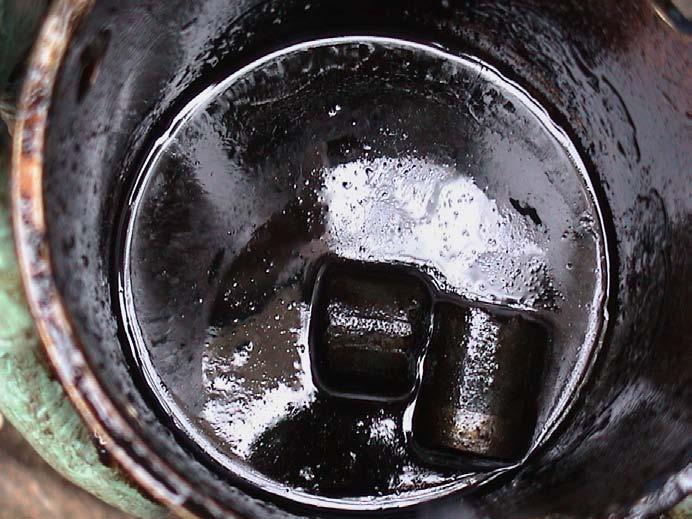
15 Retrieving the Core Cement + Casing
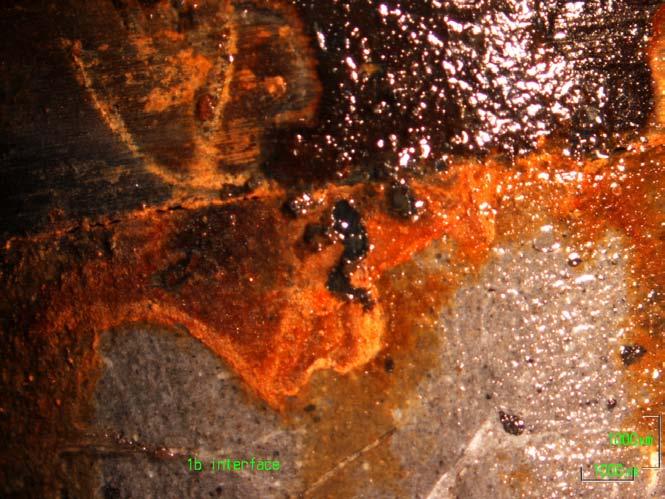
16 Cement/Casing Interface Complex Microstructure

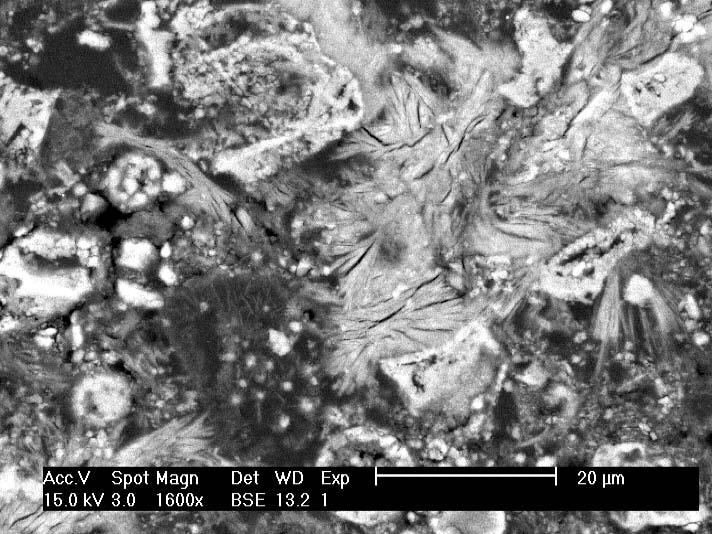
17 Crystals within Crystals... Program Analyze phases & composition of Teapot cement Test durability of Teapot cement Synthesize this recipe Age at high T & P at NETL lab Age at ambient P at Princeton Compare properties If high P proves important, repeat durability tests after curing at high P
18 Tensleep Brine Composition Cations Potassium Sodium Calcium Magnesium Iron-Total Anions Sulfate Chloride Carbonate Bicarbonate Hydroxide Nitrogen, Ammonia as N Nitrogen, Nitrate + Nitrite as N Solids mg/l Total Solids, NaCl Equivalents 00.0 Chloride as NaCl NaCl % of TDS Sample Conditions ph (s.u.) Ionic Strength (u) Accuracy (Sigma) Other Properties Calcium Hardness ascaco Magnesium Hardness as CaCO Total Hardness as CaCO Sodium Adsorption Ratio Specific Gravity Conductivity (uhmo/cm) Resistivity, 68F (Ohm meter) Probabled Mineral Residue, Dry NaCl CaSO4 NaSO Ca(HCO3) MgSO KCl Organics O&G (Total Recoverable).000 meq/l Other