Dear Michelle: November 15, 2010
|
|
|
- Erick Barber
- 5 years ago
- Views:
Transcription
 PLM digital photomicrographs, twenty (20) SEM digital photomicrographs and twenty (20) EDX spectra from the seven")
1 GZA GeoEnvironmental, Inc. 106 South Street Hopkinton, MA Attention: Michelle Mirenda STS Job#: 1996 Billing Ref: Project# , PO# Dear Michelle: November 15, 2010 Please find enclosed twenty (20) PLM digital photomicrographs, twenty (20) SEM digital photomicrographs and twenty (20) EDX spectra from the seven submitted samples for coal/wood ash/coal flyash identification by Polarized Light Microscopy (PLM) and Scanning Electron Microscopy/Energy Dispersive X-ray Spectrometry (SEM/EDX) according to the Methods for Evaluating Application of the Coal Ash and Wood Ash Exemption under the Massachusetts Contingency Plan. METHODS: A portion of the samples were dried in a Blue M Model OV-18SA drying oven at 90 degrees C for 2 hours in a 3-inch aluminum weighing dish to remove any moisture. Numerous black grains, similar in appearance to coal, wood ash or coal ash were removed and separated with tweezers under the examination of a Nikon stereomicroscope. A portion of the grains were mounted on double-sided tape on a ½ inch SEM stub. Another portion of the grains were ground into a fine powder with a mortar and pestle, then an aliquot was deposited in index of refraction liquid (n=1.605 Cargille Series E High Dispersion) on a glass slide for the PLM examination. The SEM stub was coated with graphite from an Edwards Vacuum Evaporator to eliminate charging in nonconductive samples. The samples were examined in an Amray 3300 FESEM (field emission scanning electron microscope) with energy dispersive x-ray spectroscopy (EDX) using a light element detector to determine the elemental composition of the samples. Digital photomicrographs were taken of the particles both by PLM and SEM/EDX in order to document the observations in this report. FINDINGS: The findings are outlined in the chart, followed by a detailed description of the particle types detected. The discussion gives a qualitative description. Please refer to the digital photomicrographs and EDX spectra in the appendix. Page 1 of 24
2 SAMPLE ID COAL COAL ASH COAL WOOD FLYASH ASH MW-221, 4-6 X X ASPHALT TAR BOTTOM ASH/SLAG MW-221, 8-10 X X MW-309, S-1 X X X X MW-309, S-2 X X MW-301, S-1 X X X- Tar paper MW-222, 8-10 X X X X MW-227, X X X X= Detected Empty box= Not Detected Coal was detected in all of the submitted samples. Bituminous coal appears as amber-brown to black irregular shaped opaque particles by PLM. The texture is soft when ground in the mortar and pestle. Anthracite coal exhibits a gray-black opaque color by PLM and the particles are brittle when ground with the mortar and pestle. Coal does not dissolve in the index of refraction oil. SEM examination reveals smooth, sharp and curved surfaces which show parallel conchoidal fracture lines. The EDX spectra demonstrate a very strong carbon peak, low to minor amounts of oxygen and sulfur, and with minor combinations of aluminum, silicon and/or chlorine and iron at times. Coal ash was detected in three of the submitted samples. Coal ash consists of irregular curved gray-black opaque particles that did not dissolve in the index of refraction oil by PLM. SEM examination reflects the presence of pits, craters and puck marks on the surface of the particles. The EDX spectra shows strong oxygen, aluminum and silicon peaks, with minor concentrations of sodium, magnesium, phosphorus, sulfur, chlorine, potassium, calcium, titanium and/or iron at times. If the coal ash was incompletely combusted at low temperatures, an elevated carbon peak may remain. Wood ash was detected in four of the submitted samples. Wood ash exhibits irregularly shaped opaque fibers that did not dissolve in the aromatic oil. By SEM, these fibrous particles frequently show vessels and circular indents or chambers, indicating the cellular structure of the wood. The elemental composition of wood ash may be diverse, and usually depends upon what elements may have diffused into the wood from the surrounding environment. Carbon peaks are always very strong, moderate oxygen, and calcium peaks are usually due to the presence of calcium carbonate that was derived from the decomposition of calcium oxalate crystals in the bark. Other elements that may be present include sodium, magnesium, aluminum, silicon, phosphorus, sulfur, chlorine, potassium, manganese and/or iron. Sample MW-309, S-1 also showed lead. Page 2 of 24
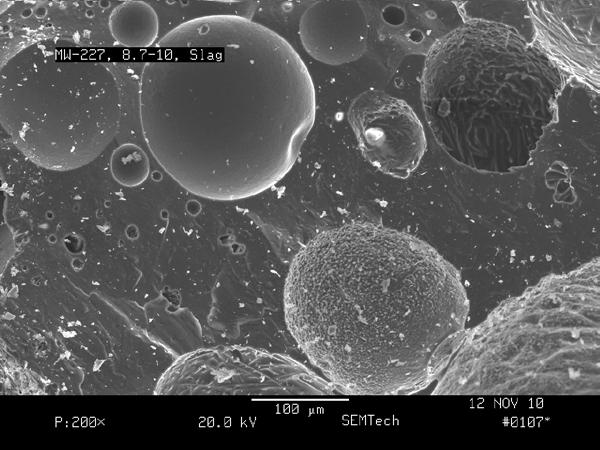
3 Asphalt was detected in two of the submitted samples. Asphalt consists of irregular shaped black opaque particles which immediately dissolve to a brown color in the index of refraction liquid under the PLM. Numerous internal birefringent particles were also observed. The SEM examination shows a globular surface embedded with mineral grains. The EDX spectra consist of very strong to moderate carbon, aluminum and silicon peaks, moderate to low oxygen and sulfur peaks, with minor amounts of sodium, magnesium, potassium, calcium, titanium and iron. The tar component adds elevated levels of carbon and sulfur. Bottom ash/slag was detected in two of the submitted samples. Bottom ash consists of irregular curved multicolored gray-black-red-white predominantly opaque particles that do not dissolve in the index of refraction oil by PLM. SEM examination reveals the presence of pits, craters and puck marks on the interior surface of the particles. Note the spinel and dendritic pattern in both the PLM and SEM images. The EDS spectra exhibits strong concentrations of oxygen, aluminum and silicon, with minor amounts of carbon, sodium, magnesium, potassium, calcium, titanium and iron. These characteristics and chemical ratios match coal bottom ash/slag. Slag has similar characteristics to bottom ash, but also appears as round globular grains on the surface, but exhibit the presence of craters and pits in the interior. Tar paper/felt material was observed in one of the submitted samples. Tar paper immediately starts to dissolve to an orange/brown color in the index of refraction liquid under the PLM with cellulose-like fibers embedded in the matrix. The SEM examination also shows fibers embedded in the particle mass. The EDX spectrum consisted of a very strong carbon peak, with lower concentrations of oxygen, aluminum, silicon and sulfur. These characteristics and elemental ratios match a tar paper/felt material. Tar was detected in one of the submitted samples. Tar demonstrates irregular opaque particles without any embedded internal particles which immediately start to dissolve to an orange/brown color in the index of refraction liquid under the PLM. The SEM examination of a cross-section of a circular globule shows a relatively smooth surface with numerous puck marks from the release of gas under pressure. The EDX spectrum consisted of a very strong carbon peak, with minor levels of oxygen and sulfur. These characteristics and elemental ratios match tar. The tar may be from numerous sources such as coal tar, driveway sealer or tar roof patch. DISCUSSION: The EDX data, texture and morphology of the grains as seen by the PLM and SEM were consistent for a trace concentration of anthracite coal, as well as a trace amount of wood ash in sample MW-221, 4-6. Sample MW-221, 8-10 exhibited a very light amount of bituminous coal and a light concentration of wood ash. Sample MW-309, S-1 demonstrated a moderate to heavy concentration of anthracite coal, a trace of wood ash, a moderate concentration of asphalt and a trace of tar. Page 3 of 24
4 2. There was a light amount of anthracite coal and a light loading of asphalt in sample MW-309, S- Sample MW-301, S-1 showed a heavy concentration of anthracite coal, a light to moderate loading of coal ash, a light concentration of bottom ash and a trace of tar paper. There was a light loading of both bituminous and anthracite coal, a trace of coal ash and a trace amount of wood ash in sample MW-222, Sample MW-227, exhibited a light concentration of bituminous coal, a trace of coal ash and a trace of slag. The digital images and spectra are in the appendix following the discussion. time. Should you have further questions, or need additional information, please contact me at any Sincerely, Ernest T. Dobi, PhD. Analytical Services Manager Page 4 of 24


5 APPENDIX Page 5 of 24


6 Page 6 of 24


7 Page 7 of 24


8 Page 8 of 24


9 Page 9 of 24


10 Page 10 of 24


11 Page 11 of 24


12 Page 12 of 24


13 Page 13 of 24


14 Page 14 of 24


15 Page 15 of 24


16 Page 16 of 24


17 Page 17 of 24


18 Page 18 of 24


19 Page 19 of 24


20 Page 20 of 24


21 Page 21 of 24


22 Page 22 of 24


23 Page 23 of 24

24 Page 24 of 24
25 GZA GeoEnvironmental, Inc. 106 South Street Hopkinton, MA Attention: STS Job#: Billing Ref: Michelle Mirenda 1996Pb Project# , PO# Dear Michelle: November 15, 2010 Please find enclosed seven (7) stereo digital photomicrographs, six (6) SEM digital photomicrographs and nine (9) EDS spectra from the submitted samples for lead identification by stereomicroscopy and Scanning Electron Microscopy/Energy Dispersive X ray Spectrometry (SEM/EDS). METHODS: A portion of the sample was dried in a Blue M Model OV 18SA drying oven at 90 degrees C for 2 hours in a 3 inch aluminum weighing dish to remove any moisture. Numerous colored chips/flakes/particles/glass/metal pieces/wood fragments/grains (anything that doesn t resemble soil) were removed and separated with tweezers under the Nikon stereomicroscope and a portion of the flakes/grains were mounted on double sided tape on a 1 inch SEM stub. Another portion of the soil from the samples was ground into a fine powder with a mortar and pestle, and an aliquot was also deposited onto the SEM stubs. The SEM stubs were coated with graphite from an Edwards Vacuum Evaporator to eliminate charging in nonconductive samples. The samples were examined in an Amray 3300 FESEM (field emission scanning electron microscope) with energy dispersive x ray spectroscopy (EDS) using a light element detector to determine the elemental composition of the samples. Analysis for lead was also performed in backscattered mode (BSE) in the SEM where the image is based on atomic weight (the heavier the atomic weight of the element, the brighter the image). Digital photomicrographs were taken of the particles both by stereomicroscopy and SEM/EDS in order to document the observations in this report. FINDINGS: MW 221, 4 6: Please refer to the stereomicroscope & SEM photomicrographs as well as the EDS spectra for the lead analysis. One snapshot was taken with the stereomicroscope of each SEM stub to show all of the flakes/grains/particles which were isolated in the soil sample and examined in the SEM. The large particles on the stub and an average composition of the soil/dust portion by EDS showed that no lead was detected or observed in this sample. The soil portion of the sample was composed predominantly of aluminum silicates. SEMTech Solutions 6 Executive Park Dr., N. Billerica, MA Page 1 of 13

26 SEMTech Solutions 6 Executive Park Dr., N. Billerica, MA Page 2 of 13

.")

27 MW 221, 8 10 The white grain labeled P1 (Particle #1) on the SEM stub below showed the presence of lead. Only one edge (note arrow on SEM image) was bright which contained the lead portion (~12%). The remainder of the grain only exhibited aluminum, silicon and oxygen, suggesting that the lead was only applied to one surface, possibly by painting. P1 SEMTech Solutions 6 Executive Park Dr., N. Billerica, MA Page 3 of 13


28 Another lead containing particle (#2) was observed in the dust (ground up portion). Based on the morphology and chemistry of the bright region on particle #2, this may be a common lead mineral grain such as galena (PbS) since predominantly only lead (~36%) and sulfur were identified and the grain appeared with a smooth faceted surface, almost cubic in shape. The sulfur peak coincidentally resides beneath the large lead peak. SEMTech Solutions 6 Executive Park Dr., N. Billerica, MA Page 4 of 13
 on this sample did detect the presence of lead (~1%) from a")

29 MW 309, S 1: No lead was detected on the large particles and fine dust as shown from this stub but the coal ash analysis (Report #1996) on this sample did detect the presence of lead (~1%) from a trace amount of wood ash which was observed. This may be due to a painted surface from the original wood which contained lead. SEMTech Solutions 6 Executive Park Dr., N. Billerica, MA Page 5 of 13


30 SEMTech Solutions 6 Executive Park Dr., N. Billerica, MA Page 6 of 13

31 MW 309, S 2: Except for the coal and asphalt detected in this sample from Report #1996, no non soil particles were observed and the average composition of the soil/dust portion demonstrated only aluminum silicates. SEMTech Solutions 6 Executive Park Dr., N. Billerica, MA Page 7 of 13
 labeled P1 (Particle #1) on the SEM stub")
 the lead is only present on one")

32 MW 301, S 1: One of the larger particles (white, flat surface and ceramic like) labeled P1 (Particle #1) on the SEM stub exhibited ~9% lead. The SEM image shows (see arrow) the lead is only present on one side. Once again, this suggests a lead containing paint/stain may have been applied to the surface. P1 SEMTech Solutions 6 Executive Park Dr., N. Billerica, MA Page 8 of 13


33 MW 222, 8 10: The large clear piece of glass labeled P1 (Particle #1) on the SEM stub exhibited ~38% lead. The SEM image shows (see arrow) the lead is only present on one edge. This suggests a lead containing decorative label or print on the glass surface. P1 SEMTech Solutions 6 Executive Park Dr., N. Billerica, MA Page 9 of 13


34 SEMTech Solutions 6 Executive Park Dr., N. Billerica, MA Page 10 of 13


. SEMTech Solutions 6 Executive Park Dr., N.")
35 The presence of lead was detected on a second particle from the ground up soil/dust in this sample. The arrow on the SEM image points to a mineral grain containing ~56% lead and ~19% oxygen. This may be the mineral grain cerussite, a lead oxide (PbO). SEMTech Solutions 6 Executive Park Dr., N. Billerica, MA Page 11 of 13

36 MW 227, : The large grains on the stub and an average composition of the soil/dust portion by EDS showed that no lead was detected or observed in this sample. The soil portion of the sample was composed predominantly of aluminum silicates. SEMTech Solutions 6 Executive Park Dr., N. Billerica, MA Page 12 of 13
37 DISCUSSION: The lead analysis on these samples by SEM/EDS detected only a few particles containing lead, but a few of the individual portions of those particles showed a high percentage of lead, and they were also from numerous sources. No lead was detected from samples MW 221, 4 6; MW 309, S 2; and MW 227, Sample MW 221, 8 10 demonstrated lead on one edge of a particle (possible painted source) and from a lead sulfur mineral grain exhibiting the properties of galena. Less than 1% lead was observed from a trace of wood ash detected in sample MW 309, S 1. Sample MW 301, S 1 showed the presence of lead on one edge of a ceramic tile like chip. Sample MW 222, 8 10 contained a piece of glass with lead on the surface, as well as a lead oxide mineral grain with properties similar to cerussite. time. Should you have further questions, or need additional information, please contact me at any Sincerely, Ernest T. Dobi, PhD. Analytical Services Manager SEMTech Solutions 6 Executive Park Dr., N. Billerica, MA Page 13 of 13