Indian Minerals Yearbook 2017
|
|
|
- Chad Davis
- 5 years ago
- Views:
Transcription
 2565471 PBX : (0712) 2562649, 2560544, 2560648 E-MAIL : cme@ibm.gov.in Website: www.ibm.gov.in March, 2018 20-1")
1 Indian Minerals Yearbook 2017 (Part- III : Mineral Reviews) 56 th Edition (ADVANCE RELEASE) GOVERNMENT OF INDIA MINISTRY OF MINES INDIAN BUREAU OF MINES Indira Bhavan, Civil Lines, NAGPUR PHONE/FAX NO. (0712) PBX : (0712) , , cme@ibm.gov.in Website: March,

2 20 Manganese Ore Manganese occurs as silvery grey in colour and is very hard and brittle in nature. It is always available in combination with iron, laterite and other minerals. Manganese in alloy form is an essential input in steel making and steel is one of the most important key indicator in the industrial economy of any country. In the recent years the trade volume of manganese ore has grown world over and also in India. Presently India isone of the major importers of manganese ore in the world. Manganese ores of major commercial importance are: (i) pyrolusite (MnO 2, Mn about 63.2%); (ii) psilomelane (manganese oxide, containing water and varying amounts of oxides of Ba, K and Na as impurities; Mn commonly 45-60%); (iii) manganite (Mn 2 O 3.H 2 O, Mn about 62.4%); and (iv) braunite (3Mn 2 O 3, MnSiO 8, Mn about 62% and SiO 2 about 10%). Indian manganese ore deposits occur mainly as metamorphosed bedded sedimentary deposits associated with Gondite Series (Archaeans) of Madhya Pradesh (Balaghat, Chhindwara & Jhabua districts), Maharashtra (Bhandara & Nagpur districts), Gujarat (Panchmahal district), Odisha (Sundergarh district) and with Kodurite Series (Archaeans) of Odisha (Ganjam & Koraput districts) and Andhra Pradesh (Srikakulam & Visakhapatnam districts). RESERVES/RESOURCES The total reserves/resources of manganese ore in the country as on have been placed at million tonnes as per NMI database, based on UNFC system. Out of these, million tonnes are categorised as reserves and the balance million tonnes are in the remaining resources category. Gradewise, Ferro-manganese grade accounts for 7%, Medium grade 11%, BF grade 28% and the remaining 54% are of Mixed, Low, Others, Unclassified, and Notknown grades including 0.17 million tonnes of battery/ chemical grade. Statewise, Odisha tops the total reserves/resources with 44% share followed by Karnataka 22%, Madhya Pradesh 12%, Maharashtra & Goa 7% each, Andhra Pradesh 4% and Jharkhand 2%. Rajasthan, Gujarat, Telangana and West Bengal together shared the remaining about 2% resources (Table- 1). EXPLORATION & DEVELOPMENT The exploration and development detais are given in the review on "EXPLORATION AND DEVELOPMENT" in "GENERAL REVIEWS". PRODUCTION AND STOCKS The production of manganese ore 2,393 thousand tonnes during increased by 10% as compared to that in the previous year. There were 142 reporting mines during as against 146 in the previous year. Besides, manganese ore production was reported by seven mines of iron ore, three mines of laterite and one each of quartz and limestone in as against six mines of iron ore, one each of laterite limestone and quartz in In all, 71 producers reported production of manganese ore in About 69% of the total production was reported by 12 mines including 2 associate mine, each producing more than 40,000 tonnes per annum, while 18% was contributed by 13 mines (including one associate mine) each falling in the production range of 20,001 to 40,000 tonnes. The remaining 13% production was reported by 117 manganese ore and 9 associate mines each producing up to 20,000 tonnes. In , twenty four Public Sector mines jointly accounted for 44% of the total production. The contribution of captive mines was 10% of the total production. As regards gradewise composition of production in , 66% of the total production was of lower grade (below 35% Mn), 23% of medium grade (35-46% Mn) and 10% was of high grade (above 46% Mn). Production of manganese dioxide was 27,950 tonnes (1%) during the year as against 20,161 tonnes (1%) in the previous year. 20-2
3 Table 1 : Reserves/Resources of Manganese Ore as on (By Grades/States) (In '000 tonnes) Reserves Remaining Resources Total State/Grade Proved Probable Total Feasibility Pre-feasibility Measured Indicated Inferred Reconnsaissance Total Resources STD111 STD121 STD122 (A) STD211 STD221 STD222 STD331 STD332 STD333 STD334 (B) (A+B) All India : Total By Grades Battery/Chemical Ferro-manganese Medium BF Mixed Medium & BF mixed Ferro-manganese, medium & BF mixed Ferro-manganese & BF Low (-)25% Mn Beneficiable Others Unclassified Not-Known By States Andhra Pradesh Goa Gujarat Jharkhand Karnataka Madhya Pradesh Maharashtra Odisha Rajasthan Telangana West Bengal Figures rounded off. 20-3
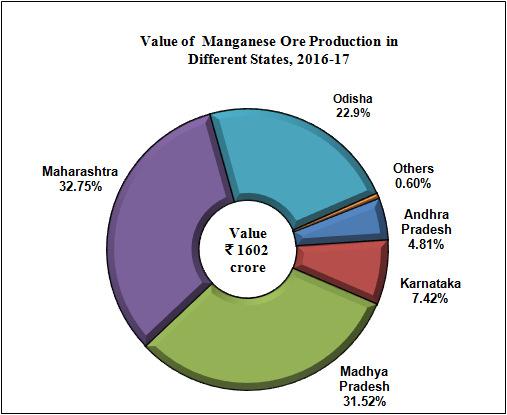
4 Madhya Pradesh being the leading manganese ore producing State accounted for 27% of the total production in Next in the order of production were Maharashtra and Odisha (25% each). The remaining production was reported from Andhra Pradesh, Gujarat, Jharkhand, Karnataka, Rajasthan and Telangana (Tables- 3 to 7). The mine-head closing stock for the year was at 1,214 thousand tonnes as against 1,317 thousand tonnes in the previous year (Tables - 8 (A) and 8 (B). The average daily employment of labour in manganese ore mines was 12,465 in as against 12,990 in the previous year. Table 2 : Principal Producers of Manganese Ore, Name & address of Producer State Location of mine District Table-2 (Concld.) Name & address of Producer Location of mine State District MOIL Ltd, MOIL Bhavan, Madhya Balaghat 1A, Katol Road, Chhaoni, Pradesh Nagpur Maharashtra 1. Bhandara 2. Nagpur Tata Steel Ltd, Odisha 1. Kendujhar Bombay House, 2. Sundargarh 24, Homi Mody Street, Fort, Mumbai Maharashtra. The Sandur Manganese Karnataka Ballari & Iron Ores Ltd, No. 9, Ballari Road, Sadashiv Nagar, Bengaluru Karnataka. RBSSD & FN Das Andhra- Vizianagaram Garividi , Pradesh Shreeram Nagar, Distt. Vizianagaram, Andhra Pradesh. Mangilal Rungta, Odisha Kendujhar Rungta office, Main Road, Barbil, Dist. Kendujhar, Odisha (Contd.) Orissa Manganese & Odisha Sundargarh Minerals Ltd, Lansdowne Towers, 6 th floor, 2/1A Sarat Bose Road, Kolkata West Bengal. S.K. Sarawagi & Co. Andhra Vizianagaram Private Limited, Pradesh 10/1/13, Signature Towers, Level-4, Waltair Uplands, Dist.- Visakhapatanam, Andra Pradesh Aryan Mining & Trading Odisha Sundargarh Corpn. Private Ltd, P1, Hide Lane, Aryan House, 8 th Flooor, Kolkata West Bengal Gujarat Mineral Development Gujarat Panchmahals Corpn. Ltd., Vadodara Khanij Bhavan, 132 Ft Ring Road, University Ground, Vastrapur, Ahmedabad, Gujarat
5 Table 3 : Principal Producers of Manganese Dioxide, Name & address of Producer State Location of mine District Tata Steel Ltd, Odisha Kendujhar 24, Homi Mody Street, Fort, Mumbai , Maharashtra. Mangilal Rungta, Odisha Kendujhar Rungta Office, Main Road, Barbil , Kendujhar, Odisha. Orissa Manganese & Minerals Ltd, Odisha Sundargarh Landsdowne Tower, 6th floor, 2/1A, Sarat Bose Road, Kolkata , West Bengal. Rungta Mines Ltd, Odisha Sundargarh 8A, Express Tower, 42A, Shakespeare Sarani, Kolkata , West Bengal. MOIL Ltd, Maharashtra Bhandara MOIL Bhavan, 1A-Katol Road, Nagpur , Maharashtra. Table 4 : Production of Manganese Ore, to (By States) (Quantity in tonnes; Value in `'000) State (P) Quantity Value Quantity Value Quantity Value India Andhra Pradesh # Gujarat Jharkhand Karnataka Madhya Pradesh Maharashtra Odisha Rajasthan Telangana # # Figures mentioned against are of districts which are part of present Andhra Pradesh and Telangana. 20-5
6 Table 5 (A) : Gradewise Production of Manganese Ore, (By Sectors/States/Districts) (Quantity in tonnes; Value in `'000) State/ Production By Grades: Mn Content Total District No. of mines MnO 2 above 46% 35%-46% 25%-35% below 25% Quantity Value India 146(9) Public Sector Private Sector 123(9) Andhra Pradesh Vizianagaram Goa* South Goa* Gujarat Panchmahal Vadodara Jharkhand Singbhum (West) Karnataka 11(1) Ballari 2(1) Chitradurga Davanagere Tumakuru Madhya Pradesh 45(5) Balaghat 33(1) Chhindwara Jabalpur 6(4) Jhabua Maharashtra Bhandara Nagpur Odisha 31(3) Kendujhar 18(2) Sundargarh 13(1) Rajasthan Banswara Telangana Adilabad Figures in parentheses indicate associated mines of iron ore, laterite,limestone and quartz. * Only labour reported. 20-6
7 Table 5 (B) : Gradewise Production of Manganese Ore, (P) (By Sectors/States/Districts) (Quantity in tonnes; Value in `'000) State/ Production By Grades: Mn Content Total District No. of mines MnO 2 above 46% 35%-46% 25%-35% below 25% Quantity Value India 142(12) Public Sector Private Sector 118(12) Andhra Pradesh Vizianagaram Goa 6* South Goa 6* Gujarat Panchmahal* Vadodara Jharkhand Singhbhum (West) Karnataka 9(1) Ballari 1(1) Chitradurga Davangere Tumkur Madhya Pradesh 42(7) Balaghat 31(1) Chhindwara Jabalpur 6(6) Jhabua Maharashtra Bhandara Nagpur Odisha 31(4) Kendujhar 17(2) Sundergarh 14(2) Rajasthan Banswara Telangana Adilabad Figures in parentheses indicate associated mines of iron ore, laterite, limestone and quartz. * Only labour reported. 20-7
8 Table 6 : Production of Manganese Ore, and (By Frequency Groups) (Quantity in tonnes) Production Group No. of mines Production Percentage in total Cumulative % Production (P) (P) (P) (P) Total 146(9) 142(12) Up to (2) 77(1) (3) 21(5) (1) 10(2) (1) 9(1) (1) (1) 6(1) (1) and above 13(1) 10(1) Figures in parentheses indicate associated mines of iron ore, laterite,limestone and quartz. Table 7 (A) : Mine-head Closing Stocks of Manganese Ore, (By States and Grades) (In tonnes) State Grades : Mn content MnO 2 above 46% 35% - 46% 25% - 35% below 25% Total India Andhra Pradesh Goa Jharkhand Karnataka Madhya Pradesh Maharashtra Odisha Rajasthan Telangana Table 7 (B) : Mine-head Closing Stocks of Manganese Ore, (P) (By States and Grades) (In tonnes) State Grades : Mn content MnO 2 above 46% 35% - 46% 25%-35% below 25% Total India Andhra Pradesh Goa Jharkhand Karnataka Madhya Pradesh Maharashtra Odisha Rajasthan Telangana

9 20-9
10 MINING, PROCESSING, MARKETING & TRANSPORT Manganese ore mining in the country is carried out by opencast as well as by underground methods. Of the 142 mines, 8 are underground (3 in Madhya Pradesh and 5 in Maharashtra). Seven underground mines were operated by MOIL Ltd, a Public Sector company, and one by M/s J.K. Minerals, Balaghat (Madhya Pradesh), a private company. All the underground mines are mechanised or semi-mechanised and adopt cut and fill method of stoping. In Kandri mine, hydraulic sand stowing has been introduced in place of manual filling system. This system is faster, cheaper and requires less manpower. Conventional timber supports are replaced by cable bolting premining support to increase safety and productivity. In Balaghat underground mechanised mine, overhand flat back cut and fill method with rock bolting support and sand stowing is being practised to fill up the voids with a level interval of 30 m and size of stope block as 30 m x 30 m to 60 m x 30 m. Side Dump Loaders (SDL) of 0.66 cu m bucket capacity were also deployed in underground levels for mechanised loading of run of mine (r.o.m.) in stopes. Tyre mounted Rocker shovel was also introduced in Balaghat mine for mechanised loading of ore from ore drive at stripping area. Deepening of vertical shaft up to 435m was completed in Balaghat, up to 169 m in chikla mine, upto 245 m in Kandri mine and up to 160 m in mansar mine of MOIL. Sinking of vertical shafts is in progress at Mansar and Ukwa mines. The open-pits are usually worked manually by benching method, using portable compressors, jackhammers and dumper trucks. Tirodi mine of MOIL is worked by opencast mechanised method. Height of the benches in overburden is kept at 7.5 m and that in the ore at 6 m. Drills of 100 mm dia. with 0.9 to 1.7 m 3 capacity of shovels and tonnes dumpers are used for production, loading & transport. The workings vary from shallow depth in lateritoid-type deposits in Odisha, Karnataka and Goa to deep operations in deposits of a more regular nature found in Madhya Pradesh, Maharashtra and Andhra Pradesh. Bulldozers are used where the overburden is soft. In a few cases, tramways are laid up to the working face and loaded tubs are pushed manually to the dumping ground. In Odisha, Goa and Karnataka, ore is worked by loosening the ground either with crowbars or by blastings. After picking up manganese ore, the waste is removed to the dumping ground. Mining of bedded ore in Madhya Pradesh and Maharashtra is generally carried out by drilling and blasting. Hand sorting and visual grading are adopted widely to upgrade the ore. Scrubber is also used for washing the ore at some mines. Manual as well as mechanised jigging is done in a few mines. MOIL has set up an integrated manganese ore beneficiation plant at Dongri Buzurg mine in Bhandara district, Maharashtra, with 4 lakh tonnes annual capacity to process r.o.m. The plant is equipped with handling, crushing, wet screening, drying and magnetic separation facilities in one complex. MOIL has installed a manganese ore beneficiation plant of 5,00,000 tonnes per annum capacity at Balaghat mine in order to conserve mineral and profitably utilise the low/medium grade ore. The plant facilities include crushing, wet screening, classification and jigging operations. The plant upgrades the low/medium grade fines into high grade and the value addition is around 3-4 times, in case of low grade fines. The company is planning to set up a sintering plant for agglomeration of these fines. After agglomeration, these fines will be utilised in ferro-alloys production. Most of the producers market manganese ore directly to the industrial units. In a few cases, especially in case of supplies of special type of ore or a semi-processed product, middlemen are found to be involved in marketing. Ore from mines is usually sold to the domestic consumers, either at the rail-head or ex-plant. In the cases of Integrated Iron & Steel and Ferro-manganese Industry, the units draw their supplies largely from captive mines. However, special ore types for specific purposes are obtained from other producers. In case of ore 20-10
11 meant for exports, producers other than MOIL Ltd supply it to MMTC, the canalising agency, either at rail-head or at the port. MOIL Ltd did not export manganese ore in the year Transport of manganese ore from mines to rail-head is generally done by trucks from where it is transported to ports by rail wagons. From the mine of MOIL in Balaghat district, Madhya Pradesh, the ore is transported by aerial ropeways to the loading bins at the rail-heads. Battery loco was introduced for underground transport of r.o.m. tub from ore pass chute to skip bunker. In Goa, ore, in bulk is carried by road-cum-river routes up to Mormugao harbour and in a few cases by rail where the mines are close to the railways. The ore loading at river-head into barges is carried out mechanically. ENVIRONMENTAL PROTECTION MOIL carried out mass afforestation work and planted 7,300 saplings during to maintain the ecological balance at area closer to the mines. The cumulative plantation as on is about lakh saplings. The Company has also set up a wind energy farm of 20 MW capacity at Dewas Madhya Pradesh. The company has also plans to install 10.5 MW capacity solar power plant at its mines. R&D work was taken up by MOIL for reclamation of old mined out areas and to ascertain the impact of manganese mining on ecology, including air and water pollution.ventilation reorganisation studies for deeper levels have been conducted at Gumgaon and Chikla mines by IIT, Kharagpur. Recommendations are implemented at Gumgaon mines and in progress at Chikla mines. Various energy saving projects are under process such as, Installation of solar roof top at administrative buildings at all mines. Five MW solar power projects in mine areas in Maharashtra and 5.5 MW solar power projects in Madhya Pradesh. Insallation of small size compressors in underground minesfor enrgy saving. Manganism - a health condition attributed to manganese poisoning - has been reported to be detected in case of five persons working with BHP Billiton's Metalloys, a manganese alloy plant in South Africa. Manganism shows symptoms similar to Parkinson's disease and psychotic behaviour but conditions of development of the disease are not properly understood. USES & SPECIFICATIONS Classification of manganese ore, ferruginous manganese ore, siliceous manganese ore, dioxide manganese ore, and manganiferous iron ore is laid down by BIS vide specification no. IS: (Reaffirmed 2008). Manganese ore is an important material in iron and steel metallurgy, where it is used both in the ore form as such and as ferro-manganese. Manganese improves strength, toughness, hardness and workability of steel, acts as a deoxidiser and desulphuriser and also helps in getting ingots free from blowholes. About 90 to 95% world production of manganese ore is used in metallurgy of iron and steel. High amount of phsophorous makes the manganese ore unsuitable for its metallurgical use, whereas, high phosphorous and high iron content makes it unsiutable for battery industry. Manganese has no satisfactory substitute in its major applications. The specifications of manganese ore by different industries are detailed below: In Iron and Steel Industry, the BIS: (Reaffirmed 2008) specification is laid down for manganese ore. However, specifications based on the user industry indicate that normally manganese ore containing 28 to 35% Mn is used. Ore size generally varies from 10 to 40 mm. For other constituents general stipulations are Fe: 16 to 22%, SiO 2 : 2 to 8%, Al 2 O 3 : 5 to 8% and P: 0.3% maximum. For manganese ore used in Ferro-manganese Industry, besides manganese content, other important considerations are high manganese to iron ratio and a very low content of deleterious phosphorus. Specifications of manganese ore for ferro-manganese are prescribed by the Bureau of Indian Standards vide IS: , (Second Revision, Reaffirmed 2010). BIS has also laid down the specifications of manganese ore sinters for blending for ferro-manganese production vide IS: (Reaffirmed 2009). User's specifications of manganese ore for Ferro-manganese/Silicomanganese industries are furnished in Table
12 Table 8 : User's Specifications of Manganese Ore in Different Ferro-manganese/Silico-manganese Units Name and location of plant Specifications of ore consumed Andhra Pradesh Ferro-Alloys Corp. Ltd, Mn: 70-75% Shreeram Nagar, Dist. Vizianagram. C: 6-8% Nav Bharat Ferro-Alloys Ltd, Mn: 28-50%, P: %, SiO 2 : 8-30% Paloncha, Khammam. Fe :5-8% Chhattisgarh Sarda Energy & Minerals Ltd Mn: 28-30% (Low P) Raipur. Mn: 37-40%, 42-44%, 46% (High P) Monnet Ispat & Energy Ltd, Mn: 28-46% Raipur Fe : 5-16% SiO 2 : 6-34% S & P: % Size: 0-100% (lumps & fines) Hira Power & Steel Ltd, Raipur i) Jain Carbides & Chemicals Ltd, Raipur (Unit-I). Mn: 32-35% ii) Jain Carbides & Chemicals Ltd, Raipur (Unit-II). Mn: 32-35% Karnataka S. R. Chemicals & Ferro Alloys, Belgaum. Mn: 38-40%, Fe: 18-23% Thermit Alloys Ltd, Shivamogga. Mn: 48-54% Kerala INDSIL Hydro Power and Fe-Mn ratio 1:3 to Manganese Ltd, 5% (50%) 1:5 to Pallatheri 8% (50%) Palakkad. P: 0.05% max. Al 2 O 3 : 3 to 5% max. Madhya Pradesh MOIL, Ferro-manganese Plant, Mn: 46-48% Bharveli, Dist. Balaghat. Maharashtra Chandrapur Ferro Alloys Ltd, (Formerly Maharashtra Electro-Smelt Ltd) Mn: 38-46%, Chandrapur. Fe: 6-17% SiO 2 +Al 2 O 3 : 10-16% P: % max mm, 10% max mm, 80-85% min mm, 10% max. Nagpur Power & Industries Ltd, Mn: 42-46%, Nagpur. Fe: 7-8%, SiO 2 : 3.6%, Natural Sugar & Allied Ind. Ltd, Sai Nagar Ranjani, Dist. Osmanabad Odisha Tata Steel Ltd, Joda, Kendujhar. Tamil Nadu Silcal Metallurgical Ltd, Ramanuja Nagar, Coimbatore. West Bengal Cosmic Ferro Alloys Ltd, Bankura Al 2 O 3 : 6-7%, P: % Size: 5-25 mm Size: mm Mn: 43%, min. (for FeMn) 36% min. (for SiMn), Size: mm (for FeMn & SiMn) Captive Mn Ore Size (mm) Below 35% (10-75) + 5% 35% to 46% (10-75) + 5% 46% to 49% (10-75) + 5% Dioxide + 49% (10-75) + 5% MOIL, Mn Ore Below 35% (10-75) + 5% Imported Mn 46 to 49% (10-75) + 5% Mn: 35-40% & above Size: 35 mm Size: 75 mm
13 Manganese dioxide is used for manufacturing dry cell batteries in which it functions as a depolariser of hydrogen. For use in dry cell battery, BIS has prescribed Specification No. IS: (First Revision, Reaffirmed 2010) for manganese dioxide. Suitability of ore depends not only on manganese dioxide content but also on its crystallographic structure. Ore having predominant gamma structure is required. The ore must have high manganese dioxide and low iron content, a certain degree of porosity and moderate hardness. It should be free from metallic compounds such as copper, nickel, cobalt, arsenic, lead and antimony, which are electronegative to zinc (container). The user industry specifications are MnO 2 70% (min.), Fe 6% (max.), moisture 4% (max.), Cu 0.02% (max.) and Ni 0.02% (max.). The size requirement lays down that 90% material should pass through 300 mesh and 100% through 100 mesh. User industry specifications for electrolytic manganese dioxide (EMD) used in dry cell battery are MnO 2 90% (min.), Fe (as oxide) 0.05% (max.), moisture 4% (max.), Pb 0.15% (max.) and ph 4.5 to 5.6. The size requirements are same as those for manganese dioxide ore. Manganese ore is also used in the manufacture of various chemicals such as potassium permanganate, hydroquinone, manganese sulphate, manganese chloride, manganese phosphate etc. In chemical industry, generally high-grade material is used for potassium permanganate. Ore containing MnO 2 80% (min.), SiO 2 5% (max.), Fe 2 O 3 5% (max.) and 200 to 250 mesh ore size is used. In glass industry, ore analysing MnO 2 80% (preferably 86% min.), Fe 2 O 3 5% (preferably 0.75% max.), SiO 2 2.8% (max.), Al 2 O 3 1.1% (max.), BaO 1.3% (max.), CaO 0.4% (max.) and MgO 0.4% (max.) is consumed. Requirement of manganese dioxide for Explosive and Pyrotechnic industries as laid down in IS : (First Revision, Reaffirmed 2011) by BIS is as follows: MnO 2 80% by mass (min.), moisture 1% (max.), matter soluble in water 0.2% (max.) and water soluble chlorides (as NaCl) 0.05% (max). There are three types of material with above composition which show variation in their particle size: Type A, Type B and Type C. Particle size (max.) is 600 micron for Type A, 150 micron for Type B and 74 micron for Type C ore. In addition, grit content should be 1% (max.) for Type A ore. For Match Industry, the MnO 2 content shall be 50% (min.). Pyrolusite is used generally to impart glaze to the pottery and to make coloured bricks. It also finds use as driers for oils, varnishes and paints. Manganese sulphide is used in the manufacture of salts and in calico printing. Manganese chloride is used in cotton textile as a bronze dye. Manganese salts are used in photography and in leather and matchbox industries. CONSUMPTION The consumption of manganese ore in all industries was about 2.71 million tonnes in as against 3.33 million tonnes in Ferro-alloys industries accounted for about 93% consumption followed by Iron & Steel (6%). The remaining (1%) was shared by Battery, Electrode, Chemical, Zinc Smelter and Alloy Steel industries (Table- 9). The consumption of ferro-manganese in increased slightly to 131 thousand tonnes from 122 thousand tonnes in the previous year. Iron & steel industry was the bulk consumer of ferromanganese accounting for about 92% consumption in The remaining 8% was consumed in alloy steel, foundry and electrode industries. Consumption of silico-manganese which was thousand tonnes in increased to thousand tonnes in (Tables- 10 & 11)
14 Table 9 : Estimated Consumption of Manganese Ore 1/*, to (By Industries) (In tonnes) Industry (R) (P) All Industries Ferro-alloys (e) Iron & steel Others: (Alloy steel, chemical, zinc smelter, Battery& electrode ) Figures rounded off. * Includes actual reported consumption and/or estimates made wherever required. Paucity of data,hence coverage may not be complete. 1/ Apparent consumption of manganese ore is about 2,742,861 tonnes during Table 10 : Consumption* of Ferro-manganese, to (By Industries) (In tonnes) Industry (R) (P) All Industries Alloy steel Electrode Foundry Iron & steel Figures rounded off. * Includes actual reported consumption and/or estimates made wherever required; Paucity of data has posed restriction to the datacoverage on consumption. Table 11 : Consumption* of Silico-manganese, to (By Industries) (In tonnes) Industry (R) (P) All Industries Alloy steel Electrode Foundry Iron & steel Figures rounded off. * Includes actual reported consumption and/or estimates wherever required; Paucity of data has posed resteiction to the data
15 INDUSTRY Manganese alloys are the largest produced ferro-alloys in the world with a share of about 41% of the global production of ferro-alloys. For production of one tonne of ferro-manganese, about 2.6 tonnes of manganese ore, 0.5 tonne of reductant and 3 MWh of electricity inputs are required. As per Indian Ferro Alloys Producers' Association (IFAPA), the total installed capacity of manganese alloys including ferro-manganese/ silico-manganese in the country was estimated to be around 3.16 million tonnes per annum. MOIL had set up a High Intensity Magnetic Separation Plant and 1,000 tpy Electrolytic Manganese Dioxide (EMD) Plant at Dongri Buzurg mine. The plant is under expansion to 1,500 tpy capacity. In , about 612 tonnes of EMD was produced as against 950 tonnes in Ferro-manganese plant of 10,000 tonnes per annum capacity has been set up at Bharveli, Balaghat. In , 6,519 tonnes of ferromanganese was produced as compared to 10,045 tonnes in the previous year. Ferro-manganese The total production of various types of manganese alloys (high carbon ferro-manganese, medium carbon ferro-manganese and low carbon ferro-manganese) was about 4.72 lakh tonnes in (up to February 2016), as per Monthly Statistics of Mineral Production (February, 2016). It is to be noted that the data coverage is partial and does not reflect the actual production. Silico-manganese Silico-manganese is a combination of 60-70% Mn, 10-20% silica and about 20% carbon. As per Monthly Statistics of Mineral Production (March, 2016), production of silico-manganese was reported at 2,69,920 tonnes in from 2,49,691 tonnes in It is to be noted that the data coverage is partial and does not reflect the actual production. MOIL was considering setting up ferro-manganese and silico-manganese plants through joint venture companies with RINL and SAIL, namely, 31,000 tpy ferro-manganese and 75,000 tpy silico-manganese plants at Nandini near Bhilai, Chhattisgarh and a 20,000 tpy ferromanganese and 37,000 tpy silico-manganese plants at Bobbili, Vizianagaram district, Andhra Pradesh with RINL. These projects are not viable at present especially on account of the present power tariffs of the State Elctricity Boards. activities in respect of both these joint venture companies have been put on hold. The major factor driving the production of manganese alloys is high production growth of low nickel austenitic stainless steel. India is emerging as the largest producer of this steel where manganese is added substituting the expensive nickel. Iron & Steel Iron & Steel Industry was the second major consumer of manganese ore wherein manganese ore is used directly as a blast furnace feed. Details on consumption, specifications and source of supply of manganese ore to major iron & steel plants in the country in and are furnished in Table-12. Dry Battery Consumption of manganese dioxide ore in Dry Battery Industry was 14,600 tonnes in , [excluding Electrolytic Manganese Dioxide EMD)]. The demand was met through imports, supported by indigenous production of manganese dioxide and EMD. Dry battery Industry also consumes EMD along with natural manganese dioxide ore. The only one plant of 1,000 tpy capacity producing EMD is owned by MOIL and is located in Bhandara district. SUBSTITUTES Cost and technology militate substitution in major applications. However, for economic reasons, there is only limited substitution in minor applications in Chemical and Battery industries. The Steel Industry has, however, made great strides in economising the use of manganese, largely through changes in steel-making techniques
16 Table 12 : Consumption, Specifications and Source of Supply of Manganese Ore in Different Iron and Steel Plants, and Production of pig iron/hot Consumption of Plant metal (tonnes) Mn-ore (tonnes) Specifications of Source ore consumed Bhilai Steel Plant, Hot metal Hot metal NA Size: 25 to 85 mm MOIL/ Bhilai Nagar, Durg Ramtek Chhattisgarh Mn: 30% min. Goberwahi, SiO 2 : 30% max. Gua Mines Al 2 O 3 : 5% max. SAIL, RMD P: 0.3% max. Bokaro Steel Plant, Hot metal Hot metal NA NA Mn: 30% max. - Bokaro, Jharkhand SiO 2 +Al 2 O 3 : 20.5% max. -10 mm -15% max. +40 mm -10% max. Durgapur Steel Plant, Hot metal Hot metal NA NA Mn: 30% min. - Durgapur, Fe: 15-28% West Bengal. SiO 2 : 3.3% max. Al 2 O 3 : 7.5% max. Rourkela Steel Plant, Hot metal Hot metal NA NA - - Rourkela, Odisha IISCO Steel Plant, Hot metal Hot metal NA NA Mn (dry) 30% (min.) - Burnpur, mm % max. Dist. Burdwan, +40 mm - 15% max. West Bengal Visvesvaraya Hot metal Hot metal NA NA - - Iron and Steel Ltd, Bhadravati, Shivamogga, Karnataka. KIOCL Ltd, Hot metal Hot metal NA NA Fe: 25-50% min. Milan Pellet Plant, NA NA MnO 2 : 44% min. Minerals, Mangaluru, SiO 2 +Al 2 O 3 : 12% max. Karnataka Dakshina Kannada, Karnataka. Visakhapatnam NA NA NA Mn: 28%, (min.) Garividi, Steel Plant, Fe: 16% Andhra Visakhapatnam, SiO 2 : 25% max. Pradesh Andhra Pradesh. Size: mm (BF) (-) 10 mm (SP) IDCOL, Kalinga Iron Hot metal Hot metal Size: mm From own/ Works Ltd, local mines Barbil, Kendujhar, Odisha. Gordan Steel Hot metal Hot metal India Ltd, (e) Mn 28-35% Mn - Jaonbulapadu, Anantapur, Andhra Pradesh. Tata Steel Ltd, Hot metal Hot metal NA NA NA - Jamshedpur, Jharkhand. (Contd.) 20-16
17 Table - 12 (Contd.) Production of pig iron/hot Consumption of Plant metal (tonnes) Mn-ore (tonnes) Specifications of Source ore consumed Kirloskar Ferrous Pig iron Pig iron Mn: 28% min. SMIORE, Industries Ltd, Fe: 20% min. Adarsha Berinahalli, , SiO 2 : 8% max. Mining Co., Koppal, Alkalies: 1% max. Omkaramma Karnataka. Size: 10 to 40 mm 90% min. under & over size: 5% max. each LANCO Industries Pig iron+ Pig iron+ NA NA NA NA Ltd, Chittoor, (molten metal) (molten metal) Andhra Pradesh (e) Visa Steel Ltd, Hot metal Hot metal 302 NA below 35% Mn Siljoda Kalinganagar, NA NA Mines Jajpur, Odisha. Sunflag Iron & Steel Hot metal Hot metal NA NA - - Co. Ltd, Bhandara, (e) Maharashtra. Jaiswal Neco Industries Ltd, Hot metal Hot metal Mn:26-28% - Siltara, Raipur, Size:10-60 mm Chhattisgarh. Jaiswal Neco Hot metal Hot metal - - NA NA Industries Ltd, Bellari, Karnataka. Tata Metalliks Ltd, Hot metal Hot metal NA NA Kharagpur, Medinipur, West Bengal. JSW Steel Ltd, Hot metal Hot metal - - NA NA Salem, Tamil Nadu JSW Steel Ltd, Hot metal Hot metal - - NA NA Vidyanagari, Bellari, Karnataka. Rashmi Metaliks Ltd, Hot metal Hot metal NA NA Gokulpur, West Midnapur, West Bengal. Sona Alloys P. Ltd, Hot metal Hot metal NA 3640 NA NA Lonad, Pune, (e) Maharashtra. Aparant Iron & Pig Iron Pig Iron NA NA Steel Pvt.Ltd, Goa (e) Uttam Galva Hot metal Metallics Ltd, (e) NA NA Bhugaon , Wardha, Maharashtra (Contd.)
18 Table - 12 (Concld.) Production of pig iron/hot Consumption of Plant metal (tonnes) Mn-ore (tonnes) Specifications of Source ore consumed Vedanta Ltd, Navelim Amona, Marcela, Goa. Neelachal Ispat NA NA - - Nigam Ltd, Kalinga Nagar, Duburi, Jajpur, Odisha. Suraj Products Ltd Barpali, Rajgangpur, Sundargarh, Odisha. TECHNICAL POSSIBILITIES The deep-sea nodules can be a potential resource of manganese in the next decades to come. There is a trend towards using lower grades of ores in ferro-manganese production. New steel-making practices and techniques are reducing the amount of manganese consumed in the process. However, counter balancing this to some extent is a trend towards higher manganese specifications for modern steels. TRADE POLICY Export Policy The Foreign Trade Policy, and the policy on export puts restrictions on exports of manganese ore as follows: HS Code Item description Policy Nature of restriction Manganese ores State Exports through excluding the Trading (a) MMTC following: Enterprise (b) MOIL for Lumpy/blended manganese ore manganese ore produced in with more than MOIL mines 46% Mn Lumpy/blended Restricted Export permitted manganese ore under licence with more than 46% Mn Import Policy Imports of manganese ore and concentrates including ferruginous manganese ores and concentrates containing 20% or more manganese (calculated on dry weight basis), agglomerated manganese ore sinters, etc. are freely allowed. WORLD REVIEW The total world reserve of manganese ore is approximately 680 million tonnes of metal content which is unevenly distributed (Table-13). Reserves are located in South Africa (29%), Ukraine (21%), Brazil (18%), Australia (14%), China (7%) and India (5%). Only a small fraction of global manganese reserves is clearly economic. This fact continues to support interest in deep-sea manganese nodules, which constitute an enormous untapped resource. Most nodules are found in areas of deep-sea floor at water depths of 5 to 7 km. The Pacific Ocean alone is estimated to contain about 2.5 billion tonnes nodules containing about 25% Mn, making them similar in abundance to low-grade landbased deposits. Most major steel-making nations lack manganese resources. North America had less than 1% world reserves. Besides, United States have lean grade reserves and potentially high extraction cost. This situation has created an active global trade in manganese ore and manganese alloys. World production of manganese ore in 2015 was estimated to be around 53.2 million tonnes as compared to 54.5 million tonnes in South Africa was the leading producer contributing about 30% followed by China (28%), Australia (12%), Gabon (8%), India (4%) and Kazakhstan (3%) (Table-14). The production of manganese ore is linked with the production of steel. The Steel Industry consumes it in the form of ore and manganese alloys
19 Table 13 : World Reserves of Manganese Ore (By Principal Countries) Exports (In '000 tonnes of metal content) FOREIGN TRADE Reserves World: Total (rounded) Australia Brazil China Gabon Ghana India* Kazakhstan 5000 Mexico 5000 South Africa Ukraine Other countries small Source: Mineral Commodity Summaries, January,2018. * India's total resources of manganese ore as on are estimated at 496 million tonnes. Table 14 : World Production of Manganese Ore (By Principal Countries) (In '000 tonnes) World:Total Australia Brazil China (e) Gabon e 4000 e Ghana India* Kazakhstan Malaysia South Africa e Ukraine e Other countries Source: World Mineral Production, * India's production of manganese ore in , and was 2.63 million tonnes 2.37 million tonnes and 2.15 million tonnes, respectively. Exports of manganese ore was245 tonnes in More than 61% of exports were to Netherlands and 36% exports to Turkey. Exports of manganese ore decreased drastically to about 444 tonnes in from 11 thousand tonnes in Out of the total exports in , 93 tonnes of manganese ore having +46% Mn were exported. There were no exports of ore having 30 to 35% Mn. Exports of manganese ore (others) were 351 tonnes. More than 78% of exports were to Netherlands and 21% exports to Nepal. Exports of manganese oxide (total) increased to 21,850 tonnes in , as against 16,449 tonnes in the previous year. Manganese oxide exports in comprised manganese dioxide 2,679 tonnes and other than manganese oxides 19,171 tonnes. Exports were mainly to Russia (10%), Spain (8%), Indonesia and Germany (6% each) Canada and Vietnam (5% each). In , exports of manganese and alloys (including waste & scrap) increased to 190 tonnes as compared to 134 tonnes in the previous year. Exports of manganese & alloys (wrought/un-wrought) in were at 180 tonnes as compared to 114 tonnes in the previous year (Tables- 16 to 23). Imports Imports of manganese ore was 1.91 million tonnes in South Africa (55%), Australia (22%) and Gabon (11%) were the main suppliers of manganese ore in Imports of manganese ore decreased to about 2.22 million tonnes in from 3.17 million tonnes in South Africa (50%), Australia (24%) and Gabon (20%) were the main suppliers of manganese ore in Out of the manganese ore (total) imported, manganese ore having +46% Mn contributed 5,88,896 tonnes, manganese ore having 35 to 46% Mn were 13,85,986 tonnes, manganese ore having 30 to 35 % Mn were 1,99,508 tonnes and manganese ore (others) were 15,112 tonnes. In , imports of manganese dioxide were 8,225 tonnes. Imports were mainly from China (82%), Indonesia (13%) and South Africa (3%).Imports of manganese oxide and other than manganese dioxides were 4,966 tonnes. During , imports of manganese & alloys (including waste and scrap) were 29,045 tonnes, out of which manganese & alloys (unwrought) comprised 20,839 tonnes. Imports of manganese & alloys NES were 195 tonnes mostly from China (76%) and Spain (16%) (Tables- 25 to 35)
20 Table 15 : Exports of Manganese Ore : Total Qty (t) (P) Value (`'000) All Countries Netherlands Turkey Nepal 7 35 Other countries Table 16 : Exports of Manganese Ore : Total All Countries Netherlands Nepal Saudi Arabia Malaysia Bhutan Brunei Pakistan Other countries Table 17 : Exports of Manganese Ore (46% or more Mn) All Countries Nepal Saudi Arabia Bhutan
21 Table 18 : Exports of Manganese Ore (Others) All Countries Netherlands Malaysia Nepal Brunei Pakistan Other countries Table 19 : Exports of Manganese Oxide : Total All Countries Russia Spain Canada Indonesia Germany Vietnam Thailand Turkey Australia Belgium Other countries
22 Table 20 : Exports of Manganese Dioxide All Countries Iran Saudi Arabia Poland Kenya Italy Bangladesh Netherlands Thailand Malaysia Sri Lanka Other countries Table 21 : Exports of Manganese Oxide (Other than Manganese Dioxide) All Countries Russia Spain Canada Indonesia Germany Vietnam Turkey Thailand Australia Belgium Other countries
23 Table 22 : Exports of Manganese & Alloys (Incl. Waste & Scrap) All Countries France China Korea, Rep. of Slovenia Chinese Taipei/ Taiwan Malaysia Korea Dem P. Rep. Italy Brazil Romania Other countries Table 24 : Imports of Manganese Ore : Total Qty (t) (P) Value (`'000) All Countries Argentina Australia Brazil Cote D' Ivoire Gabon Egypt Malaysia South Africa Other countries Table 23 : Exports of Manganese & Alloys : (Wrought/Unwrought) All Countries France China Korea, Rep. of Slovenia Chinese Taipei/ Taiwan Malaysia Korea Dem P. Rep. Italy Brazil Romania Other countries Table 25 : Imports of Manganese Ore : Total All Countries South Africa Australia Gabon Ivory Coast/ Cote d' Ivoire Malaysia Singapore France Peru Colombia Indonesia Other countries
24 Table 26 : Imports of Manganese Ore (46% or more Mn) All Countries Australia South Africa Gabon Singapore Peru Colombia UAE Tanzania Rep Zambia Nigeria Other countries Table 27: Imports of Manganese Ore (35% or more but below 46% Mn) All Countries South Africa Gabon Australia Ivory Coast/ Cote d' Ivoire France Malaysia Nigeria Morocco Turkey Senegal Other countries
25 Table 28 : Imports of Manganese Ore (30% or more but below 35%) All Countries Gabon South Africa Malaysia Australia Ivory Coast/ Cote d' Ivoire Morocco Georgia Other countries Table 30 : Imports of Manganese Dioxide All Countries China Belgium Indonesia South Africa Japan USA Germany UK Canada Singapore Table 29 : Imports of Manganese Ore (Others) All Countries Malaysia Indonesia Kazakhstan Germany South Africa Ivory Coast/ Cote d' Ivoire Other countries Table 31 : Imports of Manganese Oxide (Other than Manganese Dioxide) All Countries Belgium South Africa Indonesia China USA Germany Japan Australia UK Canada Other countries
26 Table 32: Imports of Manganese & Alloys (Incl. Waste & Scrap) By Countries All Countries China France USA South Africa Germany Spain Sweden UK Switzerland Japan Other countries Table 33 : Imports of Manganese & Alloys Unwrought By Countries All Countries China France USA South Africa Sweden Germany Japan Singapore UK UAE Other countries