Mech i an l ca Failure 1
|
|
|
- Gervais Beasley
- 5 years ago
- Views:
Transcription
1 Mechanical Failure 1
2 Failure Modes Overview Fracture, Fatigue, Creep Fracture Modes Ductile, Brittle, Intergranular, Transgranular Fracture Toughness Stress Concentrators (Flaws) Crack Propagation 2
3 Fracture Modes Simple fracture is the separation of a body into 2 or more pieces in response se to an applied stress that is static (constant) and at temperatures that are low relative to the T m of the material. Classification is based on the ability of a material to experience plastic deformation. Ductile fracture Accompanied by significant plastic deformation Brittle fracture Little or no plastic deformation Sudden, catastrophic 3
4 Fracture Mechanism Imposed stress Crack Formation Propagation Ductile failure has extensive plastic deformation in the vicinity of the advancing crack. The process proceeds relatively slow (stable). The crack resists any further extension unless there is an increase in the applied stress. In brittle failure, cracks may spread very rapidly, with little deformation. These cracks are more unstable and crack propagation will continue without an increase in the applied stress. 4
5 Crack Propagation Cracks propagate due to sharpness of crack tip A plastic material deforms at the tip, blunting the crack. deformed region brittle plastic Energy balance on the crack Elastic strain energy- energy stored in material as it is elastically deformed this energy is released when the crack propagates creation of new surfaces requires es energye 5


6 Ductile vs Brittle Failure Fracture behavior: Very Ductile Moderately Ductile Brittle %AR or %EL Large Moderate Small Ductile fracture is Ductile: Brittle: usually more desirable Warning before No than brittle fracture. fracture warning 6


7 Moderately Ductile Failure Evolution to failure: necking void nucleation Coalescence of cavities Crack propagation fracture Resulting fracture surfaces (steel) particles serve as void nucleation sites mm From V.J. Colangelo and F.A. Heiser, Analysis of Metallurgical Failures (2nd ed.), Fig , p. 294, John Wiley and Sons, Inc., (Orig. source: P. Thornton, J. Mater. Sci., Vol. 6, 1971, pp ) 100 mm Fracture surface of tire cord wire loaded in tension. Courtesy of F. Roehrig, CC Technologies, Dublin, OH. Used with permission. 7


, Fig. 4.1(a) and (b), p.")
8 Ductile failure: -- one piece -- large deformation Example: Pipe Failures Brittle failure: -- many pieces -- small deformations Figures from V.J. Colangelo and F.A. Heiser, Analysis of Metallurgical Failures (2nd ed.), Fig. 4.1(a) and (b), p. 66 John Wiley and Sons, Inc., Used with permission. 8
9 Ductile vs. Brittle Failure cup-and-cone fracture brittle fracture 9
10 Ductile Failure (a) SEM image showing spherical dimples resulting from a uniaxial tensile load. (b) SEM image of parabolic dimples from shear loading. 10
11 Brittle Fracture Arrows indicate point at failure origination Distinctive pattern on the fracture surface: V- shaped chevron markings point to the failure origin. 11
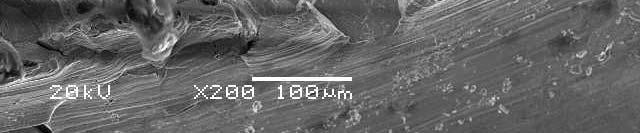
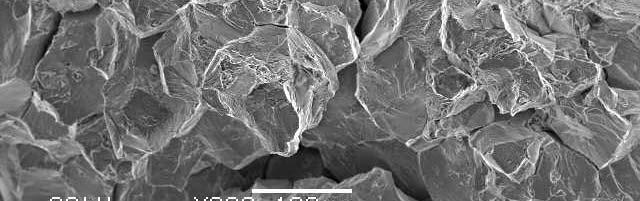
12 Transgranular Fracture Cleavage - in most brittle crystalline materials, crack propagation that results from the repeated breaking of atomic bonds along specific planes. This leads to transgranular fracture where the crack splits (cleaves) through the grains. 12
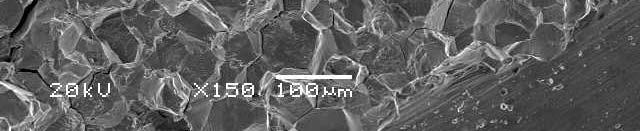
13 Intergranular Fracture Intergranular failure is typically due to elemental l depletion (chromium) at the grain boundaries or some type of weakening of the grain boundary due to chemical attack, oxidation, embrittlement. 13
14 Fracture Mechanics Studies the relationships between: material properties stress level crack producing flaws crack propagation mechanisms 14
15 Stress Concentration The measured fracture strengths for most brittle materials are significantly lower than those predicted by theoretical calculations based on atomic bond energies. This discrepancy is explained by the presence of very small, microscopic flaws or cracks that are inherent to the material. The flaws act as stress concentrators or stress raisers, amplifying the stress at a given point. This localized stress diminishes with distance away from the crack tip.
16 Fracture Toughness Fracture toughness measures a material s resistance to brittle fracture when a crack is present. It is an indication of the amount of stress required to propagate a preexisting flaw. Flaws may appear as cracks, voids, metallurgical inclusions, weld defects, design discontinuities, or some combination thereof. It is common practice to assume that flaws are present and use the linear elastic fracture mechanics (LEFM) approach to design critical components. This approach uses the flaw size and features, component geometry, loading conditions and the fracture toughness to evaluate the ability of a component containing i a flaw to resist fracture.
17 Ductile vs Brittle The effect of a stress raiser is more significant in brittle than in ductile materials. For a ductile material, plastic deformation results when the maximum stress exceeds the yield strength. This leads to a more uniform distribution of stress in the vicinity of the stress raiser; the maximum stress concentration factor will be less than the theoretical value. In brittle materials, there is no redistribution or yielding.
18 Fracture Toughness 18
19 stress-intensity factor (K) The stress-intensity factor (K) is used to determine the fracture toughness of most materials. A Roman numeral subscript indicates the mode of fracture and the three modes of fracture are illustrated in the image to the right. Mode I fracture is the condition where the crack plane is normal to the direction of largest tensile loading. This is the most commonly encountered mode. The stress intensity factor is a function of loading, crack size, and structural geometry. The stress intensity factor may be represented by the following equation: K I is the fracture toughness in σ is the applied stress in MPa or psi a is the crack length in meters or inches β is a crack length and component geometry factor that is different for each specimen, dimensionless.
20 Critical Stress All brittle materials contain a population of small cracks and flaws that have a variety of sizes, geometries and orientations. When the magnitude of a tensile stress at the tip of one of these flaws exceeds the value of this critical stress, a crack forms and then propagates, leading to failure. Condition for crack propagation: Stress Intensity Factor: --Depends on load & geometry. K K c Fracture Toughness: --Depends on the material, temperature, environment & rate of loading. 20


21 Compact tension (CT) specimen single edge notch bend (SENB or three-point bend)
22 Flaws are Stress Concentrators ρ t If the crack is similar to an elliptical hole through plate, and is oriented perpendicular to applied stress, the maximum stress σ m= 1/ 2 a σ m = 2σ o ρ t where ρ t = radius of curvature σ o = applied stress σ m = stress at crack tip = K t σ o a = length of surface crack or ½ length of internal crack σ m / σ o = K t the stress concentration factor 22
23 DESIGN AGAINST CRACK GROWTH Crack growth condition: K K c Yσ πa Largest, most stressed cracks grow first. --Result 1: Max flaw size dictates design stress. --Result 2: Design stress dictates max. flaw size. K d i c 1 σ K design < a Y max < c πamax π a max σ Yσ design 2 fracture fracture no fracture a max no fracture σ
24 Design Example: Aircraft Wing Material has K c = 26 MPa-m 0.5 Two designs to consider... Design A -- largest flaw is 9 mm -- failure stress = 112 MPa Use... σ c = Y Kc πa max Design B -- use same material -- largest flaw is 4 mm -- failure stress =? Key point: Y and K c are the same in both designs. Y is a dimensionless i parameter; see Callister page Result: 112 MPa 9 mm 4 mm ( σ ) ( ) c amax = σ a A c max B Reducing flaw size pays off. Answer: ( ) B = ( σ c B 168 MPa 24
25 Sensors made to mesh with plane Structural engineers have long imagined the day when materials used in an aircraft, a wind turbine blade or a bridge could sense if they had been strained to the point of damage, reducing their load-carrying capacity, and report that information in real time before the structure's safety is compromised. For many years, such a scenario was more the stuff of science fiction than fact, but today, structural health monitoring (SHM) systems that can perform these tasks are closer to reality. Scientists have created a fiber mesh embedded with sensors designed to monitor an airplane s structural integrity and outside temperature. When wrapped around an aircraft, the sensors could help prevent microscopic cracks from developing into catastrophic failures. Made from a plastic polymer, the mesh is designed so it doesn t add significant weight or drag to an aircraft. The technology also could be used in autos, packaging g and medical devices.

")


26 Structural health monitoring (SHM) systems can be arrayed in similar fashion to the human nervous system, with sensors concentrated in key areas where loads are highest. A piezoelectric-based sensor system from Acellent Technologies, called SMART Layer, identifies damage with small ceramic actuators t A comparative vacuum-monitoring (CVM) sensor, is a thin, self-adhesive rubber patch that detects cracks in the underlying material. The rubber is laser-etched with rows of tiny, interconnected channels or galleries, to which an air pressure is applied. Any propagating crack under the sensor breaches the galleries and the resulting change in pressure is monitored. An FAA-sponsored study on curved honeycomb-cored panels showed that acoustic emission (AE) monitoring is a reliable method for locating damage initiation sites and for tracking crack progression. Source: Physical Acoustics Corp
27 27
 fracture")


28 Most ceramics (at room temperature) fracture before any plastic deformation can occur. Typical crack configurations for 4 common loading methods. Brittle Fracture of Ceramics 28


29 Brittle Fracture of Ceramics Surface of a 6-mm diameter fused silica rod. Characteristic fracture behavior in ceramics Oi Origin i point Initial region (mirror) is flat and smooth After reaches critical velocity crack branches mist hackle 29

30 Fracture of Polymers The fracture strengths of polymers are low relative to ceramics and metals. The fracture mode in thermosetting polymers (heavily crosslinked networks) is typically brittle. For thermoplastic polymers, both ductile and brittle modes are possible. Reduced temperature, increased strain rate, sharp notches, increased specimen thickness are some factors that can influence a brittle fracture. One phenomenon that occurs in thermoplastics is crazing, very localized plastic deformation and formation of microvoids and fibrillar bridges aligned chains fibrillar bridges microvoids crack 30

 final height ht initial iti")
31 Impact Testing Impact loading: -- severe testing case -- makes material more brittle -- decreases toughness (Charpy) final height ht initial iti height ht 31


 Fig.")
32 Ductile to Brittle Transition Temperature (DBTT) Pre-WWII: The Titanic WWII: Liberty ships Disastrous consequences for a welded transport ship, suddenly split across the entire girth of the ship (40 F). The vessels were constructed from steel alloys that exhibit a DBTT room temp Reprinted w/ permission from R.W. Hertzberg, "Deformation and Fracture Mechanics of Engineering Materials", (4th ed.) Fig. 7.1(a), p. 262, John Wiley and Sons, Inc., (Orig. source: Dr. Robert D. Ballard, The Discovery of the Titanic.) 32
33 Charpy Impact Energy (A) and Shear Fracture % (B) Correlated with Temperature 33
34 Steel Charpy Samples Fracture surfaces after impact showing the variation in ductility with testing temperature ( C) C). 34
35 Increasing temperature increases %EL and K c Temperature Ductile-to-Brittle Transition Temperature (DBTT)... FCC metals (e.g., Cu, Ni) Impact Energy Brittle BCC metals (e.g., iron at T < 914 C) polymers More Ductile High strength materials (σ y > E/150) Ductile-to-brittle to transition temperature Temperature 35
36 Fatigue Fatigue testing apparatus for rotating bending test Fatigue is a form of failure that occurs in structures subjected to dynamic stresses over an extended period. Under these conditions it is possible to fail at stress levels considerably lower than tensile or yield strength for a static load. Single largest cause of failure in metals; also affects polymers and ceramics. Common failure in bridges, aircraft and machine components. 36
37 Cyclic Stress - Fatigue Variation of stress with time that accounts for fatigue failures. The stress may be axial (tension- compression), flexural (bending) or torsional (twisting) in nature. There are 3 fluctuating stresstime modes seen in the figure: (a) reversed stress cycle - symmetrical amplitude about a mean zero stress level; (b) repeated stress cycle - asymmetrical maxima and minima relative to the zero stress level; (c) variable (random) stress level l 37
38 Fatigue Fracture surface with crack initiation at top. Surface shows predominantly dull fibrous texture where rapid failure occurred after crack achieved critical size. Fatigue failure 1. Crack initiation 2. Crack propagation 3. Final failure 38


39 Striations are close together indicating low stress, many cycles. Widely spaced striations mean high stress few cycles. Fatigue failure is brittle in nature, even in normally ductile materials; there is very little plastic deformation associated with the failure. The image shows fatigue striations 39 (microscopic).
.")


40 Federal investigators say metal fatigue caused a hole to rip open in the roof of a Southwest Airlines jet as it cruised at 35,000 feet last year (2009). The National Transportation Safety Board says the 14-inch crack developed in a spot where two sheets of aluminum skin were bonded together on the Boeing 737 jet. The pilot made an emergency landing in Charleston, W.Va. There were no injuries among the 126 passengers and five crew members. Two months after the scare, Boeing told all airlines with 737s to conduct repeated inspections of the top of the fuselage near the vertical tail fin. The Federal Aviation Administration has since made those inspections mandatory. Southwest got the plane in 1994 it's much older than the average Southwest jet and had flown it for 50, hours and made 42,500 takeoffs and landings before it sprang a hole in the roof, according to the safety board report. The safety board said it found signs of metal fatigue by magnifying the area in front of the tail fin. In a 3-inch stretch, the crack penetrated completely through the aluminum skin. FAA records showed that eight cracks had been found and repaired in the fuselage during the plane's 14-year checkup.


41 Fatigue Mechanism Crack grows incrementally da dn = ( Δ K ) m ~ ( Δσ) a Failed rotating shaft -- crack grew even though K max < K c -- crack grows faster as typ. 1 to 6 Δσ increases Ad t d f crack gets longer loading freq. increases. increase in crack length per loading cycle Adapted from Fig. 9.28, Callister & Rethwisch 3e. (Fig is from D.J. Wulpi, Understanding How Components Fail, American Society for Metals, Materials Park, OH, 1985.) crack origin 41
42 Crack growth rate 1. Initially, growth rate is small, but increases with increasing crack length. 2. Growth rate increases with applied stress level for a given crack length (a 1 ).
43 S-N Curves A specimen is subjected to stress cycling at a maximum stress amplitude; the number of cycles to failure is determined. This procedure is repeated on other specimens at progressively decreasing stress amplitudes. Data are plotted as stress S versus number N of cycles to failure for all the specimen. Typical S-N behavior: the higher the stress level, the fewer the number of cycles. 43
44 Fatigue Limit For some iron and titanium alloys, the S-N curve becomes horizontal at higher number of cycles N. Essentially it has reached a fatigue limit, and below this stress level the material will not fatigue. The fatigue limit represents the largest value of fluctuating stress that will not cause failure for an infinite number of cycles. 44
45 Fatigue Curves for Polymers 45
46 Surface Treatments During machining operations, small scratches and grooves can be introduced; these can limit the fatigue life. Improving the surface finish by polishing will enhance fatigue life significantly. One of the most effective methods of increasing fatigue performance is by imposing residual compressive stresses within a thin outer surface layer. A surface tensile stress will be offset by the compressive stress. Shot peening (localized plastic deformation) with small (diameters ranging from 0.1 to 1.0 mm), hard particles (shot) are projected at high velocities on to the surface. The resulting deformation induces compressive stresses to a depth of roughly ¼ to ½ of the shot diameter. The influence of shot peening is compared in the graph. 46
47 Improving Fatigue Life 1. Impose a compressive surface stress (to suppress surface cracks from growing) --Method 1: shot peening shot put surface into compression --Method 2: carburizing C-rich gas 2. Remove stress bad better concentrators. bad better 47


 is")
48 Case Hardening Case hardening is a technique where both surface hardness and fatigue life are improved for steel alloys. Both core region and carburized outer case region are seen in image. Knoop microhardness shows case has higher hardness (smaller indent). A carbon or nitrogen rich outer surface layer (case) is introduced by atomic diffusion from the gaseous phase. The case is typically 1mm deep and is harder than the inner core material. 48
49 High Temperature - Creep
 and exposed to static mechanical stresses.")

50 Creep Materials are often placed in service at elevated temperatures (>0.4 T m ) and exposed to static mechanical stresses. Examples are turbine rotors in jet engines and steam generators that experience centrifugal stresses and high pressure steam lines. Creep is time dependent, permanent deformation of the material when subjected to a constant load or stress. 50
51 Creep A typical creep test consists of subjecting a specimen to a constant load or stress while maintaining constant temperature. Upon loading, there is instant elastic deformation. The resulting creep curve consists of 3 regions: primary or transient creep adjusts to the creep level (creep rate may decrease); secondary creepsteady state-constant creep rate, fairly linear region (strain hardening and recovery stage); tertiary creep, there is accelerated rate of strain until rupture (grain boundary separation, internal crack formation, cavities and voids). Creep strain vs time at constant load and constant elevated temperature. Minimum creep rate (steady-state state creep rate), is the slope of the linear segment in the secondary region. Rupture lifetime t r is the total time to rupture.
52 Creep Sample deformation at a constant stress (σ) vs. time σ σε σ,ε 0 t Primary Creep: slope (creep rate) decreases with time. Secondary Creep: steady-state i.e., constant slope. Tertiary Creep: slope (creep rate) increases with time, i.e. acceleration of rate. 52


53 Creep Failure
54 Creep Dependence of creep strain rate on stress; stress versus rupture lifetime for a low carbon-nickel alloy at 3 temperatures.
55 Secondary Creep Strain rate is constant at a given T, σ -- strain hardening is balanced by recovery ε & s = strain rate material const. K 2 σ n stress exponent (material parameter) Q c exp RT applied stress Strain rate 200 Stress (MPa) increases 100 for higher T,, σ activation energy for creep (material parameter) 427 C 538 C 649 C Steady state creep rate (%/1000hr) ε s 55
56 SUMMARY Engineering materials don't reach theoretical strength. Flaws produce stress concentrations that cause premature failure. Sharp corners produce large stress concentrations and premature failure. Failure type depends on T and stress: - for noncyclic σ and T <04T 0.4T m, failure stress decreases with: - increased maximum flaw size, - decreased T, - increased rate of loading. - for cyclic σ: - cycles to fail decreases as Δσ increases. - for higher T (T >04T 0.4T m ): - time to fail decreases as σ or T increases. 56