THREE DIMENSIONAL MICROSTRUCTURAL CHARACTERIZATION OF CATHODE DEGRADATION IN SOFCS USING FOCUSED ION BEAM AND SEM
|
|
|
- Franklin Gray
- 5 years ago
- Views:
Transcription

1 THREE DIMENSIONAL MICROSTRUCTURAL CHARACTERIZATION OF CATHODE DEGRADATION IN SOFCS USING FOCUSED ION BEAM AND SEM Joshua Taillon, Christopher Pellegrinelli, Yilin Huang, Eric Wachsman, and Lourdes Salamanca-Riba University of Maryland, College Park *Supported by DOE-SECA under contract no. DEFE October 2, 2014, 8:30 AM

, 1052 (2009). D. Gostovic, E. Wachsman, et al., J. Am. Ceram. Soc., 94(2), 620 (2011).")
2 Introduction to Solid oxide fuel cells Solid oxide fuel cells (SOFCs) provide a clean, energy-efficient means of energy conversion Low cost, flexible fuels, low emissions, etc. Problems? High operating temperature, and limited durability Cathode polarization losses due to degradation H 2 O, CO 2, Cr vapor all cause losses Adverse effects on polarization, conductivities, and activation Better understanding of the fundamental What is primary cause of these losses? mechanisms behind cathode degradation. Microstructure! Previous work: Quantification in the FIB/SEM: Our task: J. Wilson, S. Barnett, Electrochem. Commun., 11(5), 1052 (2009). D. Gostovic, E. Wachsman, et al., J. Am. Ceram. Soc., 94(2), 620 (2011). Relationship to cell performance: J. Smith, E. Wachsman, et al., Solid State Ionics, 180(1), 90 (2009). Use the FIB/SEM to characterize microstructural changes as cathode degradation occurs, and relate these changes to those in cell performance. Our goal: 2
 Aged at 800 C for ~400 hr under")
3 Experimental - Button cell testing Symmetric cathode cells 8-YSZ electrolyte 50 wt. % LSM/YSZ cathode paste Sintered at 1000ºC for 1hr Button cell Cross-section view Three conditions compared: Baseline ( Unaged ) Aged at 800 C for ~400 hr under ambient ( Aged - dry ) Aged at 800 C for ~400 hrs under 3% H 2 O ( Aged - H 2 O ) 3
4 Data acquisition Our results (and conclusions) can only be so good as our inputs We need good inputs! (GIGO) Important considerations: Initial sample preparation (pre-fib) Sample preparation within the FIB/SEM Slicing resolution (for fidelity of reconstruction) Electron beam parameters - image noise and resolution vs. data acquisition time What is it we need to accentuate? 4

")
: 3) Mounting")
5 Data acquisition pre-fib preparation 1) Vacuum epoxy impregnation: 2) Polishing (to 1200 grit): 3) Mounting for FIB/SEM: 5

6 Equipment/Software FEI Helios 650 Part of the Center for Nanoscale Science and Technology (CNST) user facility at NIST Multichem, ifast Developer Kit, etc. Auto Slice and View version 1.2 Avizo Fire FEI Helios 650 at NIST (CNST) 6


7 Data acquisition Initial procedures Protective Pt and fiducial marks C-trench to prevent shadowing Mill at 0º stage tilt Image at 38º stage tilt Unique FIB/SEM geometry means: Improved contrast between LSM and YSZ Perpendicular imaging Limited detector shadowing effect Increased acquisition time (significant!) 5 min 40 sec, per slice 30 nm slice thickness, 20 μm slice width 7
 Fiducial mill Bulk trenches (65 na) Manually mill imaging fiducial and clean up face before beginning acquisition")
8 Data acquisition Optimized procedures Similar trenching, but in usual orientation ifast recipe developed to fully automate (takes about 1 hour to complete) Pt deposition Thickness tracking mills C deposition (x2 for fiducial) Fiducial mill Bulk trenches (65 na) Manually mill imaging fiducial and clean up face before beginning acquisition 8

9 Data acquisition Optimized procedures Setup and ready to mill in about 1.5 hrs Mostly automated Electron image fiducial for precise image placement Tracking marks for post-run measurement of slice thickness Some shadowing deeper into trench, but much faster acquisition 2 min 30 sec, per slice 20 nm slice thickness, ~ 30 μm slice width Overnight run acquires about 7 μm of depth 9


 Long-dwell")
10 Experimental Electron imaging challenges Challenging system to image due to: Poor RT conductivity Similar electron yields from each phase Careful control of imaging parameters allows for charge contrast imaging Not always completely reliable due to local effects In-lens BSE In-lens SE (Charge neutralization setting) Long-dwell charging contrast (SE) 10
 TLD (through the lens")


11 Experimental Electron imaging (effect of V acc ) TLD (through the lens detector) in backscatter electron mode 2kV 25 pa 625 V 25 pa 5kV 25 pa 1kV 25 pa What contrast is really important? Need to facilitate segmentation! Image frame integration and longer dwell (6 μs) improve contrast between phases 11


12 Experimental post processing of data Post-processing done with Avizo Fire: Non-local means filtering of data 1 : Watershed segmentation algorithm 2 : 1 Based on A. Buades et al. in 2005 IEEE Comput. Soc. Conf. Comput. Vis. Pattern Recognit., Vol. 2, p. 60. IEEE. 2 L. Vincent and P. Soille, IEEE Trans. Pattern Anal. Mach. Intell., 13(6), 583 (1991). 12
: 276.")
13 Results Unaged SOFC Voxel size: 12 x 12 x 30 nm, SE signal collected on FEI Helios 650, NIST HFW: 9.5 µm; Depth: 5.25 µm; Total reconstructed cathode volume (excluding electrolyte): µm 3 13
: 643.")
14 Results Aged, Dry SOFC Voxel size: 10 x 10 x 10 nm, EsB signal collected on Zeiss Crossbeam 540, courtesy of Carl Zeiss and Fibics, Inc. HFW: 9.9 µm; Depth: 8.12 µm; Total reconstructed cathode volume (excluding electrolyte): µm 3 14
: 627.35 µm 3 15")
15 Results Aged, H 2 O SOFC Voxel size: 10 x 10 x 10 nm, EsB signal collected on Zeiss Crossbeam 540, courtesy of Carl Zeiss and Fibics, Inc. HFW: µm; Depth: 3.8 µm; Total reconstructed cathode volume (excluding electrolyte): µm 3 15


16 Results Surface generation YSZ LSM Pore Baseline Aged-dry Aged-H 2 O µm µm µm 3 Bounding box dimensions (µm): X Y Z X Y Z X Y Z 16
 Exp. YSZ Exp. LSM Obs. YSZ Obs. LSM Baseline 0.527 0.473 Aged-dry 0.52 0.48 0.503 0.497 Aged-H2O 0.542 0.")
17 Results Surface quantification Porosity is decreased in both aged samples Additional sintering occurring during aging process Phase solid fractions remain similar to expected values (from source materials) Exp. YSZ Exp. LSM Obs. YSZ Obs. LSM Baseline Aged-dry Aged-H2O
18 Results Graded phase fractions Plotting phase volume fraction as a function of distance from cathode/electrolyte interface Influence of aging on phase distribution Greater variability in aged samples: σ of phase fraction Pore LSM YSZ Unaged Aged-dry Aged-H2O


19 Results Phase connectivity Skeletonization of individual phases reveals connectivity Isolated LSM networks within volume Aged dry Sample Contiguous YSZ and pore networks 19
 Max degree of connectivity Percent of length")

20 Results Phase connectivity How to quantify the connectivity? Average degree of connectivity (< k >) Max degree of connectivity Percent of length connected to contiguous pathway All of these depend on how the skeleton is calculated Two main options within Avizo: Auto skeleton module Centerline tree module Is either really appropriate? Centerline Auto skeleton 20

 Active have two borders")

21 Bulk Electrolyte Triple phase boundary (L TPB ) determination Intersection of three phases is necessary for the oxygen reduction reaction to occur: 1 ORR: O e O 2 This quantity can be directly related to cell performance Within analysis volume, a phase and boundary site can be described as active, inactive, or unknown Labels depend on connection to edges Unknown have at least 1 border with edges (dead-end) Active have two borders across a dimension (transverse) Inactive networks have no intersection with an edge (isolated) Unknown YSZ Inactive Pore LSM Active O 2 e ē - Current collector Collaboration with Scientific Applications and Visualization Group at NIST O 2-21

22 Results Triple phase boundaries To be active, all three connected components of the TPB must be contiguous throughout the volume (which requires a large enough sampling volume to be representative) 22


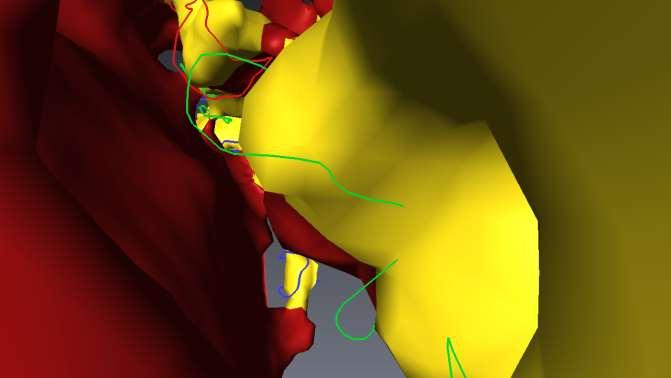

23 Results Triple phase boundaries 23
24 Results Triple phase boundaries * Relative to baseline Baseline Aged-dry H2O Active TPB [norm] 100% 32.5% * 27.5% * Total ρ TPB [µm/µm 3 ] Absolute quantifications are forthcoming, but we can analyze differences between the two samples, which show decrease in all L TPB values upon exposure to H 2 O contamination 24


25 Results Preliminary TEM/EDS work BF-STEM Sr Mn STEM-EDS maps of Baseline SOFC cathode near electrolyte interface Distinct particles of LSM and YSZ Y Zr 25


26 Results Preliminary TEM/EDS work HAADF- STEM La Mn STEM-EDS maps of Aged-dry SOFC cathode near electrolyte interface Still distinct particles of LSM and YSZ Perhaps more Mn distributed throughout YSZ Y Zr 26


27 Results Preliminary TEM/EDS work STEM-EDS maps Aged-H2O SOFC cathode Distinct particles of LSM and YSZ Segregation of La and Mn at YSZ grain boundaries Sr is not localized at boundaries Collected on FEI Titan G ChemiSTEM, courtesy of FEI Company 27
28 Summary Conclusions We have developed and refined methods using both Avizo Fire and external calculations to quantify 3D microstructure of solid oxide fuel cell cathodes At the conditions tested, additional sintering causes changes in phase fractions throughout cathode ρ TPB,active decreases when aged under H 2 O contamination Segregation of La and Mn to YSZ grain boundaries in aged-h 2 O (but not Sr) Upcoming Work Observe sample aged in higher H 2 O concentrations to confirm effects Analyze and quantify composition of segregation products using TEM/EELS Correlate with corresponding EIS data 28


29 Acknowledgements Danijel Gostovic, Nicholas Vito NSF GRFP, Grant No. DGE SECA, Contract No. DEFE Joshua Schumacher John Hagedorn Wesley Griffin Judith Terrill Ken Lagarec, Mike Phaneuf Jessica Riesterer (Hillsboro, OR) 29
30 THANK YOU Questions and comments? 30