LiNi 0.5 Mn 1.5 O 4 porous nanorods as high-rate and long-life cathode for Li-ion batteries
|
|
|
- Sydney Byrd
- 5 years ago
- Views:
Transcription
1 Supporting Information LiNi 0.5 Mn 1.5 O 4 porous nanorods as high-rate and long-life cathode for Li-ion batteries Xiaolong Zhang, Fangyi Cheng, Jingang Yang, Jun Chen* Key Laboratory of Advanced Energy Materials Chemistry (Ministry of Education), College of Chemistry; The Co-Innovation Center of Chemistry and Chemical Engineering of Tianjin, Nankai University, Tianjin , China. * chenabc@nankai.edu.cn Contents 1. Experimental details. 2. Figure S1. (a) XRD pattern and (b) FTIR spectrum of manganese oxalate. 3. Figure S2. XRD pattern of Mn 2 O 3 wires. 4. Figure S3. (a) Adsorption-desorption isotherm and (b) pore size distribution plot of LNMO PNR. 5. Figure S4. (a) XRD pattern, (b) Raman spectrum, and (c) SEM image of bulk LNMO. 6. Figure S5. Charge-discharge curves of LNMO PNR (red line) and LNMO bulk (red line) at 1C (a), 5C (b), and 20C (c) charge-discharge rate. 7. Table S1. Comparison of electrochemical performances between bulk LNMO and LNMO PNR at 1 C and 20 C charge-discharge rates. 1
2 8. Figure S6. FTIR spectra of LNMO PNR electrodes before (black line) and after (red line) charge-discharge. 9. Figure S7. F 1s XPS spectra collected from the LNMO PNR electrode before (a) and after (b) charge-discharge test. 10. Figure S8. Charge-discharge capacity and coulombic efficiency of LNMO PNR under C/5 charge-discharge rate. 11. Figure S9. SEM images of (a,b) LNMO bulk and (c,d) LNMO PNR electrode (a,c) before and (b,d) after charge-discharge cycling. 12. Figure S10. TEM images of (a,b) LNMO bulk and (c,d) LNMO PNR after charge-discharge cycling. 13. Figure S11. XRD patterns of LNMO bulk electrode (black line), LNMO PNR electrode (red line), Al foil (green line). 14. Figure S12. Raman spectra of (a,b) bulk LNMO and (c,d) LNMO PNR (a,c) before and (b,d) after charge-discharge cycling. 2
3 1. Experimental details Materials synthesis. The MnC 2 O 4 wires were synthesized by a confined precipitation reaction in microemulsion. In brief, a quaternary microemulsion was first prepared by dissolving cetyltrimethyl ammonium bromide (CTAB, 4.0 g) in a mixture of cyclohexane (150 ml), n-pentanol (5.0 ml), and oxalic acid aqueous solution (7.5 ml, 0.8 M). After constant stirring for 30 min, Mn(CH 3 COO) 2 aqueous solution (2.5 ml, 0.2 M) was dripped and the resulting microemulsion was vigorously stirred for 2 h at room termperature. The white MnC 2 O 4 precursors were filtered, washed with ethanol, and vaccum-dried. The porous Mn 2 O 3 wires were obtained by thermal decomposition of the MnC 2 O 4 wires at 500 o C for 10 hours. To obtain LNMO nanorods, 12 mmol of Mn 2 O 3 wires, 8.3 mmol Li CH 3 COO 2H 2 O, 4 mmol Ni(CH 3 COO) 2 4H 2 O were dispersed in 10 ml of ethanol. The ethanol was evaporated slowly at room temperature under stirring. The remained solid was ground manually for 10 minutes and the calcined at 700 o C for 6 hours in air. The bulk LNMO was prepared by a simple coprecipitation method. In a typical synthesis route, LiCH 3 COO 2H 2 O, Ni(CH 3 COO) 2 4H 2 O, and Mn(CH 3 COO) 2 4H 2 O in molar ratio of 1.03:0.5:1.5 and in quantities corresponding to 0.9 g LNMO were dissolved in 20 ml of water. The solution was heated to 50 o C and then 3 ml of PEG400 was added. Under constant stirring, 2.0 g H 2 C 2 O 4 2H 2 O was added to the solution, and then heated to 90 o C to evaporate water. The obtained solid was calcined at 900 o C under air atmosphere for 10 h, follow by reannealing at 700 o C for 20 h in 3
4 air to obtain the ordered bulk LNMO. Materials characterization. The structures and morphologies of the as-prepared materials were characterized by powder X-ray diffraction (XRD, Rigaku MiniFlex600, Cu Kα radiation), confocal Raman microscope (DXR, Thermo-Fisher Scientific, 532 nm excitation), field-emission scanning electron microscopy (SEM, JEOL JSM7500F), field-emission transmission electron microscopy (TEM, Philips Tecnai-F20). The composition of the samples was analyzed by energy dispersive X-ray spectroscopy (EDS) and atomic adsorption spectrometry. The XRD pattern was refined using the Rietveld refinement program RIETAN-2000 (Izumi, F.; Ikeda, T. Mater. Sci. Forum 2000, , 198). Surface area analysis was carried out by measuring the N 2 adsorption-desorption isotherms at 77 K on a BELSORP-mini instrument. Electrochemical measurements. Electrochemical test were performed with CR2032 coin-type cell. The cathodes were fabricated by blending the as-prepared LNMO samples, acetylene black, and polyvinylidene fluoride (PVDF) in N-methyl-2-pyrrolidone, with a weight ratio of 75:20:5. The obtained slurry was pasted onto aluminum foil, dried at 100 o C for 8 h in vacuum. The dried electrode were treated with 20 MPa load pressure. The mass loading was about 1.3 mg/cm 2. Lithium metal was used as the anode. The electrolyte was 1.0 M LiPF6 in ethylene carbonate/dimethyl carbonate (EC/DMC, in 1:1 volume ratio) solution. The cathode and anode were assembled into coin cells in an argon-filled glove box (Mikrouna Universal 2440/750). The assembled cells were cycled between V at 4
5 different rates using a LAND-CT2001A battery-testing instrument. Figure S1. (a) XRD pattern and (b) FTIR spectrum of manganese oxalate. Figure S2. XRD pattern of Mn 2 O 3 wires. 5
6 Figure S3. (a) Adsorption-desorption isotherm and (b) pore size distribution plot of LNMO PNR. 6
 XRD")
 Raman")
")

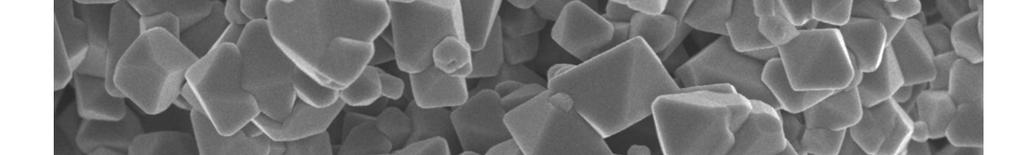
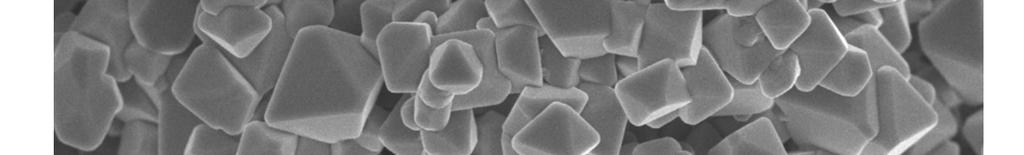

7 Figure S4. (a) XRD pattern, (b) Raman spectrum, and (c) SEM image of bulk LNMO. 7
8 Figure S5. Charge-discharge curves of LNMO PNR (red line) and LNMO bulk (red line) at 1C (a), 5C (b), and 20C (c) charge-discharge rate. V is the voltage separation between the charge and discharge curves at the capacity of 40 mah g -1. 8
9 Table S2. Comparison of electrochemical performances between bulk LNMO and LNMO PNR at 1 C and 20 C charge-discharge rates. 1 C Sample Tap density Specific Volumetric Specific Energy (g cm -3 ) capacity (mah capacity (mah energy (Wh density g -1 ) cm -3 ) kg -1 ) (Wh cm -3 ) Bulk LNMO LNMO PNR C Sample Tap density Specific Volumetric Specific Energy (g cm -3 ) capacity capacity energy density (mah g -1 ) (mah cm -3 ) (Wh kg -1 ) (Wh cm -3 ) Bulk LNMO LNMO PNR Figure S6. FTIR spectra of LNMO PNR electrodes before (black line) and after (red line) charge-discharge. The bands centered at 865 cm -1, 1431 cm -1, and 1508 cm -1 were assigned to the stretching vibrations of C O and C=O in Li 2 CO 3. 9
10 Figure S7. F 1s XPS spectra collected from the LNMO PNR electrode before (a) and after (b) charge-discharge test. Before XPS measurements, the electrode was first thoroughly washed with EC/DEC solution and then vacuum-dried to remove residual LiPF 6. In both the spectra, the peak centered at ev corresponds to the F in PVDF. Notably, an extra peak centered at ev was found in the electrode after charge-discharge test, which can be assigned to F in LiF. Figure S8. Charge-discharge capacity and coulombic efficiency of LNMO PNR under C/5 charge-discharge rate. 10


")
")
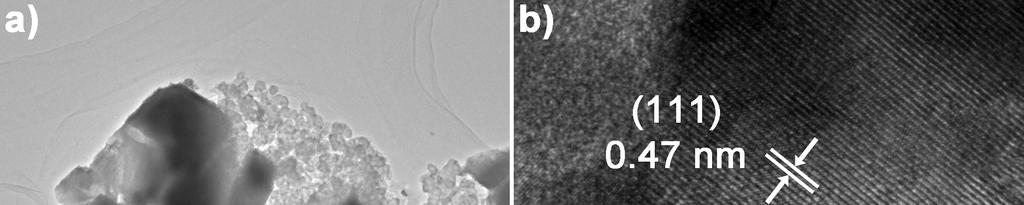
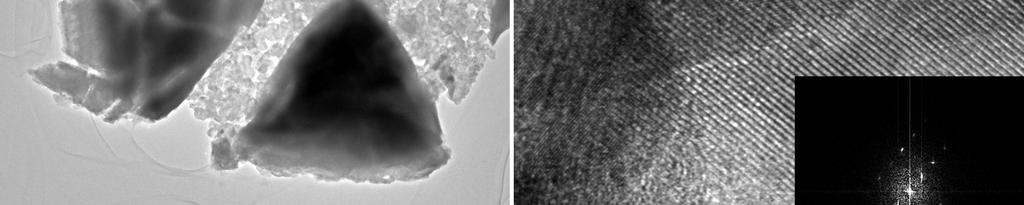
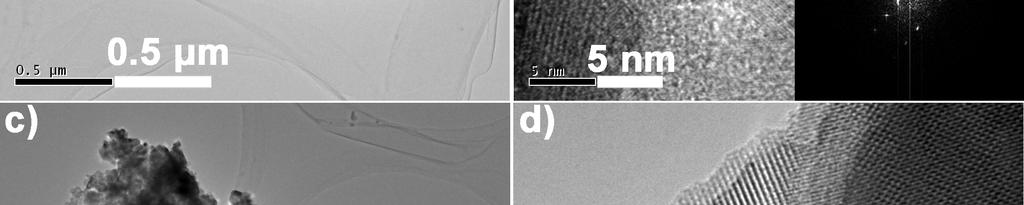
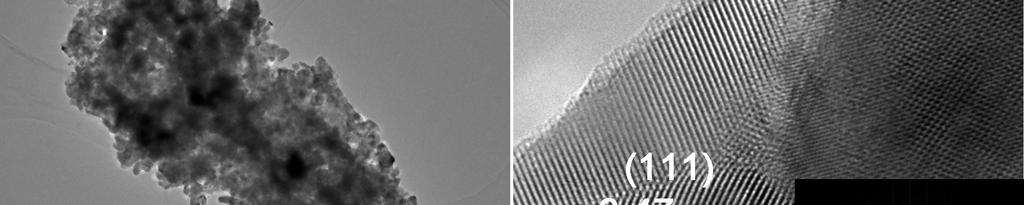
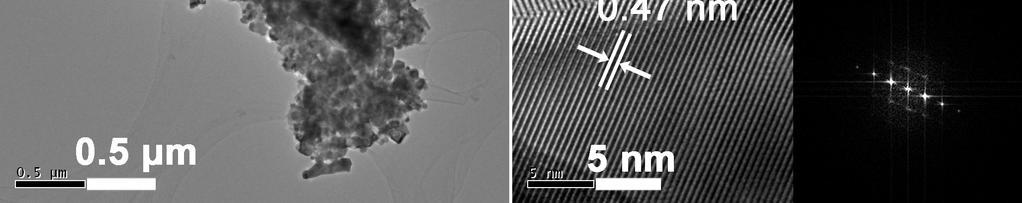
11 Figure S9. SEM images of (a,b) LNMO bulk and (c,d) LNMO PNR electrode (a,c) before and (b,d) after charge-discharge cycling. Figure S10. TEM images of (a,b) LNMO bulk and (c,d) LNMO PNR after charge-discharge cycling. 11
12 Figure S11. XRD patterns of LNMO bulk electrode (black line), LNMO PNR electrode (red line), Al foil (green line). The diffraction patterns of LNMO were labeled. Figure S12. Raman spectra of (a,b) bulk LNMO and (c,d) LNMO PNR (a,c) before and (b,d) after charge-discharge cycling. 12