Lesson 1 Rietveld Refinement and Profex / BGMN
|
|
|
- Philomena Long
- 5 years ago
- Views:
Transcription


1 Lesson 1 Rietveld Refinement and Profex / BGMN Nicola Döbelin RMS Foundation, Bettlach, Switzerland June 13 15, 2018, Bettlach, CH
2 Diffraction Pattern 1000 Diffraction Angle 800 Absolute Intensity Intensity [counts] Relative Intensity 200 Shape Diffraction Angle [ 2 ] 2


3 Diffraction Pattern Diffraction Angle: Phase Identification Relative Intensity: Crystal Structure Determination Absolute Intensity: Phase Quantification Shape: Crystallite Size and Shape, Lattice Strain 3
![Phase Identification «Pattern Features» originate from crystallographic properties Usually sufficient for identification Intensity [counts] 1000 800 600 400 200 0 10 20 30 40 50 60 Diffraction Angle](/docs-images/94/121661023/images/4-0.jpg "[ 2 ] Feature Origin Peak positions - Symmetry of the unit cell (space group) - Dimensions of the unit cell Relative peak intensities - Coordinates of atoms in unit cell - Species of atoms Absolute")
4 Phase Identification «Pattern Features» originate from crystallographic properties Usually sufficient for identification Intensity [counts] Diffraction Angle [ 2 ] Feature Origin Peak positions - Symmetry of the unit cell (space group) - Dimensions of the unit cell Relative peak intensities - Coordinates of atoms in unit cell - Species of atoms Absolute peak intensities - Abundance of phase Peak width - Crystallite size - Stress/Strain in crystal lattice 4

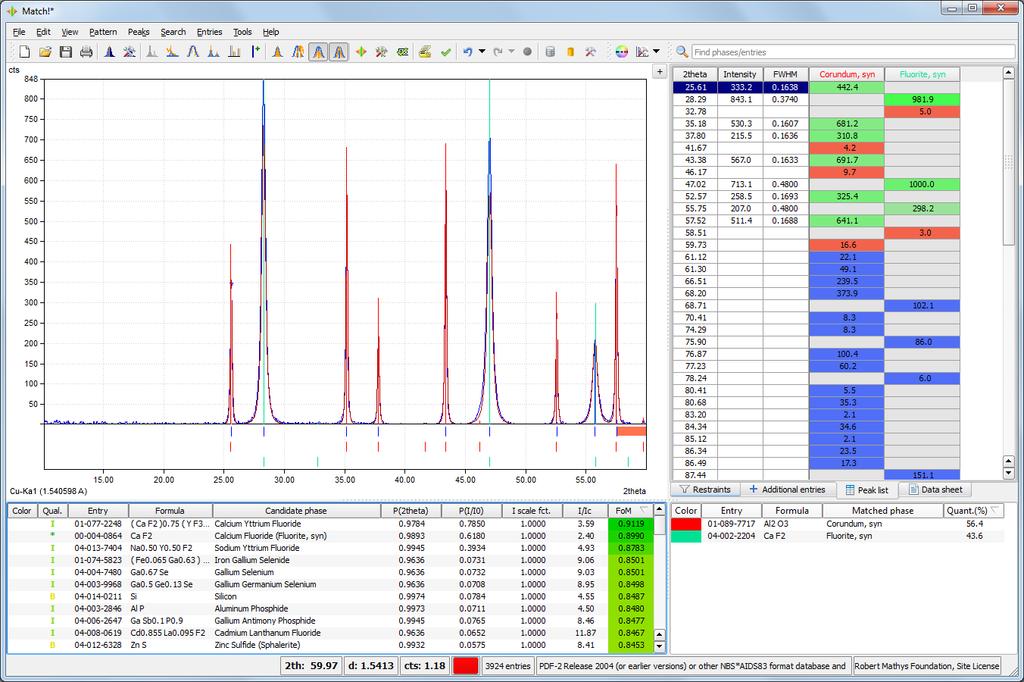
5 Search-Match for Phase Identification 5

6 Rietveld Refinement For more than just identification: Rietveld refinement Extracts much more information from powder XRD data: - Unit cell dimensions - Phase quantities - Crystallite sizes / shapes - Atomic coordinates / Bond lengths - Micro-strain in crystal lattice - Texture effects - Substitutions / Vacancies Prof. Hugo Rietveld No phase identification! Identify your phases first (unknown phase no Rietveld refinement) No structure solution (just structure refinement) Needs excellent data quality! 6
![Rietveld Refinement Known structure model Calculate theoretical diffraction pattern Compare with measured pattern 4000 4000 Intensity [counts] 3000 2000 Intensity [counts] 3000 2000 1000 1000 0 10 20](/docs-images/94/121661023/images/7-0.jpg "30 40 50 60 Diffraction Angle [ 2 ] 0 10 20 30 40 50 60 Diffraction Angle [ 2 ] Optimize structure model, repeat calculation Minimize differences between calculated and observed pattern by")
7 Rietveld Refinement Known structure model Calculate theoretical diffraction pattern Compare with measured pattern Intensity [counts] Intensity [counts] Diffraction Angle [ 2 ] Diffraction Angle [ 2 ] Optimize structure model, repeat calculation Minimize differences between calculated and observed pattern by least-squares method 7
8 Rietveld Refinement Measured Pattern (Iobs) Calculated Pattern (Icalc) Difference (Iobs-Icalc) 3000 Intensity [cts] Diffraction Angle [ 2theta] 8
9 Rietveld Software Packages Academic Software: - Fullprof - GSAS - BGMN - Maud - Brass - many more 1) Commercial Software: - HighScore+ (PANalytical) - Topas (Bruker) - Autoquan (GE) - PDXL (Rigaku) - Jade (MDI) - WinX POW (Stoe) 1) 9

 Wavelength Distribution (*.")

 Peak Parameters (*.")
 Structure Models 1 n")
10 BGMN: Based on Text Files Geometric Instrument Data Refined Parameters (*.geq) (*.lst) Wavelength Distribution (*.lam) Diffraction Pattern Refinement Control File (*.sav) Run BGMN Refined Pattern (*.dia) Peak Parameters (*.xy) (*.par) Structure Models 1 n Refined Structures (*.str) (*.str, *.res, *.fcf, *.pdb ) 10
11 BGMN 11

12 Profex: A Graphical User Interface for BGMN 12
 Rietveld Backends: Website: Current stable version: 3.13.0 BGMN, Fullprof.2k http://profex.doebelin.")
13 Profex: A Graphical User Interface for BGMN Developer: License: Founded in: 2003 Nicola Döbelin (private) GPL v2 or later (open source) Platforms: Windows 7 / 8 / 8.1 / 10 Linux Mac OS X (64bit) Rietveld Backends: Website: Current stable version: BGMN, Fullprof.2k 13

14 Profex Key Features Create and manage refinement projects Convert raw data files for BGMN Export results and graphs Batch refinements Structure and Instrument file repositories + many more 14
15 Fitting Data Fitting experimental data requires an adequate mathematical model f x = 1 σ 2π e x μ 2 2σ 2 f x = a e x t + y 0 15
16 Fitting Data f x = A 1 σ 1 2π e g x = A 2 σ 2 2π e h x = A 3 σ 3 2π e x μ 1 2 2σ 1 2 x μ 2 2 2σ 2 2 x μ 3 2 2σ
17 Fitting Data f x σ 1, A 1, μ 1 ) g x σ 2, A 2, μ 2 ) h x σ 3, A 3, μ 3 ) F x = f x + g x + h(x) 17
18 Fitting Data F x σ 1, A 1, μ 1, σ 2, A 2, μ 2, σ 3, A 3, μ 3 If not all parameters are independent, (for example constant σ): F x σ, A 1, μ 1, A 2, μ 2, A 3, μ 3 18
19 Fitting Diffraction Patterns Fit every single peak to determine: - Position (diffraction angle 2θ) - Integrated intensity (area) - Width 19

20 Fitting Diffraction Patterns - Diffraction angle lattice plane spacing d - Lattice type - Space group - Unit cell dimensions - Intensity Structure factor F hkl - Atomic species - Fractional coordinates - Site occupancies - Thermal vibration - Phase quantity - Width - Crystallite size - Micro-strain 20

21 Fitting Diffraction Patterns Mathematical model for peaks in a XRD pattern needed 21
22 Fitting Diffraction Patterns 2θ = θ =

23 Modelling the Peak Profile Two Gaussian functions Diffraction Angle [ 2 ] Diffraction Angle [ 2 ] 23
24 Modelling the Peak Profile Traditional («Rietveld») Approach: Pseudo-Voigt curves for Kα 1, Kα 2 and Kβ V P x = n L x + (1 n) G(x) Lorentzian Gaussian LORENTZ GAUSS PVN05 PVN025 PVN075 PVN0 PVN10 Lorentzian (ω = 1.0) Gaussian (ω = 1.0) Pseudo-Voigt (n = 0.5) 24
25 Profile functions in FullProf.2k 25
 - Instrument configuration FPA: Simulate peak shape based on instrument geometry")
26 Alternative: Fundamental Parameters Approach (FPA) Origin of peak shape features: 2θ = θ = Wavelength distribution (radiation spectrum) - Instrument configuration FPA: Simulate peak shape based on instrument geometry and wavelength distribution 26
 - Instrument configuration Kα 1 Kα 2 2θ = 2")
27 FPA: Wavelength Contribution Origin of peak shape features: 2θ = θ = Wavelength distribution (radiation spectrum) - Instrument configuration Kα 1 Kα 2 2θ = 2 asin λ 2d Wavelength 27
28 FPA: Wavelength Contribution 2θ = θ = θ = 2 asin λ 2d 0.10 Spacing between CuKa1 and CuKa2 [ 2theta] Spacing between CuKa1 and CuKa2 [ 2theta] Theta [ ] 2Theta [ ] 28
29 FPA: Instrument Contribution Origin of peak shape features: - Wavelength distribution (radiation spectrum) - Instrument configuration Detector window: 29
30 FPA: Instrument Contribution

31 FPA: Instrument Contribution

32 FPA: Sample Contribution The same crystalline phase, same instrument configuration Why different peak shape? Crystallite Size = 560 x 390 nm Crystallite Size = 45 x 20 nm 32
 - Every optical")
33 Fundamental Parameters Approach FPA Observed peak shape = convolution of: - Source emission profile (X-ray wavelength distribution from Tube) - Every optical element in the beam path (position, size, etc.) - Sample contributions (peak broadening due to crystallite size & strain) Tube Device Configuration Sample 33

34 Fundamental Parameters Approach 34

35 Visualize Peak Profiles 35

36 Visualize Peak Profiles 36