Corresponding author.
|
|
|
- Damian Strickland
- 5 years ago
- Views:
Transcription
1 This article has been published in Scripta Materialia. The final publication is available at Elsevier via X-Ray Micro-tomographic Observations of Hot Tear Damage in an Al Mg Commercial Alloy A. B. Phillion 1, S. L. Cockcroft 1 and P. D. Lee 2* 1 Department of Materials Engineering, University of British Columbia, Vancouver V6T1Z4 CA 2 Department of Materials, Imperial College London SW7 2BP, UK Keywords: x-ray computed tomography, hot tearing, high temperature deformation, aluminum alloys, tension test Abstract X-ray micro-tomography and three-dimensional image analysis were used to characterize hot tearing. The formation and interconnectivity of deformation induced damage during hot tearing was quantified in specimens of DC cast aluminum alloy AA5182 (of composition Al-4.63%Mg- 0.49%Mn-0.17%Fe-0.04%Cu) subjected to tensile load at a temperature of 528 C (fraction solid ~0.98) over a range of strains varying from 0 to 0.20 (failure). This technique also allowed for quantification of the porosity formed during DC casting. * Corresponding author. p.d.lee@ic.ac.uk
2 The direct chill (DC) casting process [1] is commonly used to solidify non-ferrous alloys into primary ingots (rectangular cross-section) and billets (circular cross-section). Although this process has been used successfully by industry for many years, certain defects remain technically challenging, such as cold cracks, ingot distortion, and hot tears. Hot tears are commonly encountered during the start-up phase of the casting process and are most prevalent in long freezing range alloys [2]. It appears that these defects both initiate and propagate in regions of the casting that are at temperatures just above the solidus [3] and that are subjected to thermally or mechanically induced stresses acting on material with limited ductility [3, 4]. A number of criteria have been developed to predict the occurrence of hot tears (see review by Eskin et al. [5]). These approaches can be divided into two classifications: those relating to the mechanical aspects of the problem, such as total strain [6]; and those relating to solidification aspects, such as freezing time [7]. Recently, Suyitno et al. [8] evaluated a number of these criteria by implementing them into a FE simulation of the DC billet casting process, and concluded that their predictive ability was qualitative at best. The lack of quantitative correlation suggests that our understanding of the mechanisms of hot tearing is insufficient, and that there is a need for more fundamental experimental studies. While most prior experiments have focused on quantifying the macroscopic aspects of hot tearing behavior (e.g. load as a function of fraction solid [9, 10]), only a few studies have examined hot tearing in-situ. For example, one study focused on an Al-0.5% Cu alloy in which surface cracking was observed in a partially solidified alloy subject to tensile loading [11]. A second study, using a transparent organic analogue [12], identified three different hot tearing initiation mechanisms directly as elongated tears in the intergranular region, on pores caused by solidification shrinkage, and as a restarted hot tear in the region that was earlier considered to be a healed hot tear illustrating the benefits of in-situ observation. This study examines the applicability of x-ray micro-tomography (XMT) for the 3D quantification of damage formed during hot tearing. In the current study, four tensile specimens of commercially DC cast AA5182 were heated to 528 C, corresponding to a fraction solid (fs) of approximately 0.98 [13]. Subsequent to reaching the test temperature, each specimen was loaded in tension to different values of strain as shown in Table 1, using a Mushy Zone Tensile Tester. The crosshead displacement rate was mm/s. Full details of the apparatus are provided in [14]. The key feature of the apparatus is that a parabolic temperature gradient prevails along the specimen, promoting strain localization near the center of the gauge length. X-ray micro-tomographic (XMT) scans using a commercial laboratory scale XMT unit * were performed on an undeformed specimen, and four specimens deformed to strains ranging from 0.02 to 0.2 (see Table 1). Reconstructed images consisting of ~800 x 800 x 400 voxels (each ~9 m), were collected from the deformed region of each specimen. A 1.0 mm thick planar sample was then machined for transmission radiography. Image analysis was performed on the tomographs using VGStudioMax. Fig. 1 shows a scanning electron microscopy (SEM) image of the fracture surface of specimen 4 ( 0.20). The surface has a smooth, glassy-like morphology, which is indicative of some liquid being present during deformation and failure and confirms that the specimen was semisolid during testing. Transmission radiographs of specimens 3 and 4 (Fig. 2) show that the damaged region of each specimen contains a significant void fraction, which was not present in the undeformed * Phoenix x-ray Systems and Services GmbH Volume Graphics GmbH 2
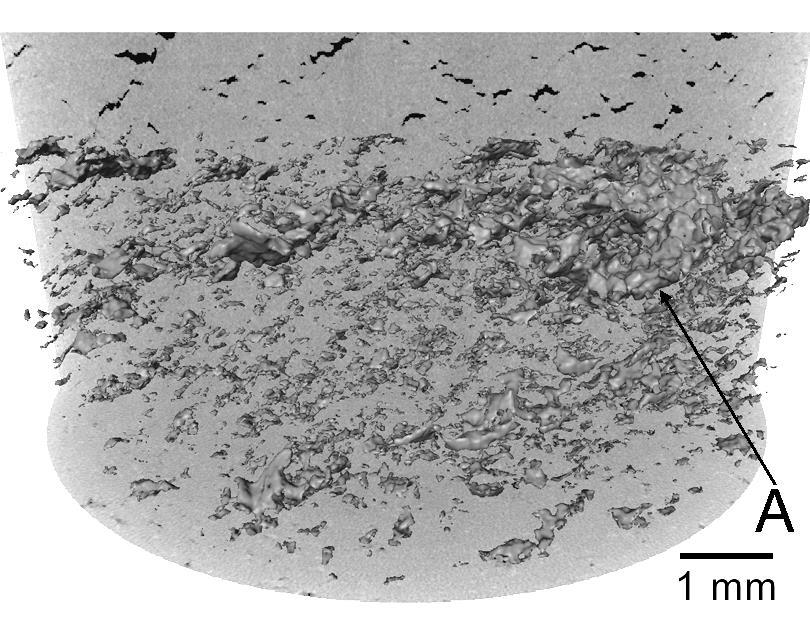
3 specimen. The strain is accumulated both by dimetral reduction and also internal void growth. Previous studies have used the dimetral strain to characterize semi-solid properties [14]. However, the assumption of a fully dense structure during mushy zone testing ignores the internal accumulation of strain. Strain can be more accurately estimated by calculating logarithm of the ratio of the initial cross sectional area to the number of metal voxels in each slice of the reconstructed volumes. Therefore, in this study both the internal and dimetral strains in each of the four tensile specimens were measured (Table 1). At low strains, the dimetral and XMT measurements are similar, with an increasing divergence at high strains due to increased internal damage. The initial void content prior to tensile deformation was ~0.32% ±0.05, as quantified from the XMT data of the undeformed specimen. This corroborates earlier findings, where DC as-cast Al- Mg alloys were found to contain % voids [15] arising from a combination of gas, shrinkage and / or thermo-mechanical loading during cooling. Since it is not possible to differentiate in a single XMT scan between the as-cast void population, and voids formed during subsequent application of strain, the term porosity will be used to refer to the voids that formed during DC casting, and the term damage will refer to voids visible after tensile testing. Further examining the transmission radiograph of specimen 3 ( =0.16) in Fig. 2(a), the central region is highly necked and heavily internally damaged, containing both many small hot tears and a few large ones. These hot tears are oriented normal to the axial (loading) direction, as would be expected in a tensile test. One of the hot tears extends through a large portion of the cross-section of the specimen and it is probable that only a small increment in the strain would have caused this specimen to fracture. It should also be noted that the damage is fully constrained to the center (~5 mm) portion of the radiograph. The damage is localized to this region because of the temperature profile that exists along the length of the specimen during testing i.e. during testing the damaged region is above the solidus temperature (Tsolidus), while the remainder of the sample is below Tsolidus. The tomographs of all five specimens are shown in Fig. 3(a-e). Fig. 3(d) shows the 3D reconstruction of the damaged area of the sample strained to The same area was previously presented in cross-section in the low magnification radiograph shown in Fig. 2(a). In this image, two cross-sectional slices, one parallel to the loading direction, and a second, perpendicular to the loading direction, are displayed behind the isosurfaces. The voids intersecting the surfaces of the planes have been colored black, while in front of these planes the solid AA5182 has been removed. Thus, only the isosurface of the voids appear in the foreground. The loading direction is vertically oriented. This tomograph shows a very large void / hot tear on the right side, having a complex 3D structure with many interconnections, and different branches. On the left side, a few other large voids can also be seen with varying degrees of interconnectivity. There are also many smaller isolated voids distributed throughout the sample. It appears from Figs. 2(a) and 3(c) that the strain in this specimen has been accommodated both by bulk deformation of the material (necking) and also by the formation and growth of a significant internal damage (voids), some of which have coalesced and become interconnected to form hot tears. The radiographs shown in Fig. 2, in conjunction with the tomographs shown in Fig. 3 can be used to gain insight into the development of hot tears. Fig. 2 illustrates that the damage becomes highly interconnected at a strain close to fracture. Any of the medium-sized hot tears visible in both 2(a) and 2(b) could have led to a fracture event. From the tomograph of the unstrained specimen (Fig. 3(a)), it is clear that the initial as-cast porosity is well distributed throughout the specimen and is of roughly uniform size. A comparison of Figs. 3(a) (unstrained) and 3(b) ( = 3
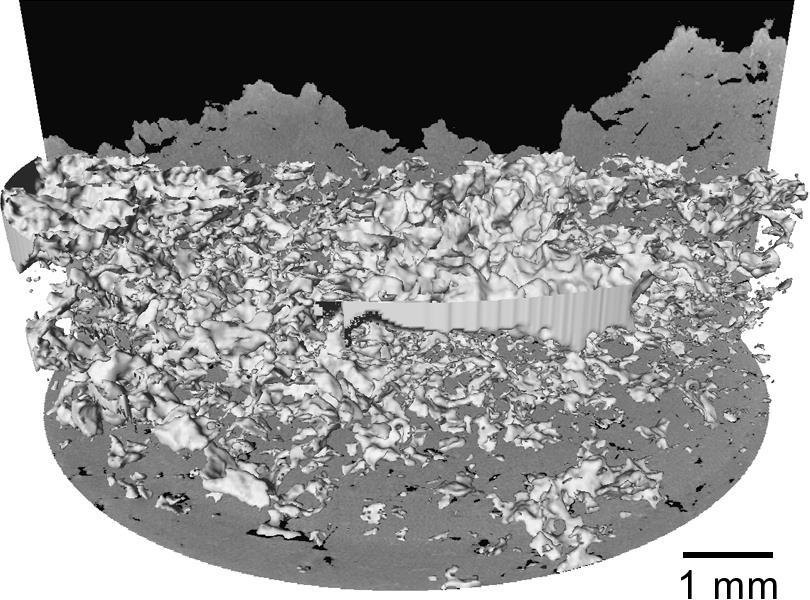
4 0.02) indicates that the internal damage at = 0.02 manifests itself as an increase in the size of the voids, because it appears that the number of large voids at a strain of 0.02 and the total number of voids in the unstrained specimen are similar. There also appears to be nucleation of new voids in Fig 3(b), as shown by the presence of small voids around the large ones. The image appearing in Fig. 3(c), suggests that at a strain of = 0.06 there has been new void formation, void texturing and significant growth and/or coalescence of existing voids leading to several large voids. At a relatively high strain of 0.16 (Fig. 3(d)), the damage has coalesced extensively in one portion of the specimen. Internal damage at the point of final failure is shown in Fig. 3(e) (note: the fracture surface can be seen on the top surface projected against the vertical plane). Qualitatively, it appears that with increasing strain, both the number and size of the damage sites increases. Moreover, the amount of interconnectivity between the various damage sites also increases with strain, leading to void texture and localization. These observations support the notion of nucleation, growth, and coalescence of damage sites in these materials leading to final fracture by hot tearing. The evolution of hot tears is given quantitatively by plotting the distribution of internal hot tear voids at each strain level (Fig. 4) for voids with a radius greater than ~12.5 µm ( 8 voxels), normalized by the volume of material captured in each tomograph, as a function of equivalent void radius. Bearing in mind that the limits of the XMT scan resolution preclude the smaller voids, the distributions appear to have the general form of the right-hand-side of a log normal distribution. It would appear from this plot that during the application of strain, there is a continuous increase in internal damage resulting from both an increase in the number density and also the size of the voids. Most notably, there is a substantial increase in the number of small voids, and an increase in the size of the largest void with increasing strain. It should be pointed out that in the case of the failed specimen ( 0.20), the largest voids most probably became part of the fracture surface and hence would no longer be counted as void. This explains the observed decrease in maximum pore radius as compared with the 0.16 strain specimen. Due to the XMT resolution limits that allow only partial characterization of the void distributions, the comments on nucleation are hypotheses rather than certainty. From Fig. 4, there appears to be a consistent increase in the number of voids at the limit in resolution with increasing strain, which is a combination of the growth of pre-existing small as-cast porosity below the XMT resolution limit, as well as the nucleation of new damage-based voids. There are two possible mechanisms for void growth: 1) void growth proper and 2) coalescence of one or more voids. The increase in the number and size of pores across the full range that can be observed in Fig.4 illustrates that individual void growth is one of the mechanisms by which damage is accumulated, reinforcing the qualitative observations from Fig 3. Similarly, there is strong evidence of coalescence being a key mechanism for void growth at high strains. Perhaps the most convincing evidence of coalescence is the texturing of the pores into long connected voids at a strain of 0.06 observed in Fig. 3(c) and localization at strains greater than this (e.g. Fig. 3(d)). This type of coalescence is frequently observed during fatigue when the crack tip will branch across regions of stress concentration between neighboring voids. It is clear from the analysis of the data that the total amount of damage increases dramatically with strain. Quantification indicates that there is continuous nucleation of small voids coincident with growth of the larger voids. With increasing strain, there is a shift towards increased coalescence and thus a few large voids begin to accommodate the majority of the applied strain. To correlate these observations to hot tearing, it should be noted that the tests were performed at a very high fraction solid (~0.98). The majority of the molten material present at this fraction 4
5 solid is eutectic and is physically located along grain boundaries and within the interdendritic regions as isolated pockets of liquid. Moreover, the same region will also contain most of the ascast hydrogen based porosity [15, 16]. On application of load, both the pores and liquid may act as small cracks and concentrate stress. Given this structure, strain could be accommodated by both growth of the as-cast porosity into the surrounding eutectic liquid and nucleation of new damage-based voids in areas containing large pockets of liquid where the strain concentration is high. From the data presented in Fig 4, it is clear that the number of small voids is continuously increasing at different levels of strain. Thus, if the increase in small voids is due in part to nucleation processes, it would appear that the tensile strain at even small deformations is large enough to cause void nucleation within the structure. It follows that material with fewer tendencies to form shrinkage-based porosity (e.g. short freezing range alloys) and material with a finer grain size (i.e. smaller and more evenly distributed pockets of residual liquid at high fractions solid) would be less prone to hot tearing. It may be postulated that the critical strain to avoid hot tearing is the strain at which significant coalescence of large voids begins. Based on the data presented in Figs. 3 and 4, this would lie between strains of 0.02 and 0.06 under the conditions examined in this study. Concluding, x-ray micro-tomography was used to observe the development of damage and strain during mushy zone tensile loading in aluminum alloy AA5182 specimens at 528 C. The growth of hot tear damage was qualitatively assessed in 2D and 3D and quantitatively characterized in 3D. The results show that in the early stages of loading, strain is accommodated mainly by specimen diameter reduction with only limited internal damage accumulation. At intermediate strains it is accommodated by a combination of as-cast porosity growth and damage-based void nucleation in the residual liquid present in the microstructure. At high strains, void coalescence and continued growth appears to be the main mechanism of damage accumulation and strain accommodation. Acknowledgements The authors would like to acknowledge NSERC, EPSRC (GR/T26344), and Alcan Intl. for financial support, and thank M. Kershaw for assistance with XMT. 5
6 Tables Table 1 Summary of Analysis of XMT Data. Test No. D initial (mm) D final (mm) xmt dimetral ~7.35 ~ * %P = 0.32% *Undeformed specimen Figures Fig. 1. SEM image of specimen 4, showing the presence of liquid at the crack interface. 6

7 Fig. 2. Radiograph images showing the axial extent of damage in specimens 3 and 4, strained to values of: (a) 0.16 and (b) 0.20 (fracture). a) b) 7

 0.02, (c) 0.06, (d) 0.16, and (e) 0.20.")
8 Fig. 3. 3D micro-tomographic reconstruction of the damage and porosity in the specimens strained to values of: (a) as-cast, (b) 0.02, (c) 0.06, (d) 0.16, and (e) A highlights the large hot tear from the radiograph in Fig. 2(a). a) b) 8

9 c) d) e) 9
10 Fig. 4. Void density distribution. References [1] Sengupta J, Cockcroft SL, et al. Metall Mater Trans B 2004;35B:523. [2] Viano D, St.John D, et al. TMS Light Metals San Fransisco, CA 2005:p [3] Campbell J. Castings. Butterworth Heinemann: [4] Ludwig O, Drezet JM, et al. Metall Mater Trans A 2005;36A:1525. [5] Eskin DG, Suyitno, et al. Prog Mater Sci 2004;49:629. [6] Pellini WS. Foundry 1952;125. [7] Clyne TW, Davies GJ. Brit Found 1981;74:65. [8] Suyitno, Kool WH, et al. Metall Mater Trans A 2005;36A:1537. [9] Instone S, St.John DH, et al. Int J Cast Metals Research 2000;12(6):441. [10] Guven YF, Hunt JD. Cast Metals 1988;1:104. [11] Davidson D, Viano D, et al. Shape Casting: John Campbell Symp. San Francisco, CA 2005:p.175. [12] Farup I, Mo A. Metall Mater Trans A 2000;31A:1461. [13] Thompson S, Cockcroft SL, et al. Mater Sci Techn 2004;20(4):497. [14] Colley LJ, Wells MA, et al. Mater Sci Eng A 2004;386(1-2):140. [15] Nagaumi H, Komatsu K, et al. Light Metals Review 1999;6:13. [16] Lee PD, Hunt JD. Acta Mat 1997;45: