Study of SOFC Operational Behavior by Applying Diagnostic Methods
|
|
|
- Rosamund Woods
- 5 years ago
- Views:
Transcription

1 Study of SOFC Operational Behavior by Applying In-Situ Diagnostic Methods Günter Schiller, Wolfgang Bessler, Caroline Willich, K. Andreas Friedrich Deutsches Zentrum für Luft- und Raumfahrt, Institut für Technische Thermodynamik Pfaffenwaldring 38-40, D Stuttgart 2010 Fuel Cell Seminar, October 18 21, 2010, San Antonio, TX, USA


2 Development of Metal Supported Cells (MSC) Characterization of Short Stacks and Stacks (ASC, MSC) SOFC Activities at DLR SOFC Diagnostics SOFC Modeling System Technology Fuel gas Air H 2 H 2 /CO CH 4 interconnect H 2 O CO 2 Cell current, voltage, impedance S 2 S 1 S 3 S 4 R 2 R 1 R 3 R 4 Segment current anode electrolyte U I Z I 1 I 2 I 3 I 4 Detailed 2D model of MEA, channel, interconnector U local Z local N 2 cathode O 2 /N 2 R 6 R 5 R 7 R 8 S 6 S 5 S 7 S 8 Segment voltage, impedance R i Resistor S i Switch, I i Local current interconnect
3 Investigation of Degradation and Cell Failures Insufficient understanding of cell degradation and cell failures in SOFC Extensive experimental experience is not generally available which would allow accurate analysis and improvements Long term experiments are demanding and expensive Only few tools and diagnostic methods available for developers due d to the restrictions of the elevated temperatures
4 Sophisticated (non-traditional) In-situ Diagnostics Electrochemical impedance spectroscopy on stacks Spatially resolved measuring techniques for current, voltage, temperature and gas composition Optical imaging Optical spectroscopy Acoustic emission detection X-ray tomography
5 Outline Introduction Experimental setup for spatially resolved measurements Exemplary results of spatially resolved measurements: MSC cell ASC cell with high fuel utilization ASC cell with reformate as fuel gas Outlook: Optical microscopy and Raman spectroscopy Conclusion
6 Motivation Problems in planar cell technology: Strong local variation of gas composition, temperature, and current density Distribution of electrical and chemical potential dependent on local concentrations This may lead to: Reduced efficiency Thermo mechanical stress Degradation of electrodes Effects are difficult to understand due to the strong interdependence dence of gas composition, electrochemical performance and temperature

7 Measurement Setup for Segmented Cells 16 galvanically isolated segments Local and global i-v i V characteristics Local and global impedance measurements Local temperature measurements Local fuel concentrations Flexible design: substrate-,, anode-, and electrolyte-supported cells Co- and counter-flow


8 Segmented Cells Anode supported cells: Segmented cathode (H.C.Starck/InDEC) Electrolyte supported cells: Segmented cathode and anode

9 Test Rig

10 Power Density and Temperature Distribution of a Plasma Sprayed Cell P und T distribution at standard gas flow rates: 12,5/12,5//80 smlpm/cm² H 2 /N 2 //Air, 800 C, 0.7 V, Air Fuel Air Flow Fuel Flow
11 OCV Voltage Measurement for Determination of Humidity Voltage distribution at standard flow rates: 50% H 2, 50% N 2 + 3% H 2 O, 0.08 SlpM/cm² air fuel gas air Nernst equation: U rev U 0 rev RT ln zf p p H2O O2 p H2 Produced water: S4: 0.61%, S8: 0.72%, S12: 0.78%, S16: 3.30%

12 Power Density Distributution under Conditions of High Fuel Utilization Counter-flow Anode: 33% H 2, 1% H 2 O, 66% N 2 Cathode: air T = 800 C Cell voltage: 0.59 V F u = 80% Lit.: Fuel Cells, 10 (3), (2010)
13 Assessment of Local Performance with Segmented SOFCs Experiment Global behavior Model U I Z 16 segments U local Z local Local behavior Cell can be locally in critical conditions!
14 Variation of Load - Reformate p(i) 100 ma/cm² p(i) 200 ma/cm² p(i) 400 ma/cm² p(i) 435 ma/cm² fu 100 ma/cm² fu 200 ma/cm² fu 400 ma/cm² fu 435 ma/cm² 300,0 250, f u , ,0 power density p [mw/cm²] Power density mw/cm 2 200,0 150,0 100,0 50, ,0 45,0 30, ,0 fuel utilisation fu [%] Fuel utilisation (%) 0,0 Segment 9 Segment 10 Segment 11 Segment 12 Anode supported cell, LSCF cathode, 73,96 cm², gas concentrations (current density equivalent): 54.9% N 2, 16.7% H 2, 16.5% CO, 6,6% CH 4, 2.2% CO 2, 3.2% H 2 O (0.552 A/cm²), 0.02 SlpM/cm² air 0,0
15 Alteration of the Gas Composition at 435 ma/cm² 0,3 H2 CO CH4 CO2 H2O 0,25 Concentration / % Gaskonzentration / % 0,2 0,15 0,1 CO H 2 H 2 O CO 2 0,05 CH Segment 9 Segment 10 Segment 11 Segment 12
16 Alteration of the Gas Composition at 100 ma/cm² 0,3 H2 CO CH4 CO2 H2O 0,25 H 2 Concentration / % Gaskonzentration / % 0,2 0,15 0,1 CO Metallic housing, KS4X anode in Metallischem substrate, active Gehäuse; area Substrat: Anodensubstrat, cm² Anode: 542 aktive µm Zellfläche:73,78 NiO/YSZ, Electrolyte: cm²,a: 542 µm 14 NiO/YSZ, µm YSZ E: 14 + YDC, µm YSZ + YDC, Cathode: 28 µm K: LSCF 28 µm LSCF, Kontaktierung: 30 µm LSP16+Pt3600, Operation Integral, conditions: Gasflüsse: 0, A/cm² Stromdichteäquivalent - Anode = 5.52(54,9% N 2, 16,7% H 2, (54.9% N 16,5% CO, 6,6%CH 4, 2,2%CO 2, 3,2% H 2 0) // 0,08 SlpM/cm² Luft, 2, 16.7% H 2, 16.5% CO, 6.6% CH 4, 2.2% CO 2, 3.2% H 2 O 800 C, 100 ma/cm² 0.08 Nlpm/cm² Air, 800 C) 0,05 H 2 O CO 2 CH Segment 9 Segment 10 Segment 11 Segment 12
17 Potential for Optical Spectroscopies a) In situ microscopy b) In situ Raman laser diagnostics Digital CCD camera Distance microscope (resolution1 µm) Quarz window Imaging spectrograph Heat & radiation shield Lenses/filter 15 cm Transparent flow field SOFC Pulsed Nd:YAG laser (532 nm, 10 ns) Raman spectroscopy Laser Doppler Anemometry (LDA) Particle Image Velocimetry (PIV) Fast-Fourier Fourier Infrared (FTIR) Coherent Anti-Stokes Raman Spectroscopy (CARS) Electronic Speckle Pattern Interferometry (ESPI) Open tube (5 mm)
")
18 Setup for 1D-Raman Spectroscopy 3 double pulse Nd:YAG PIV 400 laser systems λ = 532 nm Repetition rate: 10 Hz Single pulse: E 350 mj / ~7 7 ns Pulse energy: : 6 x 300 mj Pulse length: ~380 ns (temporal resolution)
19 Transparent Flowfield for SOFC Top view Side view
20 Experimental Setup for Raman Spectroscopy Measurements
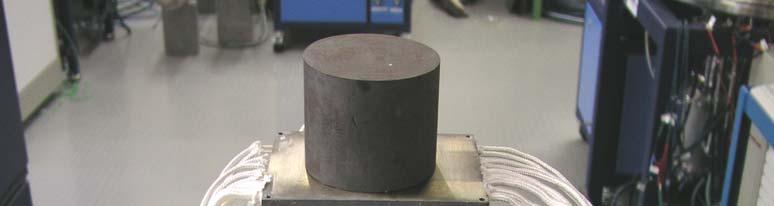
21 Cell Housing with Transparent Flowfield in Hot Furnace
22 Setup for In-Situ Optical Microscopy
23 Conclusion In-situ diagnostic techniques allow for a largely extended insight into fuel cell processes (fundamental understanding, optimization of flow field) The potential of spatially resolved diagnostics was demonstrated with some exemplary results The obtained data can be used for modeling and simulation for identification of critical operating conditions Strong gradients of gas concentrations and current density particularly at operation with high fuel utilization may result in locally critical operating behavior Additional in-situ diagnostic methods such as optical microscopy and gas- phase Raman spectroscopy are currently built up to provide further information for the understanding of cell reactions and processes