Microstructure Evolution in Monocrystalline Silicon duing. Cyclic Microindentations
|
|
|
- Lorin Hubbard
- 5 years ago
- Views:
Transcription
1 Microstructure Evolution in Monocrystalline Silicon duing Cyclic Microindentations I. Zarudi, L. C. Zhang a) School of Aerospace, Mechanical and Mechatronic Engineering, The University of Sydney, NSW 2006, Australia M. V. Swain School of Aerospace, Mechanical and Mechatronic Engineering, Biomaterials Science Research Unit, The University of Sydney, Eveleigh, NSW 1430, Australia This study presents evidence of the microstructural evolution during cyclic indentation with a spherical indenter and thus clarifies the mechanisms of the silicon s behaviour reported in the authors previous paper. 1 It was found that the structure change in the transformation zone features a decomposition of the amorphous phase to R8/BC8 crystals. Outside the zone the cyclic loading gives rise to the bending of pristine silicon, slip penetration and radial cracking. Keywords: Cyclic indentation, silicon, phase transformation, microstructual evolution. 1
2 Indentation has been used extensively to investigate the behavior of monocrystalline silicon, 2-12 as this method permits an insight into the plastic deformation and surface machining mechanisms of this inherently brittle material. It has been shown that the behaviour of silicon in the first indentation is characterised by multiple phase 7, 12, 15 transformations, leading to a substantial hysteresis of the load-displacement curves. Upon loading, the initial diamond structure of silicon changes to a metallic tetragonal β-sn phase, bringing about the first phase transformation. 8 On unloading, the β-sn converts to amorphous or crystalline R8/BC8 phases, depending on the maximum indentation load, P max, 6, 12, 14, 15 and the number of loading/unloading increments. A lower P max and smaller increments would promote the amorphous phase change, but a higher P max and a greater number of the loading/unloading increments would initiate the transformation to the 12, 15, 16 metastable R8/BC8 phases. A unique behavior of silicon was identified in multiple indentations with a Berkovich indenter. 10, 11 The load-displacement curve showed non-degenerative hysteresis under low indentation loads. When the load was high, however, the hysteresis disappeared in the second as a result of cracking in the subsurface. It was suggested 17 that the indentation with Berkovich indenter produces amorphous transformation and endorses a non-degenerative hysteresis. Nevertheless, the hysteresis would disappear when the R8/BC8 phases emerged. Very recently, the authors 1 reported that silicon behaves differently under the cyclic indentations with a spherical indenter. It was shown that the transformed structure developed in the first indentation was unstable and could be altered by a number of indentation variables, such as the maximum indentation load P max. However, the details of the structural 2
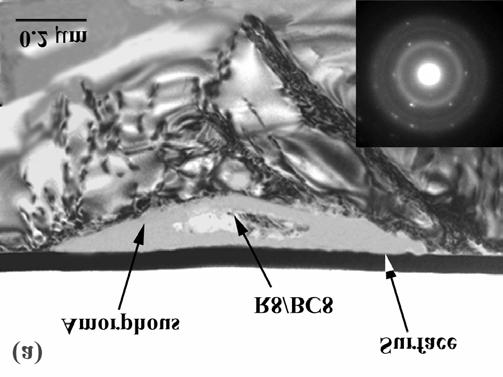
3 evolution corresponding to the cyclic indentations were unclear. The present study aims to clarify the mechanisms. The test material was a monocrystalline silicon (100) wafer. The spherical indenter used had a nominal radius of 5µm. The indentation tests were conducted on an Ultra-Micro Indentation System-2000 (UMIS). To capture the effect of the magnitude of the indentation load, three sets of maximum loads, P max = 30 mn, 50 mn and 90 mn, were applied, respectively. Fifty tests were performed for every P max. In each of an indentation, thirty steps were set on both the loading and unloading paths with an average loading/unloading rate of 0.6 mn/s. To make a thermal drift correction, a holding time of 30 seconds was used at the maximum load. To characterize the stress-induced structures, TEM studies were perform in a Philips CM12 transmission electron microscope, operating at 120 kv. TEM specimens were prepared along <110> cross-section. 12 At the final stage of the specimen preparation ion-beam thinning was used to achieve a sufficiently thin area for TEM. Figure 1 shows the diffraction contrast images, demonstrating the morphology and microstructure of the transformation zone after the first indentation when subjected to different magnitudes of P max. In each transformation zone, the corresponding diffraction patterns were inserted to indicate the degree of crystallinity. It is clear that at P max = 30 mn the zone is mainly occupied by an amorphous phase with a limited amount of crystalline particles (15-25%) in its central part (Fig.1a). This is in very good agreement with the theoretical predictions. 18, 19 The diffraction pattern (insert in Fig.1a) indicates that both the strong rings, which correspond to the amorphous phase, and the weak sports, which indicate the R8/BC8 phases, exist. The slip lines emanate from the bottom of the transformation zone, reaching a depth of 0.5 µm below the zone. 3
4 The area occupied by the transformed crystalline region expanded when P max increases. For example, at P max = 50 mn this region occupies between 50-70% of the whole transformation zone (Fig.1b). The diffraction pattern ( insert in Fig.1b) now shows strong spots corresponding to crystalline particles with much weaker amorphous rings. Outside the zone, both the number and length of the slip lines increase, with the maximum penetration to 1 µm under the transformation zone. The increase of P max to 90 mn almost entirely eliminated the amorphous phase (Fig.1c). The diffraction pattern attached shows that the crystalline phase R8/BC8 occupies the majority of the transformation zone. Slip lines extend further to the depth of 1.4 µm under the transformation zone. Median cracks were also initiated, emanating from the intersections of the slip lines. The above-mentioned structures were altered significantly after five indentation s (Fig.2). With P max = 30 mn, the amorphous phase disappeared, replaced by the R8/BC8 structure occupying the whole zone (Fig.2a). No amorphous rings were observed in the diffraction pattern, confirming its crystalline composition. This clearly shows that the decomposition of the amorphous region to the crystalline R8/BC8 phases occurs during the cyclic indentations. The material structure exterior to the zone contains additional deformation of the pristine silicon presented by extensive bending contours and some slip lines penetrated to 0.9 µm. It is interesting to note that the size of the transformation zone did not really change upon the cyclic indentations. At a higher P max, e.g. 50 mn, the above decomposition mechanism was also confirmed. Slip lines now extended to 2.5 µm under the transformation zone (Fig.2b). Again, 4
5 the size of the transformation zone remained almost the same as observed with the first. At the largest P max in this study, i.e. 90 mn, the transformation zone became completely crystalline after 5 indentation s, without a noticeable dimensional change (Fig.2c). Radial cracking occurred but slip line extension did not develop significantly as expected. It seems that the appearance of the radial and median cracks might have arrested the further propagation of the slip lines. The structural changes in silicon explored above must influence its mechanical behavior during the indentation s. This becomes clear when the load-displacement curves reported by the authors recently 1 are recalled. For convenience of the discussion below, these curves are shown again in Fig.3. As discussed above, at P max = 30 mn, a major structural change took place during cyclic unloading, leading to the amorphous to crystalline transformation in 75-85% of theoriginally β-sn transformation zone at maximum load. It is therefore reasonable to conclude that it was the transformation during the cyclic loading that introduced the gradual change in the shape of the load-displacement curves. The steady evolution of the microstructure also brought about the change of the effective Young s modulus from 137 GPa to 139 GPa 1. At P max = 50 mn, the greater presence of the R8/BC8 after the initial resulted in a smaller part of the transformation zone (30-50%) undergoing the amorphous to crystalline transformation during further s. Thus, less change in load-displacement curves occurred. The transformation process was also completed in fewer s. The development of the slip lines outside the transformation zone is not surprising, as the stress field in the consecutive 5
6 indentations gradually altered by the growth of the crystalline R8/BC8 particles and their differing density inside the transformation zone, leading to the additional deformation of the pristine silicon. At P max = 90 mn, the phase transformation from amorphous to R8/BC8 happened mainly in the second of loading, because only a little amount of the amorphous phase was found after the first indentation. The minor deviations of the load-displacement curves after the second may be partly caused by the development of the cracks (see Fig.2c). The decomposition of the amorphous phase in cyclic indentations is an interesting phenomenon, which indicates the unstable nature of the phases formed in the first indentation. The amorphous transformation does not occur in a diamond anvil cell that generates a pure hydrostatic stress field, suggesting that the deviatoric stress components in indentation play an important role in the initiation of the amorphous phase. Also, it is interesting to note that the crystalline phase on indentation grows with the number of loadingunloading s. This suggests that the R8/BC8 phase needs time to develop. In other words, the onset and growth of the crystalline phase requires an incubation period. In contrast, the amorphous phase emerges at fast unloading rates because of the instability of the β-sn phase with decrease of pressure and insufficient time for nucleation and growth of the R8/BC8 phases. This is in fact very similar to the classical time-temperature-transformation behaviour of materials such as the decomposition in steels when cooling occurs at different rates 20. By applying a cyclic temperature field to the unstable phases in steel (e.g. annealing of martensite), a more stable phase (e.g. ferrite) can be achieved. In indentation, the mechanism is controlled by the stress-field. The cyclic application of the stress field transfers the relatively unstable amorphous phase to the more stable crystalline R8/BC8 phase. 6
7 In summary, this study identifies the structural transformations of monocrystalline silicon during cyclic indentations. It shows that the amorphous phase formed after the first indentation at a low P max can be decomposed to the crystalline R8/BC8 phase during the consecutive repeated indentations. The amorphous-to-crystalline decomposition plays a major role in the evolution of the load-displacement curves. Outside the transformation zone, the deformation of the pristine silicon is mainly due to the extension of slip lines. In addition, the size of the phase transformation zone remains almost unchanged during successive cyclic loading. The authors wish to thank the Australian Research Council (ARC) for continuing support of this project and the Electron Microscope Unit of Sydney University for use of its facilities. 7
8 References 1 2 I. Zarudi, L. C. Zhang and M. V. Swain, Applied Physics Letters (under review). L. C. Zhang and I. Zarudi, International Journal of Mechanical Science 43, 1985 (2001). 3 J. E. Bradby, J. S. Williams, M. V. Wong-Leung, M. V. Swain and P. Manroe, Applied Physics Letters 77, 3749 (2000). 4 5 W. C. D. Cheong and L. C. Zhang, Nanotechnology 11, 173 (2000). D. R. Clarke, M. C. Kroll, P. D. Kirchner and R. F. Cook, Physical Review Letters 60, 2156 (1988). 6 7 V. Domnich, Y. G. Gogotsi and S. N. Dub, Applied Physics Letters 76, 2214 (2000). Y. G. Gogotsi, V. Domnich and S. N. Dub, Journal of Materials Research 15, 871 (2000). 8 I. V. Gridneva, Y. V. Milman and V. I. Trefilov, Physical Status Solidi 14, 177 (1972) A. B. Mann and J. B. Pethica, Langmuir 12, 4583 (1996). G. M. Pharr, W. C. Oliver and D. R. Clarke, Scripta Metallurgica 23, 1949 (1989). G. M. Pharr, W. C. Oliver and D. R. Clarke, Journal of Electronic Materials 19, 881 (1990) I. Zarudi and L. C. Zhang, Tribology International 32, 701 (1999). L. C. Zhang and H. Tanaka, JSME International Journal, Series A: Solid Mechanics & Material Engineering 14, 546 (1999). 14 L. C. Zhang and I. Zarudi, Key Engineering Materials , 121 (2000). 8
9 15 J. E. Bradby, J. S. Williams, M. V. Wong-Leung, M. V. Swain and P. Munroe, Journal of Materials Research 16, 1500 (2001). 16 A. Mujica, S. Radescu, A. Munoz and R. J. Needs, Physical Status Solidi B 223, 379 (2001). 17 V. Domnich, Y. G. Gogotsi and M. Trenary, Materials Research Society Symposium 649, Q8.9.1 (2001). 18 T. Vodenitcharova and L. C. Zhang, International Journal of Solids and Structures (2002 under review). 19 T. Vodenitcharova, L. C. Zhang and T. X. Yu, Key Engineering Materials , 621 (2003). 20 R. A. Higgins, Engineering Metallurgy (Edward Arnold, London, 1993). 9
10 Footnote a) Corresponding author. 10
11 Figure captions Fig.1 Microstructure of the transformation zone in silicon after the first of indentation beneath a nominally 5 µm radius indenter: (a) P max = 30mN, (b) P max = 50mN, (c) P max = 90 mn. Fig.2 Microstructure of the transformation zone after the fifth of indentation: (a) P max = 30mN, (b) P max = 50mN, (c) P max = 90 mn. Fig.3 Load-displacement curves in the five indentation s with various maximum loads 1 : (a) P max = 30mN, (b) P max = 50mN, (c) P max = 90 mn. 11


12 12


13 Fig.1 13
14 Fig (a) Fifth Fourth Third Second First 30 Load, mn pop-in Load, mn Fifth Displacement, nm Displacement, nm 60 (b) Fifth Fourth Third Second First 50 Load, mn pop-out (c) Displacement, nm Fifth Fourth Third Second First Load, mn pop-out Displacement, nm Fig.3 14
15 15