i Series Thermal Analysis Systems
|
|
|
- Violet Maxwell
- 5 years ago
- Views:
Transcription


1 i Series Thermal Analysis Systems


2 i Series Thermal Analysis Systems STA i Series TGA i Series DSC i Series The I Series instruments are a completely new designed series of Thermal Analysers. Since the temperature control and accuracy is extremely important in Thermal Analysis the focus was to have the best possible performance in the heater control. A 22 bit A/D converter makes sure that reliable and accurate information are feed back to the control circuit. The fuzzy logic heater control circuit makes sure that at any time the correct temperatures are maintained during isothermal segments and controlled heating. The high resolution A/D converter provides real time module y axis signals to the computer without smoothing. A software package was developed to guarantee easy operation and easy data analysis. InfinityPro makes sure one sets up experiments by mouse click, changes gases as a function of the temperature profile and even you can edit a running temperature profile by adding segments or changing parameters when an experiment is already running. This provides the highest possible flexibility for the experiment parameters. In a real Windows environment you can run DSC, TGA and STA simultaneously on one computer, analyze and print the results of your data analysis and transfer them to other applications as a picture or as an ascii format. All the mentioned features are available for all the modules of the I-Series. The philosophy is: No compromises, all features for the Series, one idea, one realization.

3 Infinity Pro Software Infinity Pro standard features Real time colour display of data collection Auto and Manual Scaling Time versus temperature profiles First and second derivative plots Peak temperature determination Analysis save features Background data collection Built in Help manual Individual Segment display Copy to clipboard Multiple curve overlay ASCII export Data Smoothing Baseline File subtraction Y-axis Shift operation Subfile operations Custom display configuration Replot versus time or temperature Multiple point calibrations Infinity Pro Analysis features DSC/DTA Peak integration Fused peak analysis onset and peak temperature determination 2 or 6 point Glass transition analysis DSC crystallinity Baseline slope correction TGA 2 or 6 point Weight loss analysis Step weight loss analysis Weigh loss onset Residue calculation STA Includes all DSC and TGA Analysis features 2 3


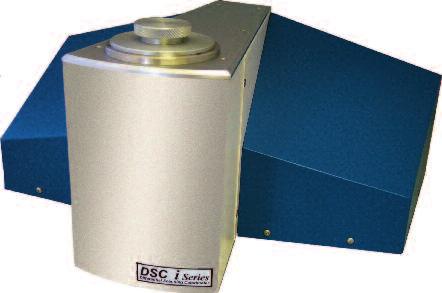
4 DSC i Series DSC I Series feature with the unique and rigid cell design. This guaranties stable baselines and due to the small heat resistance between furnace and sample and reference measurement points best possible resolution. The advantage of the heat flux DSC is no requirement of a baseline subtraction. By this easily the typical DSC applications can be performed as there are: Melting temperatures, Degree of Crystallinity, Crystallisation temperatures of polymers, pharmaceuticals, paints etc. Multiple choices of cooling options: Cooling Can As a simple tool to cool down the cell after a measurement, it allows to start measurements at temperatures as low as -170 C. Of course controlled cooling is possible with limitations. Water cooling circulator This cooling system provides a cold liquid flow around the DSC cell and the heater is working against the coolant power. This enables the temperature range from -20 to 400 C and therefore allows the most polymer applications with controlled heating and cooling rates. LNCA (Liquid nitrogen cooling accessory) This is technically the best possible solution to cover the widest temperature range from -150 to 725 C. It allows heating and cooling in the widest temperature range. The gas cooling flow is controlled to provide the best possible performance. Measurement Principle: This heat flux DSC measures the temperature difference between the sample and the reference platform. With the known thermal resistance furnace, sample- and reference platform, the heat flow into or out of the sample is proportional to the temperature difference. The real sample temperature is measured by the Sample thermocouple which is in direct thermal contact with the sample. This specially designed heat flux DSC provides the following advantages: Unsurpassed stable baselines Excellent signal to noise ration High resolution
5 Cel ,5Cel 80.5Cel 84.1Cel -46,3Cel -40,0Cel -17,5Cel ,4Cel -1,2Cel Cel mJ/mg -37.6mJ/mg 103,6Cel mJ/mg ,4Cel 220mJ/mg Cel mJ/mg 134,2Cel 163,9Cel ,0 250,0 200,0 150,0 100,0 50,0 0,0-50,0-100,0 Applications: Measurement of PET Polyethylene is a semi crystalline polymer. The events which are clearly visible are glass transition, cold crystallisation and the melting of the crystalline phase. By calculation the peak areas of cold crystallisation and the melting area the degree of crystallisation can be calculated. This provides important information about the optical and mechanical properties of the sample. DSC mw DDSC mw/min Measurement of a block co-polymer The curve shows the measurement of a Polypropylene with very small amounts of Polyethylene and rubbery phases. One sees three transitions: The melting of the main component, the PP, a small transition at 118 C, caused by the PE and the glass transitions of the rubbery phases in the low temperature range. DSC mw -2,00-4,00-6,00-8,00-10,00-12,00-14,00-16,00-18,00-20,00-22,00-24,00-26,00-28,00 300,0 250,0 200,0 150,0 100,0 50,0 0,0 DDSC mw/min -30,00-50,0-32,00-34,00-100,0-80,0-60,0-40,0-20,0 0,0 20,0 40,0 60,0 80,0 100,0 120,0 140,0 160,0 180,0 Measurement of high density polyethylene The most crystalline polymers have very well defined melting temperatures and melting enthalpies. With those parameters, a polymer can be identified. The curve shows the overlay of HDPE and LDPE. DSC mw/mg 0,500 0,000-0,500-1,000-1,500-2,000-2,500-3,000 LDPE HDPE DDSC mw/min -3,500-4,000-4,500-5,000-5,500 40,0 50,0 60,0 70,0 80,0 90,0 100,0 110,0 120,0 130,0 140,0 150,0 160,0 DSC i Series Specifications: Temperature Range: -150 to 725 C Temperature Accuracy: 0.1 C Temperature Precision: 0.1 C DSC Noise: 0.5 µw Heat Flux Plate Material: Chromel or Constantan Sample and Reference Type Thermocouples Type K Furnace Thermocouple: Type K Dual PID Control Yes Temperature Segments each 1 ramp, 1 isothermal 10 Program Rates: 0.1 to 200 C/min. 4 5


 signal.")
6 TGA i Series As a vertical system this features all the advantages of such a system. It provides extremely baseline stability and reproducibility. The physically caused drift is automatically compensated by an internal calibration, which can be stored and called up depending on the heating rates. This provides extremely easy handling and easy loading of samples, The starting weight is always the correct one independent of the sample position. Fast Cooling The water flow abound the furnace guaranties great heating performance in the low temperature range and fast cooling after the end of a measurement. Controlled Atmosphere The system is gas and vacuum tight. This enables the user to have a controlled atmosphere in the sample chamber and the coupling with EGA. A specially designed interface sucks the effluents directly to the EGA method what could be MS or FTIR. TGA Measurement principle The principle is electromagnetic compensation. By the zero detector and the balance coil, the balance is always kept in the same position. The current through the coil is proportional to the weight on the sample side and via calibration read out as TGA (mass) signal. Before measuring the empty container is tared with the help of counter balance weights added to the reference pan. This makes sure the full measurement range is available for the correct and accurate measurement of the sample. Gas Switching Of course a gas switching unit to change he atmosphere in the reaction chamber is available, Up to four gases can be switched controlled by the temperature program.
7 ,0-10,0-20,0-30,0-40,0-50,0-60,0-70,0-80,0-90,0-100,0 50,0 100,0 150, ,0 250, % 300,0 Air , Cel -20.2% 46.0% ,0 450,0 Nitrogen 500, ,0 600, Cel -63.8% ,0 36.5% 700, ,0 Hardware Features Very easy to operate 24 Bit USB Interface Motor driven furnace Easy sample loading Water cooled furnace Build in auto tare function Fast sample turn around Corrosion resistant system Options Automatic gas switching accessory Step Iso Software Heated transfer line and controllers Multi module operation Evolved gas analysis option Computer systems Applications: Measurement of Rubbers The TGA gives a quick and reliable analysis of the composition of rubber mixtures. Up to 300 C the plasticisers evaporate, up to 600 C, the weight loss is caused by the polymer degradation. After switching from nitrogen to air in the reaction chamber, the carbon black burns. TG % Thermal and Oxidative Stability To determine the oxidative or thermal stability, the sample is measured in oxygen or nitrogen atmosphere. The measurement shows the overlay of two measurements of the same sample (Nylon 6) in different atmospheres. One can clearly see the different degradation temperatures and the different weight loss profile. TG % Specifications Model TGA 1000 TGA 1500 Temperature Range: 0 to 1000 C 0 to 1500 C Programmed Heating Rates: C/min. 0.1 to 60 C/min. Cooling Time (1000 C to 20 C) Less than 10 minutes Less than 10 minutes Temperature Segments each 1 ramp, 1 isothermal Weight Range: ± 200 mg ± 200 mg TG Resolution: 0.1 µg 0.1 µg Thermocouple: Type K Type R 6 7


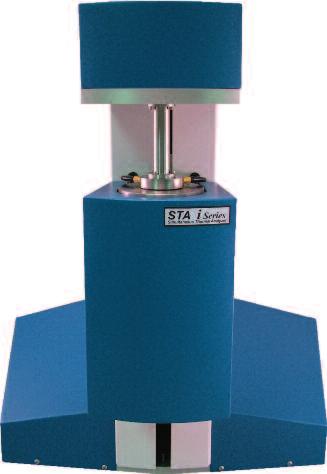
8 STA i Series We are proud to introduce our next generation high performance Simultaneous Thermal Analyzer, the I Series STA. With a 0.1 µg balance resolution, advanced control algorithms and cutting edge design, the I Series offers previously unavailable value in a high performance instrument. The highly sensitive heat flux plate provides accurate and reproducible heat flow data along with simultaneous weight measurement during the entire experiment. The instrument is ideally suited for evolved gas analysis, with its low purge gas flow and excellent sample environment. Real TG/DSC senor system The specially designed heat flux plate is located in the small environmental chamber. This guaranties stable DSC and TGA baselines. The small environmental chamber provides inert atmosphere without evacuation and a quick gas exchanges after a gas switching. One Furnace for each application The STA is available in three temperature ranges: -125 to 650 C, RT to 1000 C and RT to 1500 C. The two high temperature furnaces are as a standard equipped with water cooling for precise temperature control and quick cooling after measurement end. DSC sensor plate Multiple choices of cooling options The low temperature furnace can be cooled with a water cooling circulator or with liquid nitrogen for the low temperature range (-125 ). This allows the user to choose the best options for his application


9 Measurement Principle: As the TGA the balance works with the principle of magnetic compensation. The DSC heat flux plate is connected to the balance with a solid hangdown system. The thermocouple compensation wires for direct temperature reading and the DSC heat flow signal are directly connected to this hangdown via very thin wires for no balance interference. Hardware Features Simultaneous measurement of DSC and TGA Heat flux DSc plate Very easy to operate 24 Bit USB Interface Motor driven furnace Easy sample loading Water cooled furnace Build in auto tare function Fast sample turn around Corrosion resistant system Options Automatic gas switching accessory Step Iso Software Heated transfer line and controllers Multi module operation Evolved gas analysis option Computer systems Specifications Model I Series 650 I Series 1200 I Series 1500 Temperature Range: C Ambient to 1200 C Ambient to 1500 C Programmed Rates: 0.1 to 100 C/min. 0.1 to 40 C/min 0.1 to 40 C/min DSC Sensitivity: <1µW <4µW <4µW TGA Range: 400 mg 400 mg 400 mg TGA readability: 0.1 µg 0.1 µg 0.1 µg Thermocouple Type K Type R Type R DSC/DTA Mode: Yes Yes Yes 8 9
10 ,000 6,000 5,000 4,000 3,000 2,000 1,000 0,000-1,000-2, , ,5Cel 17,32% ,0 94.8Cel 12.3% 212.9Cel ,9Cel % ,64% ,0 536 C % Cel Temp C 213,3Cel 200, Cel 19.0% 800 7,11% , Cel C , Cel % 350, ,00-5,00-10,00-15,00-20,00-25,00-30,00-35,00-40,00-45,00-50,00-55,00-60,00-65,00-70,00-75,00 Applications: STA Measurement of Nylon 6 This measurement clearly shows the advantages of simultaneous measurements. Between ambient and 120 C the weight loss is water can be observed. In the DSC signal this is an endothermic reaction. The cold crystallisation and the melting of the crystalline phases are only seen in the DSC signal and can accurately be analysed. DSC mw TG % Measurement of Calcium Oxalate The measurement shows three weight losses: Water, CO and CO2. As one can see the second weight loss is combined with an exothermic reaction. This is due to the atmosphere. The sample was measured in air. Therefore the CO burns to CO2. As a summary the measurement shows that this simultaneous measurement even provides information about the atmosphere and allows easier interpretation of the TGA profile. DSC mw TG % Measurement of Kaolinite Between 400 and 700 C a weight loss of about 12 % occurs. At the same time an endothermic reaction is seen in the DSC sigmal. Both events are caused by the dehydration process. The phase transition at 1014 C is the generation of mullite an important material in the porcelain DSC mw TG % Measurement of Cupper sulphate pent hydrate This measurement was performed at the low heating rate of 1 C/min to detect the different dehydration processes. Those are clearly seen as well in the TGA as in the DSC signal. DSC mw TG %


11 Our Partners: Our Business: Thermal Analysis Dynamic and Static Contact Angle Surface Tension Water Purification Systems Technical and Analytical Balances Application Support Technical Service Seminars 10 11
12 Thermal Analysis & Surface Solution Pfingstweide Friedberg - Germany info@thass.net