Tablet formulation design spaces for direct compression and roller compaction. QbD in Pharmaceutical Development: processes
|
|
|
- Baldwin Rodger Fleming
- 5 years ago
- Views:
Transcription
1 QbD in Pharmaceutical Development: Tablet formulation design spaces for direct compression and roller compaction processes Morten Allesø, PhD (MSc Pharm) Pharmaceutical scientist ISPE Nordic PAT CoP, June 1 st 2011 KU-LIFE, Copenhagen
2 2 Outline 1. Introduction to tablet formulations and challenges (CQAs, excipients, CU and dissolution) 2. Overview of processes and unit operations chosing the most cost effective manufacturing 3. What is a standard formulation? 4. Direct compression 1. Composition 2. Dose homogeneity and theoretical considerations (incl. comparison to practice) 3. NIR blend data 4. Design space construction 5. Conclusion and perspectives (more DC form. implementation i development through decisionmaking trees) 5. Roller compaction (dry granulation) 1. Introduction to roller compaction 2. Critical quality attributes of ribbons and the granule (porosity, fines and API in fines) 3. Ranking of critical process variables 4. Design space of ribbon and granule properties 5. Future work 6. Concluding remarks
3 3 Tablet formulations and manufacturing...
4 4 Common tablet compositions Active ingredient (API) Filler(s) (+binder) Lubricant Other (not shown) Low dose (0.5% API) Intermediate dose (10% API) High dose (20% API) Very high dose (50% API)
5 5 Tablet process technologies Wet Granulation Direct Compression Roller Compaction Wet granulation high shear mixer Dry sieving Dry sieving Wet sieving Mixing of API with excipients Mixing of API with excipients Drying in fluid bed Tablet compression Roller compaction Dry sieving Mixing granule with lubricant Mixing granulate with excipients Tablet compression Tablet compression
6 6 Low dose (0.5% API) Challenge: Dose homogeneity Particle size of API is critical! API particle size control and the blending step are very critical Usually well suited for direct compression and roller compaction Intermediate dose (10% API) High dose (20% API) Very high dose (50% API) Challenge: Making the tablet stick Requires good compression properties of API! Dry processing methods usually not applicable
7 7 Rational selection of process technology Example: IR-tablet, 3 strengths, 10, 20 and 30 mg Dose proportional formulation Parameter Wet Direct Roller Granulation Compression Compaction Unit operations, no Scale up complex simple simple QbD complex simple simple API- PSD criticality lower higher lower API supply until scale-up to production, kg Production cycle time, index Typical production throughput, kg/h Preferred (if applicable)
8 8 The standard formulation concept...
9 What is a standard formulation? Standard formulation (SF): A formulation template applied to new (and suitable) HLu APIs. Thorough and structured documentation is available for each standard formulation, describing the relationship between critical formulation- and process variables and one or several critical quality attributes Design space Advantages of a SF: In-depth knowledge of the formulation is already available, i.e. developability well-known. Reduction of workload of a development project (efficiency) A standard formulation is a platform technology (in-house term) 9
10 10 Design space definition Multi-factorial, DoE Design space: ICH Q8: The multidimensional combination and interaction of input variables (e.g., material attributes) and process parameters that have been demonstrated to provide assurance of quality. Working within the design space is not considered as a change Unit operations Critical process parameters (CPP) The formulation, raw materials Critical quality attributes (CQA) -related to specifications A prerequisite for the construction of a design space is DoE! (implementing a control strategy usually requires PAT)
11 11 Critical Quality Attributes of the final tablets Blending time and lubrication bleding time (established based on preliminary experiments) -(CPP- Critical Process Parameter) Tableting properties Compactibility and compressibility Adhesion to punches Tablet technical properties Hardness > 50 N Friability < 0.5% Disintegration time < 5 min. Content uniformity (RSD) 4% (CQA) Segregation properties (e.g. fluidization) (CQA) Dissolution? Stability? API dependent (molecular properties)!
12 12 Direct compression formulation...
 disintegrant: Croscarmellose sodium Cross-bound carboxymetylcellulose Low conc.")
13 13 Choice of excipients - previous knowledge / literature Filler: Microcrystalline cellulose Compatible with many APIs Plastic deforming material (excellent compactibility) Multi-functional: Disintegrant+binder Relatively good flowability (Super) disintegrant: Croscarmellose sodium Cross-bound carboxymetylcellulose Low conc. required Effective disintegration agent May be incompatible w/ API (ionin interaction) Lubricant: Mg-stearate Most effective (anti-adhesive effect) Disrupts internal tablet bondings (affects dissolution/disintegration) May be incompatible w/ API
14 14 Formulation compositions and PSD of API s (escitalopram) API (1, 11 and 20% w/w) Avicel PH102 (d 50 = 122 µm, d 90 /d 50 = 2.0) 3% Ac-di-sol (croscarmellose sodium) 1% or 2% Mg-stearate (2% at 20% API) API of qualities D 50 =42 µm, 67 µm, 114 µm and 163 µm (laser diffraction) API d 10, µm d 50, µm d 90,µm d 50 /d 10 d 90 /d

 by a quadratic polynomial (model) in order to: Understand")
.")


15 15 Central Composite Face (CCF) design µm m API quality was added to the design without compromising the design quality The aim with the designed experiment is to approximate the response (CU-rsd) by a quadratic polynomial (model) in order to: Understand in more detail how factors: particle size and drug load influence the response; i.e. get a map of the system (response surface modelling). Make predictions and find a region of operability. Thus, the design will also investigate for any interaction effects and non-linearities in the dataset. Analyze 2 tablets for content for every 2000th produced (100 min tableting) Calculate RSD over tableting = Dose homogeneity


16 16 Blending evaluation by NIR-SentroPat SentroPAT NIR spectrometer (Sentronic GmbH, Dresden, Germany)
17 17 Theoretical optimal dose homogeneity (Srel = CU%) S A, rel %= 100 P B ( P w + P w ) B P W A a A b w π a = v i d 6 ρ i i 3 P A/B : relative content of API and Avicel PH102, respect. (P A +P B =1) w a : mean weight (based on volume weigthed volume mean diameter) of a single particle of API and Avicel PH102, respectively, calculated from the volume size distribution (laser diffraction) Assumes free flowing non-interacting binary mixtures! In this case: ρ API ρ Avicel PH102 (reduces risk of segregation)
18 Theoretical optimal dose homogeneity versus experimental mg tablet mg mg 20 tablet Actual Theoretical Actual Theoretical Content RSD (%) Content RSD (%) mg tablet 42** Actual Theoretical Adhesion to punches! ** Content RSD (%)
19 19 Constructing the design space: Multiple Linear Regression (MLR) The data from the statistical experimental design can be fitted by means of multiple linear regression (MLR) and the response, y, can be described by a polynomial function: CU RSD = b 1 k 1 + b 2 k 2 + interaction terms + constant


20 Design space visualization based on MLR API, % of tablet 20 API
21 21 Conclusions for DC standard formulation based on Avicel PH102 Theoretical calculation on optimal dose homogeneity correlates well with the actual values as a very valuable tool for prediction of the effect of API-PSD on CU% for the final tablets based on DC A design space was established base on CFF design showing the effect of API on dose homegeneity in the dose range of 1-20% API. Below API-PSD of d 50 < approx. 40 µm adhesion to punches occur for 20% API even at 2% Mg-stearate External lubrication Avicel PH102 is an effective filler/disintegrant providing excellent compactibility and compressibility and tablet disintegration times < 20 sec with 3% superdisintegrant Ac-Di-Sol. Ac-Di-Sol might be excluded (to be investigated) Segregation due to fluidization is reduced when the API-PSD and dose is reduced (due to increased cohesion between particles)
22 22 On going work on DC standard formulations The use of using external lubrication with in-process spraying of magnesium stearate to eliminate potential incompatibility between Mg-stearate and API. Alternative fillers than MCC is investigated. Formulation screening has shown the best candidates to be: Flowlac 100 (lactose) and Parteck M200 (mannitol). A binder is needed to improve compactibility of the final blend.
23 23 Roller compaction formulation...
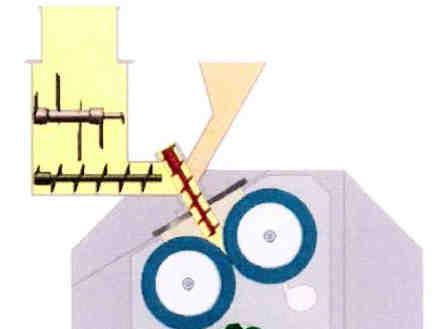


24 24 Roller compaction
25 25 Why do dry granulation Advantages: Improve flowability Improve weight uniformity Improve content uniformity (possibly) Minimize segregation (possibly) CQAs (granulate): Ribbon porosity (work hardening) Work hardening (tabletability) No. of fines Bimodal / unimodal? Distribution of API in sieve fractions Determines impact of segregation on tablet content uniformity CPPs (RC): Compaction force Gap size Roll speed (mostly up-scaling) Sieve size (tablet dose uniformity)
26 26 Ranking of critical process parameters (CPPs) Critical Quality Attribute (CQA) Process / formulation parameter Ribbon porosity Fines fraction (< 125 µm) API-% in fines fraction Compaction force (kn) HIGH INTERMEDIATE UNKNOWN Gap size (mm) INTERMEDIATE UNKNOWN UNKNOWN Roll speed (rpm) LOW LOW (upon decrease in roll speed) UNKNOWN Roll width (cm) NONE NONE NONE Granulator angle ( ) NONE LOW UNKNOWN Granulator speed (rpm) NONE NONE NONE Screen type NONE HIGH UNKNOWN Screen size NONE INTERMEDIATE INTERMEDIATE
27 27 CQA specifications of intermediate product Ribbon porosity [35 ; 40%] % relative content of API in fines fractions shall be minimized ( 45%) Fines fraction shall be minimized ( 30%) Porosity determination: Assessed by oil-intrusion method (in-house) Several other methods were initially compared Fines fraction of granulate: Determined by sieve analysis Relative API content in fines fraction: Determined by UV spectrophotometry Calculated as % of total dose recovered in a given granule fraction NOTE: API particle size (d 5o fixed at 65 µm)!
28 28 Central composite face design 3 factors Drug load (% w/w) Compaction force (kn) Gap size (mm) 2 center points Load (%) Comp. force (kn) Gap (mm) (CP) (CP) 6 3
29 Results from roller compaction trials Load (%) Comp. force (kn) Gap (mm) Throughp ut (kg/hr) Elastic recovery (mm) dgw (µm) Porosity-% Fines-% API-RSD in Rel. API content (%) Throughput Oil < 71 µm < 125 µm sieve frac. (%) < 71 µm < 125 µm
30 30 Design space construction (PLS modeling) R2 Q2 Model Validity Reproducibility TP-porosity Oil-Porosity <71um <125um dgw~ API71 API125 Weight fraction Rel. API content of tot. dose
31 31 Effects of CPPs on ribbon/granule properties
32 32 Model equation: Ribbon porosity Oil-Porosity Load Comp. force Gap
33 33 Model equation: Fines fraction (% < 125 µm) <125um Load Comp. force
34 34 Model equation: API in granulate fraction (< 125 µm) API Load Comp. force
35 35 Optimal process settings: Hitting the sweet spot Sweet spot plot showing the operating region (design space) for each drug load. A red star indicates the operating conditions used in upcoming verification batches.
36 36 RC: Conclusions and future work CQAs could be well modeled against drug load and CPPs: compaction force and gap size. Next step: Verification of sweet spot settings in a new experimental series (on-going; larger scale) preliminary results show good reproducibility for porosity and mostly for fines fraction, however, new challenges are now encountered: Sampling related issues when measuring fines (sample divider) Tableting step: Adhesion to punches further decrease amount of fines in the granulate (varying the sieve size of the granulator) Finally: Design space descibing relationship between API load and API particle size (similar as for DC and using verified sweet spot settings for the RC step)
37 37 Concluding remarks...
38 38 A SF needs to be continuously modified and refined! Results/data and finally information is useless unless used as part of a structured framework (QbD). So far there are 13 experimental plans and reports behind the SF work! Decision-making tool in Development: Integrate SF results as flowcharts and in risk assessment templates (on-going). Good advice: Don t underestimate the usefulness of old data and previous studies. Seek information and decrease the experimental work load markedly (less complex DoEs).
39 39 Thank you... Questions?