Jr data for 3 x 1013 cm - 2
|
|
|
- Audra Carroll
- 5 years ago
- Views:
Transcription

1
2
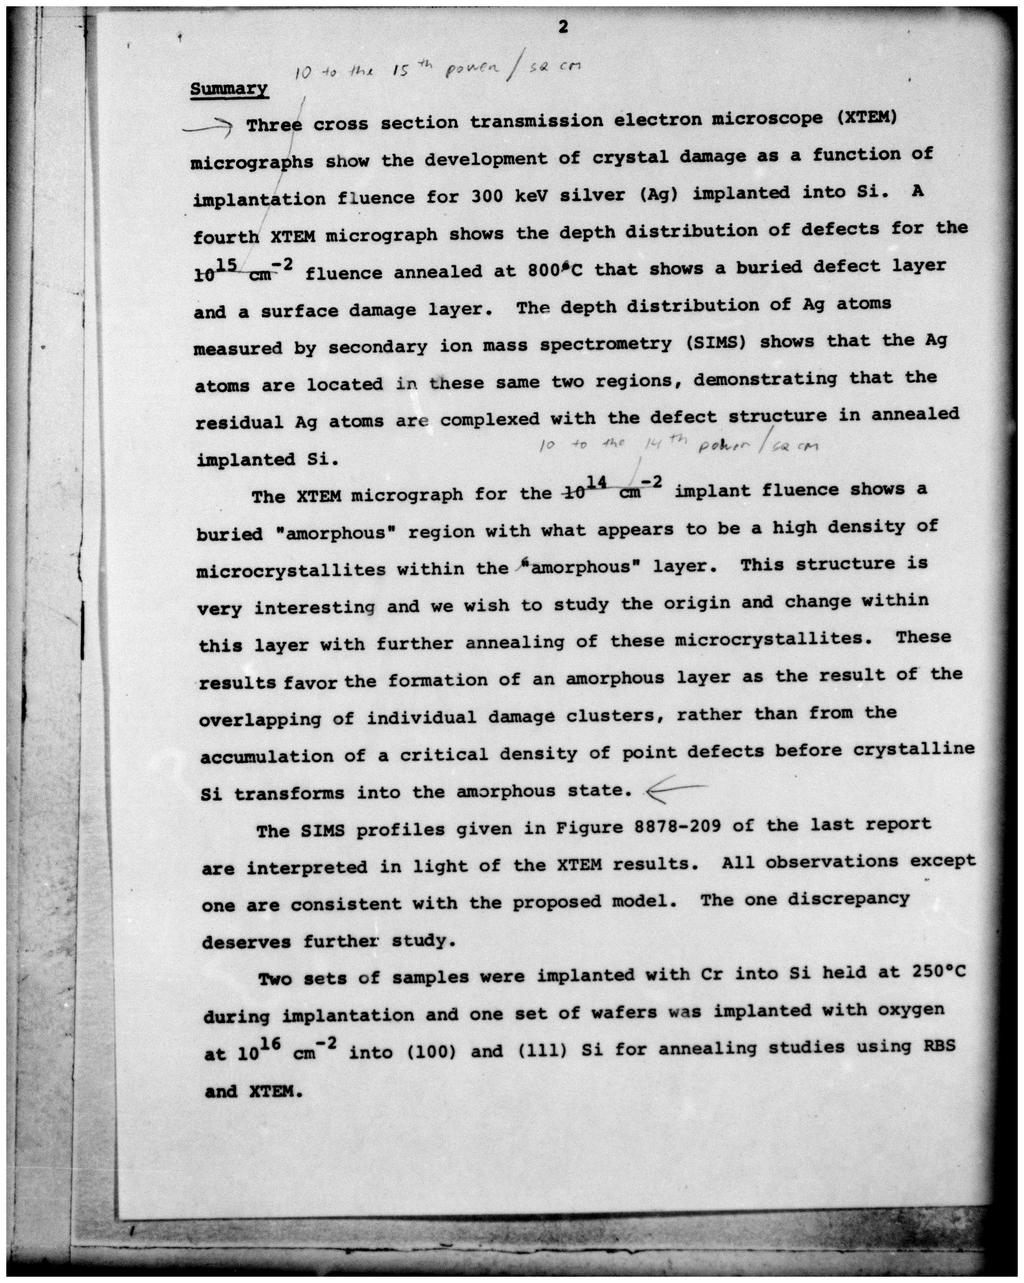
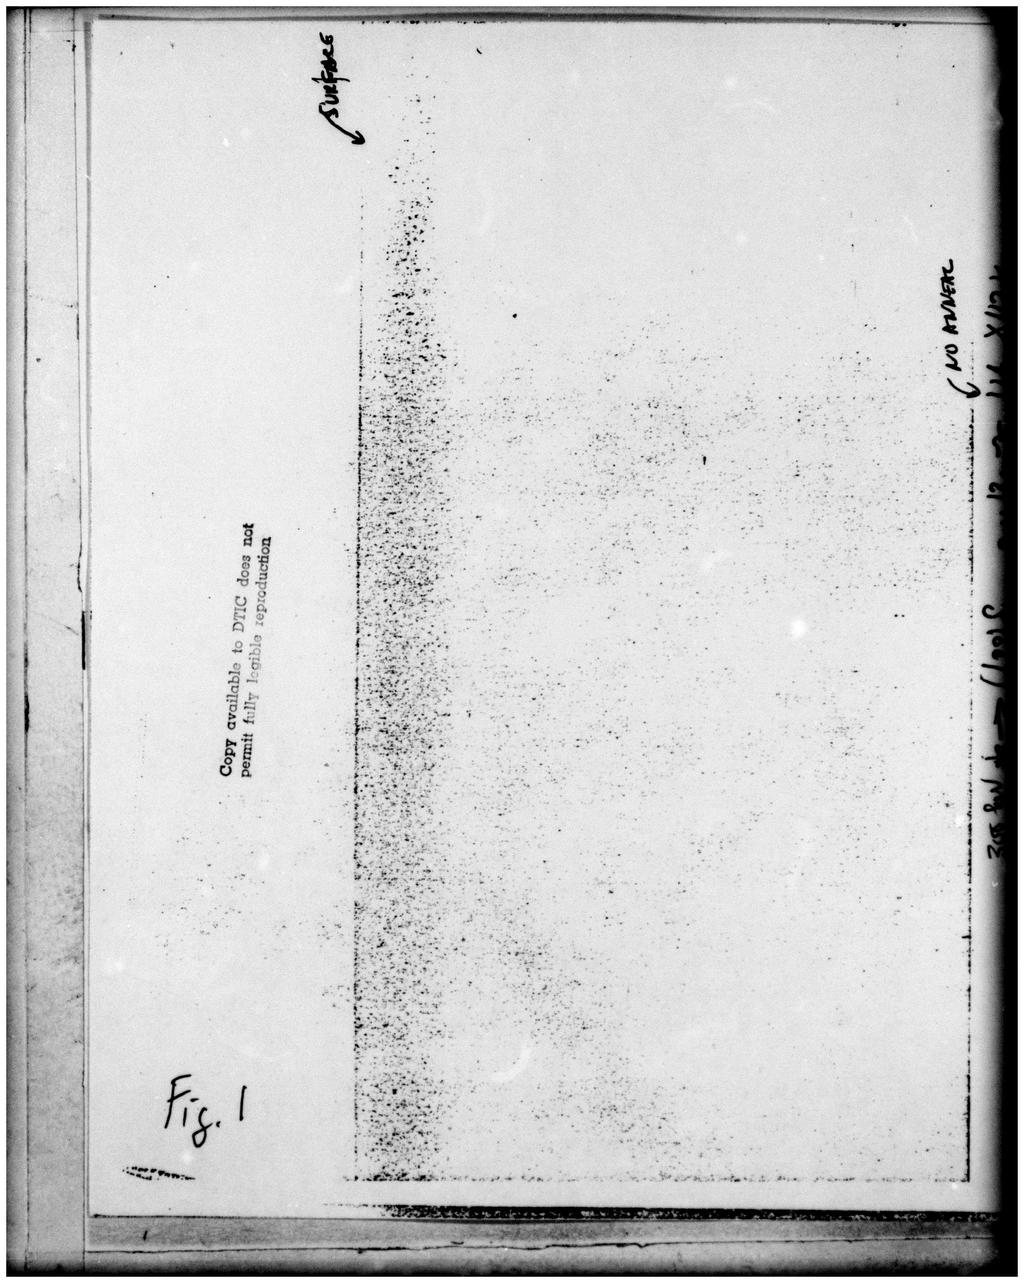
3 Jr 3 Progress on two publications is described. Problem Areas A great deal of time is being required to get RBS and XTEM samples prepared and measurements made on busy equipment. Therefore results are slow in coming. Funds remain for both RBS and XTEM efforts and a no cost time extension to 30 June 1982 has helped, but will probably not allow us to complete all of the planned work, interpretations, and publications. A possible additional time extension to 30 December 1982 is anticipated to allow another task to be added and that time would also be helpful for completing more satisfactorily the planned work. XTEM Results Figures 1 through 3 show XTEM micrographs for 300 kev Ag implanted in (100) Si before annealing. Figure 1 is for a fluence of 3 x cm ; Figure 2 is for cm-2; and Figure 3 is for 10 cm - 2 The data for 3 x 1013 cm - 2 (Fig. 1) show a damaged but not amorphous graded layer as would be expected for a low fluence implant. The data for 1014 cm - 2 are discussed in the next section. The data for 1015 i -2 cm (Fig. 3) show a broad amorphous layer extending from the surface to a substantial depth. The XTEM micrograph of Fig. 4 is for a 300 kev, 1015 cm - 2 Ag implant into Si and annealed at C. This micrograph corresponds directly to the SIMS profile of Ag shown in Fig. 7 ( R1) of the last report. The XTEM micrograph shows a buried layer of damage at " 0.25 Um and a heavy concentration of defects near the surface. * The corresponding SIMS data show Ag atoms at the same - 0, 0, 0 +. " m 9I-
4
5
6 idi 7,77
7 IsI IcI t44 CA. -. *~( b Me
8 4 Discussion of the 1014 cm - 2 Buried Amorphous Layer Implnt:1 0x 114 c-2 Implant: 1.0 x 10 cm, 300 key Ag, (100) Si, No Anneal. Resulting Structure: Interpretation: a buried amorphous layer. XTEM Results and The damage structure observed by XTEM for these conditions is complex and interesting. The XTEM micrograph shown in Figure 2 has structure within the buried amorphous layer region that we believe comprises microcrystallites; however, this conclusion needs to be confirmed by further experiments. The observation of such structure within the buried amorphous layer raises important questions: How does the crystalline Si transform into amorphous Si? What are the critical parameters? For example, does the amorphous layer form as a result of the overlapping of individual damage clusters (small amorphous regions), or is there a critical density of point defects that is required before crystalline Si transforms into the amorphous j state? The micrograph of Figure 2 tends to support the first possibility, however further work is clearly needed to answer these questions definitively. The next experiment that we wish to perform in this direction is to study the growth of the amorphous Si and the microcrystallites within the amorphous region at a selected area. We will determine whether the crystallites increase or decrease in size and what happens to the roughness of the amorphous/crystalline Si interfaces (as a function of annealing temperature). Interpretation of the SIMS profiles of Fig given in the last report and shown here as Figs. 5 and 6. Implants: various fluences at 300 kev, (100) Si, annealed at 5504C for 20 min Interpretation based on XTEM measurements of the depth distributions of defects:

9
10 3,x LMINNELFU././;. N~$ A 34(o KT&&c /(CD-ff' vi t ~4;9ieI&Ko Lo~(f#
11 1~ 5 3 x 10 M fluence: The dose in this case was probably too small to create a buried amorphous region. Rather, it created isolated damage clusters (Figure 6a) in the vicinity of R. These clusters annealed out at the 5500C annealing temperature. Consequently, Ag did not see any discrete defect-rich regions where it could segregate. Diffusion was also minimized because of the low annealing temperature used. 1 x 1014 cm fluence: oahere the dose used was probably high enough to cause the - -mation of a buried amorphous layer. Subsequent annealing of this typ, 1i structure produces two discrete layers of damage as already ob d (see the attached article by Sadana et al.) and is shown schematically in Figure 6b. The shoulder near the surface in the Ag profile is believed to correspond to the vacancy-rich region and the two peaks occur in the vicinity of the two damage layers. 3 x 1014 cm - 2 fluence: The dose of Ag used here probably produced a continuous amorphous I layer that extends to the surface of the sample (Figure 6c). In this * type of damage configuration there is only one amorphous/crystalline interface available for regrowth. Comparing the regrowth rate results from this sample with that of the 1014 cm- 2 sample at the deeper interface indicates that the regrowth is retarded in the 3 x 1014 cm7 2 sample. The flat region of the profile represents the width of the amorphous layer. A small peak in the deeper region is typical of most implantation and probably correspond to a narrow layer of damage clusters at this depth.
12 6 1 x 1015 cm - 2 fluence: In this case also, the initial damage structure is a continuous amorphous layer extending to the surface (this particular sample has already been studied in the TEM). In principle, the explanation of regrowth of the amorphous layer for the 3 x 1014 cm - 2 sample should also hold here, but apparently there is a contradiction, in that the 15-2 growth rate of amorphous Si in the 10 cm sample is accelerated 14-2 as compared with the 3 x 10 cm - sample. The first peak correspond to the amorphous/crystalline interface.and-the second peak occurs at a damage cluster-rich region as already seen in the TEM measurements. In conclusion, the C annealing results'can be explained by considering a layer of isolated damage clusters, a buried amorphous layer, and a continuous amorphous layer, and by predicting their annealing behavior based on the experience with other ions. However, the results of 3 x 1014 cm - 2 and 1015 cm - 2 samples are in disagreement and need further exploration. At higher annealing temperatures, Ag will diffuse into the bulk because of its low solubility in Si. Fairly high concentrations of Ag at 700 and 800 C indicate the formation of some kind of Ag precipitates that seem to break up at 900 C. The reason for the movement of the deeper peak toward the surface is not yet clear. Regarding Cr, we hesitate to propose any explanation yet, because it is so complex. However, combining the SIMS results with the TEM studies could prove very useful to understand regrowth of Amorphous Si on single crystal Si. Samples implanted for XTEM or RBS Two sets of samples have been implanted and submitted for XTEM or RBS analysis, but the measurements or results are not yet completed. Si samples held at C during implantation were implanted - - -I
13 7 with 300 kev Cr at 101 3, 1014, and 1015 cm -2 for both XTEM and RBS measurements. Sample of (100) and (111) Si were implanted with 300 kev oxygen at 1016 cm - 2 for RBS studies as a function of annealing temperature. Publications The manuscript of the paper titled "Effect of oxygen on chromium-structural defects interaction in ion-implanted gallium arsenide" by Sadana, Washburn, Zee, and Wilson has been revised and submitted to the Journal of Applied Physics. We hope for a publication data assignment soon. A paper showing the agreement among SIMS, XTEM, and RBS measurements for the Ag atom depth distributions and depth distributions of defects and damage is still in preparation. Man-Hours Expended During this Reporting Period During the period from 1 August 1981 to 31 January 1982, 233 hours were charged to this contract (70 SMTS hours, 0 MTS hours, and 163 TE hours). We estimate that 85% of the technical effort has been accomplished as a result of the work done through 31 January Future Plans More RBS and XTEM measurements will be made. Some interpretation of data will be done and work will continue on publications. /dlm i _._... - i