Indian Mineral Industry at a Glance
|
|
|
- Vernon Marsh
- 5 years ago
- Views:
Transcription

1

2 Indian Mineral Industry at a Glance Issued by Controller General Indian Bureau of Mines Nagpur Printed at IBM Press, 250/45/March, 2014 (i)
3 Indian Bureau of Mines Nagpur Controller General C. S. Gundewar MINING & MINERAL STATISTICS DIVISION Deputy Director General (Statistics) K. Thomas Directors (Statistics) Saji George Junaid Farooqui Deputy Mineral Economists (Statistics) R. Kumar S.K. Deshpande Assistant Mineral Economists (Statistics) M.V.Sonkusale Badal Kumar S.L.Khadgi Compilation, Processing and Computer Designing Senior Statistical Officers M. M. Chaskar P.S.Pal Tech. Asstt. (Statistics) PUBLICATION SECTION Chief Editor A.K. Singh Editor N.U.Kadu Sr. Technical Assistant P.L.Masram Jr. Technical Assistant A.P.Mishra (ii)
4 PREFACE "Indian Mineral Industry at a Glance " is the thirty third edition in its series. This publication is designed to meet the needs of policy makers, planners, industrialists, economists, academicians, researchers and others connected with planning, exploitation and utilisation of minerals and related activities. For easy reference, the publication has been divided into eight sections viz., General, Mineral Production, Production of Metals and Alloys, Foreign Trade, Employment in Mines, Consumption of Minerals, Production of Mineral-based Products and Mining Machinery. In each section the salient features of the data presented therein are highlighted at the beginning of the section. The Indian Mineral Industry at a Glance pocket book is handy and a ready reckoner with important diagrams. It is stated that some of the figures of GDP, consumption, foreign trade, mineral based product etc. are updated for earlier years based on latest data. The publication has been brought out by the Mining and Mineral Statistics Division of the Bureau. This Division, in addition to the extensive data available with it, has also utilised the data furnished by the Mines Control and Conservation of Minerals Division on Afforestation for Section-1 and Mining Machinery for Section-8. Similarly, Mineral Economics Division has furnished data on Mining Leases for Section-1 and on Consumption of Minerals for Section-6. (iii)
5 The foreign trade data on minerals, metals and selected mineral-based products is received from the Director General of Commercial Intelligence & Statistics (DGCI&S), Kolkata. The export data includes re-exports for the years to Countrywise break-up of some of the minerals and metals at 8- digit customs tariff / ITC (HS) code level is not available for few items. The entire data of such minerals and metals have been grouped under country-item unspecified, which has been clubbed with 'others'. The data for the remaining countries in respect of tables of such minerals have limitations to that extent. The Bureau is thankful to the Ministry of Petroleum and Natural Gas, New Delhi; Office of the Coal Controller, Kolkata; Joint Plant Committee, Kolkata; The Director General of Commercial Intelligence and Statistics, Kolkata; The Department of Industrial policy & promotion, Office of the Economic Advisor, Ministry of Commerce & Industry and Central Statistical Office for providing the valuable information for this publication. I am sure that this publication would serve as a useful reference on mining and minerals not only to those connected with mineral industries but also to others to supplement information. (C. S.Gundewar) Nagpur Controller General Dated: 13 th December, 2013 Indian Bureau of Mines (iv)
6 CONTENTS Section 1 General : 1 Section 2 Mineral Production, to : 33 Section 3 Production of Metals & Alloys, to : 62 Section 4 Foreign Trade, to : 71 Section 5 Average Daily Employment in Mines, to : 100 Section 6 Consumption of Minerals, to : 107 Section 7 Productions of Mineral-based Products, to : 113 Section 8 Mining Machinery, : 119 Appendix Appendix-I Decennial Growth in Production of Important Minerals : 133 Appendix-II Decennial Mineral Production : 135 Note: (i) Figures for the previous year have been revised wherever necessary. Figures for the latest year are provisional and subject to revision. (ii) In certain cases sum of individual items may not tally with the total of the table due to rounding off the figures. (v)
7 Symbols and Abbreviations ( e ) Estimated N.A. Not Available ( R ) Revised ++ Negligible - Nil ( P ) Provisional % Percentage kg. Kilogram t Tonne 000 t Thousand Tonnes m.t. Million Tonnes m.cu.m. Million Cubic Metres R.O.M. Run-of-mine Av. Average m.m. Millimetre h.p. Horsepower (vi)
8 Reserves and Resources as on Mining Leases as on Section 1 General Mineral Reserves/Resources : 7-11 Mining Leases (By Principal Minerals) : 12 Mining Leases (By Principal States) : 13 Concentration of Mining Leases (By Potential) : 14 Distribution of Lease Area (By Sectors) : 15 Distribution of Leases (By Lease Groups) : 15 Distribution of Leases (By Area Groups) : 16 Reporting Mines Number of Reporting Mines (By Mineral Groups) : 17 Value of Mineral Production Number of Underground Mines (By Principal Minerals) : 18 Decennial Growth in the Value of Mineral Production, 1951 to : 19 (1)
9 Value of Mineral Production (By Mineral Group ) : 20 Value of Mineral Production (By Minerals) : 21 Value of Mineral Production (By States) : 22 Value of Mineral Production (By Sectors) : 23 Value of Mineral Production & Number of Mines (By Sectors) : 24 GDP and Indices Index of Mineral Production (By Mineral Groups) : 25 Exports and Imports Explosives Afforestation Wholesale Price Index (By Groups) : 26 Gross Domestic Product (GDP) at Current Prices : 27 Exports: Total Merchandise: Minerals & Metals : 28 Imports: Total Merchandise: Minerals & Metals : 29 Consumption of Explosives, (By Minerals) Afforestation in Metalliferous Mines from to (By Principal Minerals) : : 32 (2)
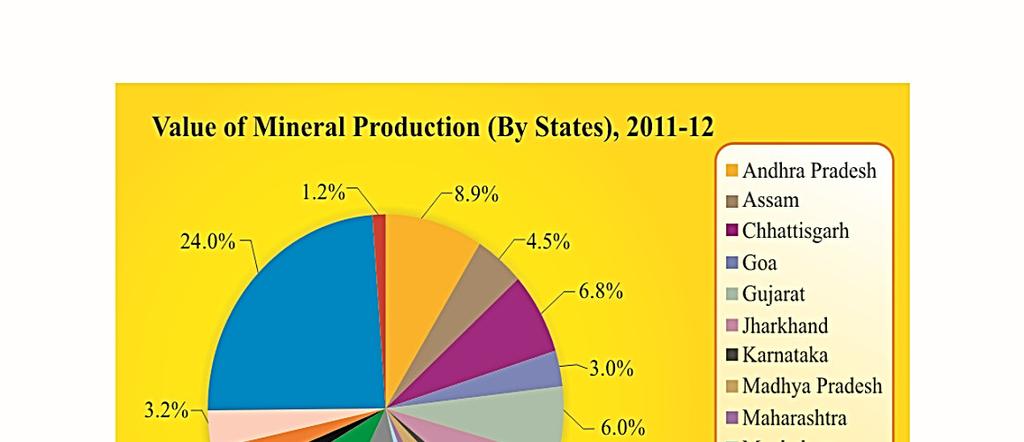
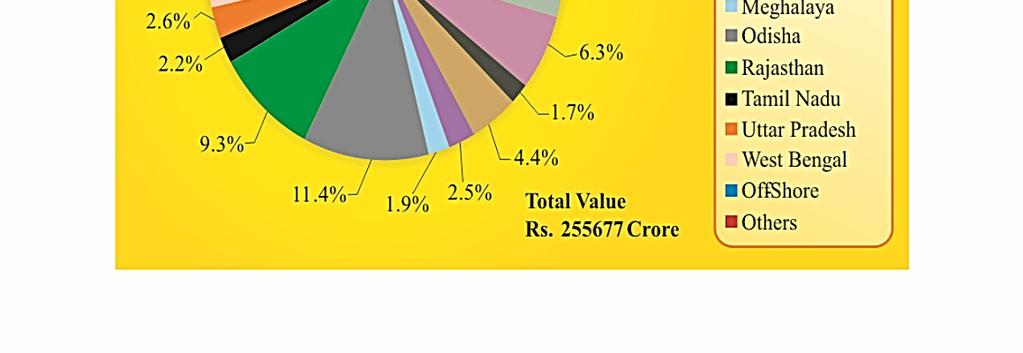
10 Section-1 General The value of mineral production in India covering fuel, metallic, nonmetallic and minor minerals rose spectacularly during the last 6 decades since 1951 and touched the peak level of Rs crore in The increase in the value was attributable to both rises in mineral production as well as in mineral prices. During , production of principal minerals like coal, lignite, petroleum (crude), bauxite, chromite, copper concentrates, iron ore, lead and zinc concentrate, manganese ore, diamond, dolomite, gypsum, kaolin, limestone, phosphorite, steatite etc. has gone up whereas that of gold, kyanite and mica (crude) declined when compared with that of The index of mineral production in new series (base =100) has declined from in to in registering a decrease of 2% as compared to Fuel minerals contributed a major share of 69% in the value of mineral production in , followed by metallic minerals about 18% and non-metallic minerals (including minor minerals) 13 percent. Offshore regions continued to be in leading position, in terms of value of mineral production in the country and had the share of about 24% in the value of national output. Next in order was Odisha with a (3)
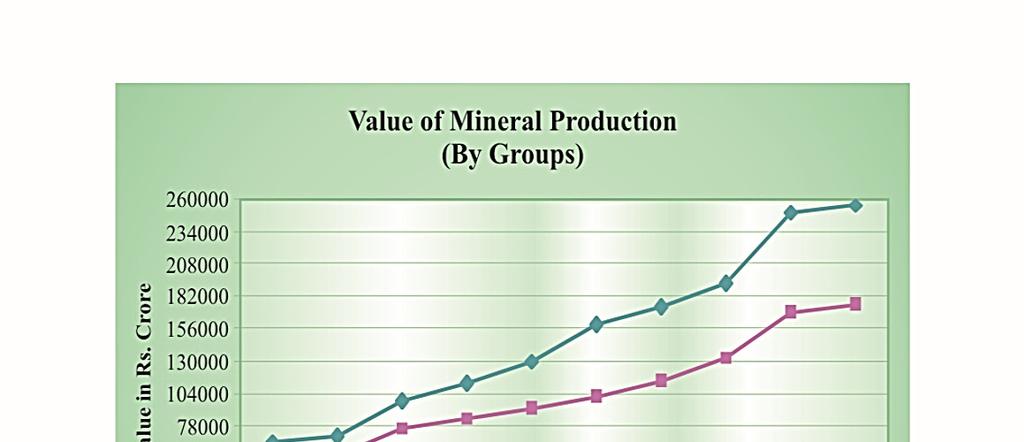
11 share of 11% followed by Rajasthan and Andhra Pradesh (9% each); Chhattisgarh (7%); Jharkhand and Gujarat (6% each), Assam (5%); Madhya Pradesh (4%); West Bengal, Goa, Uttar Pradesh and Maharashtra (3% each); Tamil Nadu, Meghalaya and Karnataka (2% each) in the total value of mineral production while other 16 States/Union Territories having individual nominal share reported the remaining value during the year under review. Off-shore region was the major source for supply of petroleum (crude) and natural gas (utilised) during the decade contributing a substantial amount to the exchequer. The value of mineral production in India in was at Rs crore showing an increase of about 2.5% in comparison with the previous year. Public sector accounted for around 59% of the total value of mineral production during the year. The total number of reporting mines in (excluding those of petroleum (crude), natural gas (utilised), atomic and minor minerals) increased by about 4% as compared to previous year and totalled Of these, 573 mines belonged to coal & lignite, 633 to metallic minerals and 2028 to non-metallic minerals. Growth during 1951 to The mining sector has shown significant growth since The value of mineral production reached the level of Rs crore in from Rs. 80 crore in This was mainly due to significant achievements made in the (4)
12 production of fuel, metallic & non-metallic minerals. The value of fuel minerals shoot up from Rs. 52 crore in 1951 to Rs crore in Similarly, the value of metallic minerals rose from Rs. 19 crore to Rs crore and non-metallic minerals including minor minerals from Rs. 9 crore to Rs crore during the same period. The performance of some important minerals such as fuel, metallic and non-metallic minerals in the last 60 years is shown under Appendix-I at the end of this publication. Fuel Minerals The production of coal at 540 Million tonnes in was more than 15 times of its production at 35 million tonnes recorded in The production of lignite at 42 million tonnes was substantially higher than the that of 34 thousand tonnes in The production of petroleum (crude) at 38 million tonnes during was also significantly higher than that of the 269 thousand tonnes in Natural gas (utilised), which had no production in 1951, recorded a production of m.cu.m. in Metallic Minerals The production of all metallic minerals, except gold, registered a spectacular growth during the last 60 years. The production of iron ore increased from 4 million tonnes in 1951 to 167 million tonnes in The production of (5)
13 bauxite increased from 68 thousand tonnes in 1951 to thousand tonne in , chromite from 17 thousand tonnes to 3764 thousand tonnes, manganese ore from 1398 thousand tonnes to 2349 thousand tonnes, lead concentrates from 2 thousand tonnes to 161 thousand tonnes and zinc concentrates from 2 thousand tonnes to 1412 thousand tonnes. The production of silver, a by-product, was at kg. as compared to 454 kg. in Non-Metallic Minerals In the non-metallic group of minerals, the production of limestone at 257 million tonnes in was more than 48 times of the output recorded in The production of apatite & phosphorite rose from less than a thousand tonne in 1951 to 2330 thousand tonnes during , barytes from 11 thousand tonnes to 1723 thousand tonnes, dolomite from 14 thousand tonnes to 5417 thousand tonnes, gypsum from 207 thousand tonnes to 3189 thousand tonnes, kaolin from 70 thousand tonnes to 2734 thousand tonnes, magnesite from 119 thousand tonnes to 218 thousand tonnes and steatite from 34 thousand tonnes to 959 thousand tonnes in the same period of 60 years. (6)
14 Mineral Reserves and Resources As on Mineral Unit Reserves Remaining Resources Total (A) (B) (A+B) Andalusite 000 t Antimony Ore tonnes Metal tonnes Apatite 000 t Asbestos 000 t Ball Clay 000 t Barytes 000 t Bauxite 000 t Bentonite 000 t Borax tonnes Calcite 000 t Chalk 000 t Chromite 000 t Cobalt (Ore) m. tonnes Copper 000 t Ore Metal Corundum tonnes Diamond th. carats (7)
15 Mineral Reserves and Resources (Contd ) As on Mineral Unit Reserves Remaining Resources Total (A) (B) (A+B) Diaspore 000 t Diatomite 000 t Dolomite 000 t Dunite 000 t Felspar 000 t Fireclay 000 t Fluorite 000 t Fullers Earth 000 t Garnet 000 t Gold Ore (Primary) Metal (Primary) Ore (Placer) Metal (Placer) 000 t tonnes 000 t tonnes Granite (Dimension stone) 000 cu.m (8) Graphite 000 t Gypsum 000 t
16 Mineral Iron Ore & Conc. Hematite Magnetite Mineral Reserves and Resources (Contd ) Unit 000 t Reserves (A) As on Remaining Resources (B) Total (A+B) Kaolin 000 t Kyanite 000 t Laterite 000 t Lead & Zinc Ore Lead Metal Zinc Metal Lead & Zinc Metal 000 t Limestone m.t Magnesite 000 t Manganese Ore 000 t Marble 000 t Marl 000 t Mica tonnes (9)
17 Mineral Mineral Reserves and Resources (Contd ) Unit Reserves (A) (10) As on Remaining Resources (B) Total (A+B) Molybdenum Ore tonnes Contained MOS 2 tonnes Nickel m.t Ochre 000 t Perlite 000 t PGM (Metals) Tonnes of Metal Content Phosphorite/Rock Phosphate 000 t Potash m.t Pyrites 000 t Pyrophyllite 000 t Quartz & Silica sand 000 t Quartzite 000 t Ruby kg Salt (Rock) 000 t Sapphire kg
18 Mineral Reserves and Resources (Concld ) As on Mineral Unit Reserves (A) Remaining Resources (B) Total (A+B) Shale 000 t Sillimanite 000 t Silver Ore Metal 000 t tonnes Slate 000 t Sulphar (Native) 000 t Talc/Steatite/Soap Stone 000 t Tin Ore 000 t Metal tonnes Titanium Minerals 000 t Tungstun Ore tonnes Contained WO 3 tonnes Vanadium Ore tonnes Contained V 2 O 5 tonnes Vermiculite tonnes Wollastonite tonnes Zircon tonnes (11)
19 Mining Leases as on (By Principal Minerals) Mineral No. of Mining Leases % to Area % to Granted/Executed Total Leases ( 000 ha) Total Area Total Limestone Iron Ore Silica Sand Bauxite Manganese Ore China Clay Quartz Steatite Dolomite Mica Fireclay Others Excluding fuel, atomic and minor minerals. Silica Sand - (Silica Sand + Moulding Sand + Sand Others) China Clay - (China Clay + Ball Clay + Clay Others); Quartz - (Quartz + Quartzite) Note : The total no. of mining leases includes 2950 leases expired on or before (12)
20
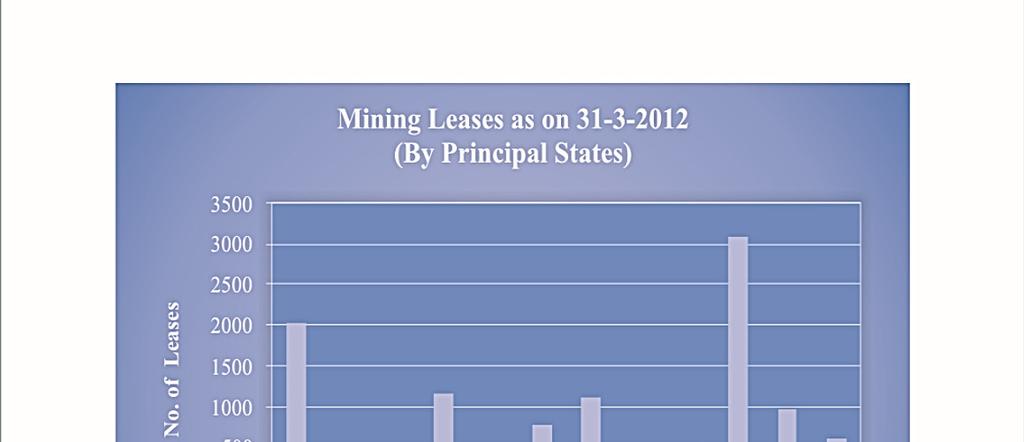
21 Mining Leases as on (By Principal States) State No. of Mining Leases % to Area % to Granted/Executed Total Leases ( 000 ha) Total Area All States Rajasthan Odisha Andhra Pradesh Karnataka Jharkhand Madhya Pradesh Gujarat Goa Chhattisgarh Maharashtra Tamil Nadu Others Excluding fuel, atomic and minor minerals. Note : The total no. on mining leases includes 2950 leases expired on or before (13)
22 Potential Bearing Districts Concentration of Mining Leases as on (By Potential) No. of Districts No. of Mining Leases Granted/ Executed % to Total Leases Area ( 000 ha) % to Total Area Total Low Medium High Excluding fuel, atomic and minor minerals. Note : The total no. on mining leases includes 2950 leases expired on or before High : > 100 mining leases in a district Medium : mining leases in a district Low : < 50 mining leases in a district (14)
23 Distribution of Mining Leases as on (By Sectors) Sector No. of Mining Leases % to Area % to Granted/Executed Total Leases ( 000 ha) Total Area Total Public Sector Private Sector Distribution of Mining Leases as on (By Lease Groups) Frequency Groups Minerals No. of Mining Leases % to Total Area % to (No. of Leases) Covered Granted/Executed Leases ( 000 ha) Total Area Total > Excluding fuel, atomic and minor minerals. Note : The total no. on mining leases includes 2950 leases expired on or before (15)
24 Distribution of Mining Leases as on (By Area Groups) Frequency Groups (Area in ha.) No. of Mining Leases Granted/Executed % to Total Leases Area ( 000 ha) % to Total Area All Groups Above Excluding fuel, atomic and minor minerals. Note : The total no. on mining leases includes 2950 leases expired on or before (16)
25 Number of Reporting Mines, to (By Mineral Groups) Year Total* Coal & Lignite Metallic Minerals Non-Metallic Minerals *Excluding Petroleum (crude), Atomic and Minor minerals. Reporting mine : A mine reporting production or reporting Nil production during a year but engaged in developmental work such as, overburden removal; underground driving, winzing, sinking work; exploration by pitting, trenching or drilling as evident from the MCDR returns. (17)
26 Number of Underground Mines, (By Principal Minerals) Mineral Total A Category B Category Total Apatite 1-1 Asbestos Barytes 2-2 Chalk 1-1 Chromite Copper Ore Gold Lead & Zinc Manganese Ore Mica Steatite 21 2 Excluding fuel, atomic & minor minerals. A Mechanised Mines: > 150 labours in all > 75 labours in workings below ground B Other than A (18)
27 Decennial Growth in the Value of Mineral Production, 1951 to (By Groups) (Rs. Crore) Year Total Fuels Metallic Minerals Non-Metallic and Minor Minerals Excluding atomic minerals. (19)
28 Value of Mineral Production, to (By Mineral Groups) (Rs. Crore) Year All Non-Metallic and Fuels Metallic Minerals Minerals Minor Minerals Excluding atomic minerals. (20)
29
30 Value of Mineral (By Minerals) (Rs. Crore) Minerals All Minerals Coal Petroleum (crude) Iron Ore Natural Gas (utilised) Lignite Limestone Chromite Lead & Zinc Concentrates Manganese Ore Apatite & Phosphorite Copper Concentrates Bauxite Gold Barytes Dolomite Garnet (abrasive) Gypsum Others 7286 Excluding atomic minerals. (21)
31 Value of Mineral (By States) (Rs. Crore) State India Andhra Pradesh Assam Chhattisgarh Goa Gujarat Jharkhand Karnataka Madhya Pradesh Maharashtra Meghalaya Odisha Rajasthan Tamil Nadu Uttar Pradesh West Bengal Off-Shore Others 1657 Excluding atomic minerals. (22)
32
33 Value of Mineral to (By Sectors) (Rs. Crore) Year Total Public Sector Private Sector Excluding atomic minerals. (23)
34 Value of Mineral Production & Number of Mines, (By Sectors) Total * Public Sector Private Sector No. of Mines Total Value # Metallic # Non-metallic # * Excluding fuel, atomic & minor minerals. # Value in Rs. Crore. (24)

35
36 Index of Mineral Production, to (By Mineral Groups) (Base = 100) All Minerals Fuels Metallic Minerals Non-Metallic Minerals Year/Weight (Base = 100) Year/Weight Note: - Weight of minor minerals production in the index of mineral is for base year base = 100 and it is for base year =100. (25)
37 Wholesale Price Index, to (By Groups) (Base = 100) Year All Commodities Minerals Metallic Minerals Other Minerals Mineral Oils N.A. N.A. N.A. N.A. N.A N.A. N.A. N.A. N.A. N.A (26)
38
39
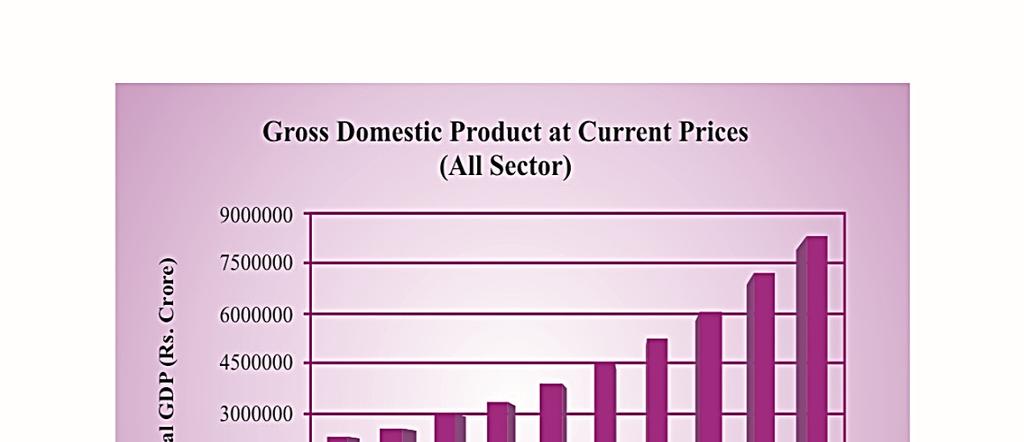
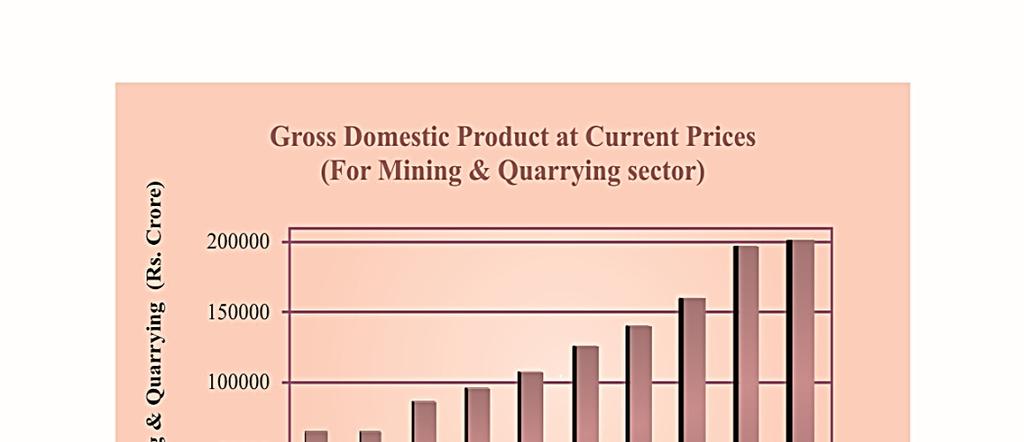
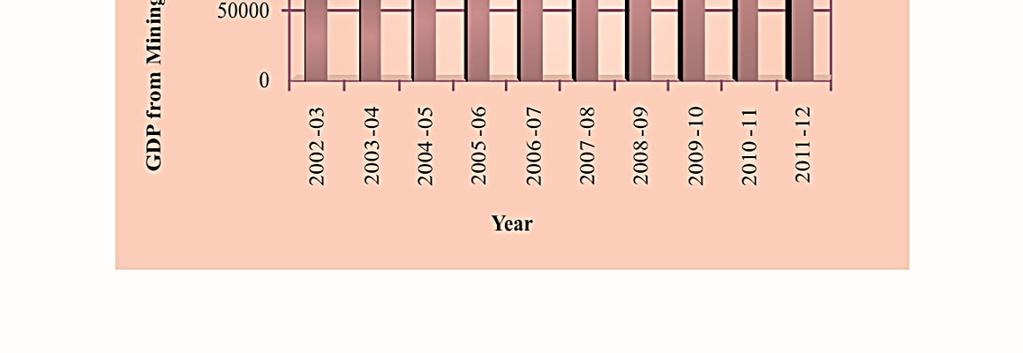
40 Gross Domestic Product (GDP) at Current Prices (Rs. Crore) Year Total GDP Mining & Quarrying Percentage (27)
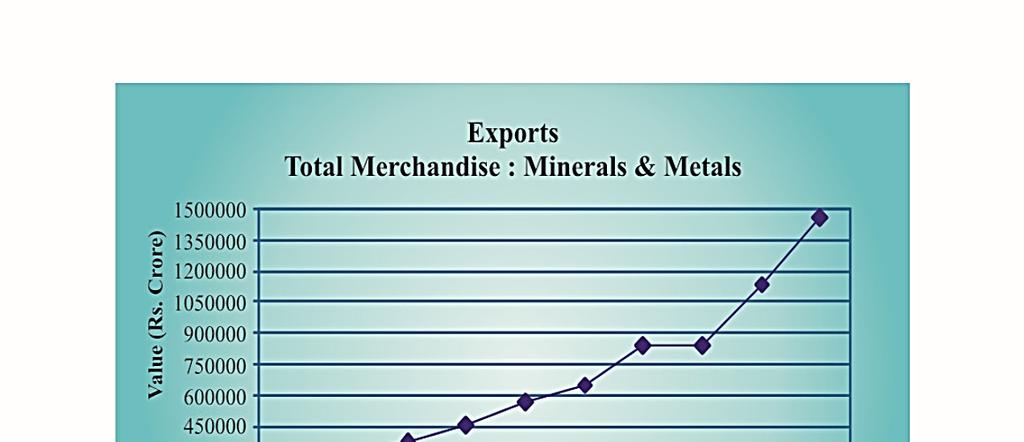
41 Exports Total Merchandise: Minerals & Metals ( Rs. Crore) Year Total Merchandise Minerals % Share Metals % Share (28)
42
43
44 Imports Total Merchandise : Minerals & Metals ( Rs. Crore) Year Total Merchandise Minerals % Share Metals % Share (29)
45 Consumption of Explosives, (By Principal Minerals) (In tonnes) Mineral Gun Powder High Explosives Total: Bauxite Chromite Copper Ore Iron Ore Lead & Zinc Ore Manganese Ore - 12 Dolomite Limestone Steatite Others - Excluding fuel, atomic and minor minerals. (30)
46 Consumption of Explosives, (By Principal Minerals) (In thousands) Mineral Detonators (Nos.) Fuses (Meters) Ordinary* Electric Safety Cordtex Total Bauxite Chromite Copper Ore Iron Ore Lead & Zinc Ore Manganese Ore Dolomite Limestone Steatite Others Excluding fuel, atomic and minor minerals. *Includes other detonators (31)
47 Mineral Afforestation in Metalliferrous Mines from to (By Principal Minerals) Total Area Trees Survival Mines Covered Covered (ha) Percentage Planted ( 000 Nos.) (32) Survived ( 000 Nos.) ( 000 trees) per ha Total Bauxite Chromite Copper Dolomite Gold Iron & Manganese Ore Iron Ore Lead & Zinc Ore Limestone Magnesite Manganese Ore Pyrites Others
48 Production, Value, Employment and Reporting Mines, to , (Principal Minerals) Section 2 Mineral Production Coal : 38 Lignite : 39 Petroleum (Crude) : 40 Natural gas (Utilised) : 41 Bauxite : 42 Chromite : 43 Copper Ore & Concentrates : 44 Gold Ore and Gold : 45 Iron Ore : 46 Lead & Zinc Ore and Concentrates : 47 Manganese Ore : 48 Apatite & Phosphorite : 49 Barytes : 50 (33)
49 Diamond : 51 Dolomite : 52 Fireclay : 53 Gypsum : 54 Kaolin : 55 Kyanite : 56 Limestone : 57 Magnesite : 58 Mica (Crude) : 59 Sillimanite : 60 Steatite : 61 (34)
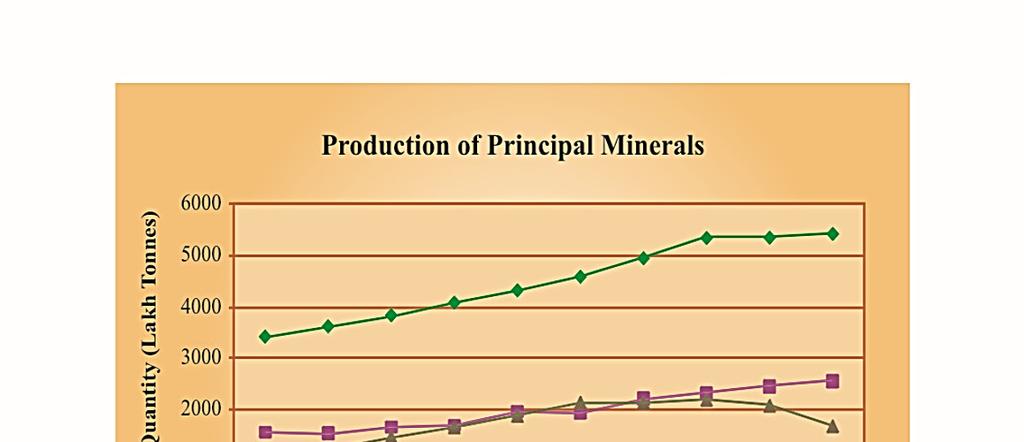
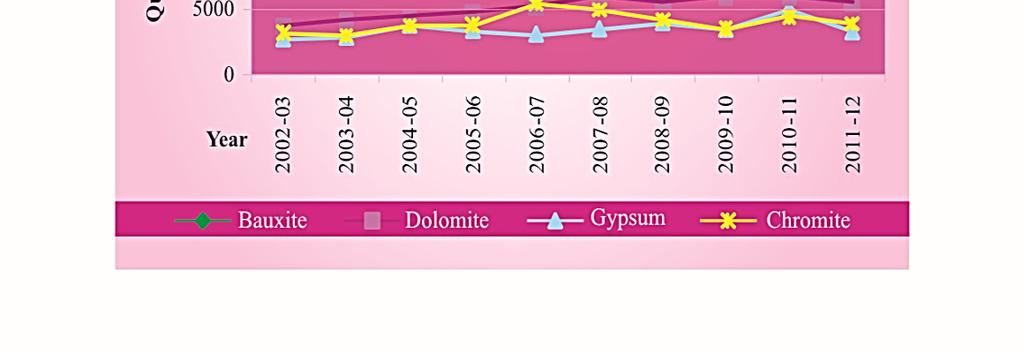
50 Fuel Minerals Section-2 Mineral Production The steady rise in the production of coal continued during the decade under review and reached the level of 540 million tonnes during The production of lignite also maintained a rising trend during the decade ending except in and and it was 42 million tonnes during The production of petroleum (crude) at 38 million tonnes, was increasing during the decade except a marginal decrease in & The output of natural gas (utilised) was increasing during the decade except in , and and it was m.cu.m. during Metallic Minerals The production of bauxite showed gradual increase during the decade till , then started declining and ended up with 13 million tonnes in showing a marginal increase over the previous year. The production of chromite had a mixed trend during the decade and at 3.8 million in , it decreased by 13% as compared to the previous year. The output of copper concentrates revealed a fluctuation trend during the decade and its production in at 130 thousand tonnes decreased by 5% in over the preceding year. Maintaining an upward (35)
51 production trend during the decade till and then showing fluctutions, the output of iron ore in at 167 million tonnes decreased by 19% over the preceding year. The production of manganese ore with fluctuating trend touched the highest level of 3.1 million tonnes in and declined by 23% to 2.3 million tonnes at the end of The production of lead concentrates at 161 thousand tonnes in was highest and that of zinc concentrates at 1412 thousand tonnes was second highest ever in the decade. Non-Metallic Minerals Fluctuating trend in the production of apatite & phosphorite was observed during the decade ending Its production was at 2.3 million tonnes in was highest ever with an increase of 11% compared to the previous year. The production of barytes fluctuated during the decade ending and stood at 1723 thousand tonnes registering a fall of 26% as compared to the highest level in the previous year. The production of diamond showed mixed trend and it was 18 thousand carats during The production trend in dolomite was increasing till and thereafter showed mixed trend. It declined to 5.4 million tonnes in showing a decrease of 7% as compared to the previous year. The trend in production of fireclay was fluctuating during the decade ending and its output at 760 thousand tonnes at the end of decade was 11% lower as compared to the previous year. The output of gypsum had a mixed trend during the decade ending and it was 3189 thousand tonnes at the end of the (36)
52 decade. The output of kaolin showed an increasing trend during the decade except and it reached from 823 thousand tonnes in to 2734 thousand tonnes in The output of kyanite maintained a fluctuating trend of production during the decade and at 4 thousand tonnes in it decreased by 33% as compared to the previous year. The production of limestone has showed an increasing trend during the decade ending except a marginal decrease in and Its production at 257 million tonnes in was 4% higher over the preceding year. The production of magnesite, however showed mixed trend during the decade ending and it was 218 thousand tonnes during , about 8% less than the previous year. The output of mica (crude) also showed a fluctuating trend during the decade ending and was 1.8 thousand tonnes at the end of it from 4.6 thousand tonnes in The output of steatite with a fluctuating trend during the decade ending was highest at 959 thousand tonnes at the end it. (37)
53 Production of Coal, to Year Quantity Value No. of* Labour* Employed (Lakh tonnes) (Rs. Crore) Mines (Av. Daily)** * Excluding Meghalaya ** Data relates to calendar year (38)
54
55 Year Production of Lignite, to Quantity (Lakh tonnes) Value (Rs. Crore) No. Of Mines Labour Employed (Av. Daily) (39)
56 Production of Petroleum (Crude), to Year Quantity Value ( 000 tonnes) (Rs. Crore) (40)
57 Production of Natural Gas (Utilised), to Year Quantity Value (m.cu.m.) (Rs. Crore) (41)
58 Production of Bauxite, to Year Quantity Value No. of Labour Employed ( 000 tonnes) (Rs. Crore) Mines (Av. Daily) (42)
59
60 Production of Chromite, to Year Quantity Value No. of Labour Employed ( 000 tonnes) (Rs.Crore) Mines (Av. Daily) (43)
61 Production of Copper Ore and Concentrates, to Year Copper Ore Quantity ( 000 tonnes) Copper Concentrates Quantity Value ( 000 tonnes) (Rs. Crore) No. of Mines Labour Employed (Av. Daily) (44)
62 Production of Gold Ore and Gold, to Gold Year Gold Ore By Labour Primary Total No. of Qty. Product Employed Mines ( 000 tonnes) Qty Qty Qty Value (Av. Daily) (Kg.) (Kg.) (Kg.) (Rs.Crore) Note :- No. of Mines and labour employed relates to primary gold. (45)
63 Production of Iron Ore, to Year Quantity Value No. of Labour Employed (Lakh tonnes) (Rs. Crore) Mines (Av. Daily) (46)
64 Year Production of Lead & Zinc Ore and Concentrates, to Lead & Zinc Ore Qty. ( 000 tonnes) Lead Concentrates Qty. ( 000 tonnes) Value (Rs. Crore) Zinc Concentrates Qty. ( 000 tonnes) Value (Rs. Crore) No. of Mines Labour Employed (Av. Daily) (47)
65 Production of Manganese Ore, to Year Quantity Value No. of Labour Employed ( 000 tonnes) (Rs. Crore) Mines (Av. Daily) (48)
66 Production of Apatite and Phosphorite, to Year Quantity Value No. of Labour Employed ( 000 tonnes) (Rs. Crore) Mines (Av. Daily) (49)
67 Production of Barytes, to Year Quantity Value No. of Labour Employed ( 000 tonnes) (Rs. Crore) Mines (Av. Daily) (50)
68 Production of Diamond, to Year Quantity Value No. of Labour Employed ( 000 carats) (Rs. Crore) Mines (Av. Daily) (51)
69 Production of Dolomite, to Year Quantity Value No. of Labour Employed ( 000 tonnes) (Rs. Crore) Mines (Av. Daily) (52)
70 Production of Fireclay, to Year Quantity Value No. of Labour Employed ( 000 tonnes) (Rs. Crore) Mines (Av. Daily) (53)
71 Production of Gypsum, to Year Quantity Value No. of Labour Employed ( 000 tonnes) (Rs. Crore) Mines (Av. Daily) (54)
72 Production of Kaolin, to Year Quantity Value No. of Labour Employed ( 000 tonnes) (Rs. Crore) Mines (Av. Daily) (55)
73 Production of Kyanite, to Year Quantity Value No. of Labour Employed ( 000 tonnes) (Rs. Crore) Mines (Av. Daily) (56)
74 Production of Limestone, to Year Quantity Value No. of Labour Employed (Lakh tonnes) (Rs. Crore) Mines (Av. Daily) (57)
75 Production of Magnesite, to Year Quantity Value No. of Labour Employed ( 000 tonnes) (Rs. Crore) Mines (Av. Daily) (58)
76 Production of Mica (Crude), to Year Quantity Value No. of Labour Employed ( 000 tonnes) (Rs. Crore) Mines (Av. Daily) (59)
77 Production of Sillimanite, to Year Quantity Value No. of Labour Employed ( 000 tonnes) (Rs. Crore) Mines (Av. Daily) (60)
78 Production of Steatite, to Year Quantity Value No. of Labour Employed ( 000 tonnes) (Rs. Crore) Mines (Av. Daily) (61)
79 Production of Metals and Alloys, to Section 3 Production of Metals & Alloys Iron & Steel : 65 Ferro-Alloys : 66 Alumina and Aluminium : 67 Copper : 68 Gold and Silver : 69 Lead & Zinc : 70 (62)
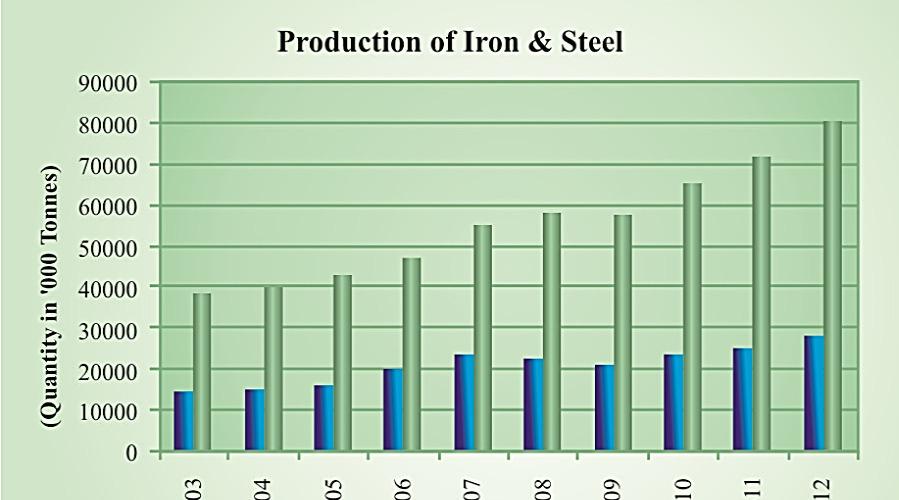
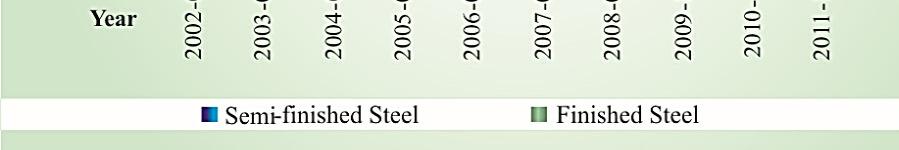
80 Ferrous Metals Section 3 Production of Metals & Alloys There was a continuous upward trend in production of finished steel till , which declined marginally to 57.7 million tonnes during the year and again increased to 80.4 million tonnes in Similarly, the upward trend in production of semi-finished steel was also observed during the decade ending except in the years and It increased to 27.9 million tonnes in showing an increase of 11% over the previous year. Ferro-Alloys Increasing trend in production of ferro-chrome was observed during the decade ending except in and its production at 943 thousand tonnes was marginally higher as compared to previous year. The output of ferro-manganese with a fluctuating trend increased marginally during and that of ferro-silicon increased 10% over the previous year as compared to previous year. Non-ferrous Metals Among the non-ferrous metals, India has achieved self-sufficiency in aluminium and zinc. The production of alumina rose steadily since to except in and In it was 3931 thousand tonnes with an (63)
81 increase of 10% as compared to that in the previous year. The production of aluminium increased steadily during the decade and it was 1654 thousand tonnes in , more than double of the level in The production of copper (blister)/anode was highest at 311 thousand tonnes in and then declined steeply to 19 thousand tonnes in The production of copper (cathode) at 505 thousand tonnes registered a marginal decrease and that of copper (CCWR) at 288 thousand tonnes during was 4% lower than that of the previous year. There was a fluctuating trend in the production of gold (including by product) during the decade and at kg. in it was about 21% higher than that of the preceding year. The production of silver, a by-product, reached the peak level of tonnes during and was 36% higher as compared to the previous year. The output of lead (primary) fluctuated during the decade ending and reached to highest level of 92 thousand tonnes at the end of it registering an increase of 61% as compared to that in previous year. No production of lead (secondary) was reported during the decade ending The output of zinc ingots maintained a rising trend during the decade except in and rose by about 6% during to 784 thousand tonnes as compared to that in the previous year. (64)
82
83 Production of Iron and Steel, to ( 000 tonnes) Year Semi-finished Finished Steel* Semi-finished steel including Steel ingots * Including C.R. Sheets Source: Joint Plant Committee, Kolkata (65)
84 Production of Principal Ferro-Alloys, to ( 000 tonnes) Year Ferro-Chrome Ferro-Manganese Ferro-Silicon Source: Joint Plant Committee, Kolkata. (66)
85 Production of Alumina & Aluminium, to ( 000 tonnes) Year Alumina Aluminium (67)
86 Production of Copper, to ( 000 tonnes) Year Blister/ Electrolytic Anode Wire Bar Cathode CCWR CCWR: Continuous Cast Wire Rod. (68)
87 Production of Gold and Silver, to (Kilograms) Year Gold Silver * * * * * * * * * * *Includes production reported from HINDALCO Industries Ltd. (69)
88 Production of Lead and Zinc, to ( 000 tonnes) Year Lead (Primary) Lead (Secondary) Zinc Ingots (70)
89 Exports of Principal Minerals, to Imports of Principal Minerals, to Section 4 Foreign Trade Chromite : 76 Granite : 77 Value of Exports of granite (By Principal Countries) : 78 Iron Ore : 79 Value of Exports of Iron ore (By Principal Countries) : 80 Manganese Ore : 81 Marble : 82 Mica : 83 Asbestos : 84 Coal : 85 Petroleum (Crude) : 86 Rock Phosphate : 87 Sulphur : 88 (71)
90 Direction of Trade Value of Exports of Minerals, : 89 Value of Exports of Metals, : 90 Value of Imports of Minerals, : 91 Value of Imports of Metals, : 92 Exports, Imports & Net Trade in Minerals & Metals : Share of Principal Minerals in the Exports Value of Minerals Share of Principal Minerals in the Imports Value of Minerals Share of Principal Countries in the Value of Exports of Diamond Share of Principal Countries in the Value of Imports of Diamond Production, Exports/Imports & Apparent consumption as Percent of Total Availability, : 95 : 96 : 97 : 98 : 99 (72)
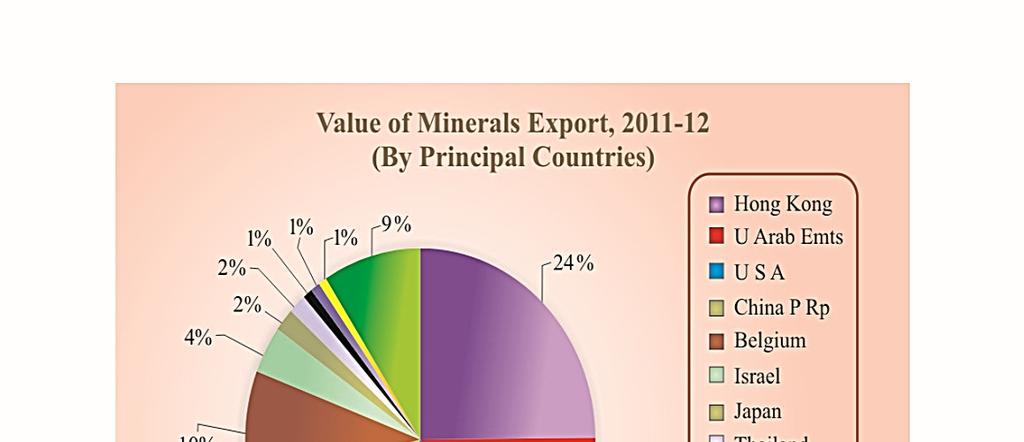
91 Section-4 Export The value of exports of minerals from India, which continued its growth every year of the decade, increased marginally to Rs crore during as compared to It was more than thrice of the value of exports at the beginning of the decade i.e Diamond accounted for 77% of the total value of exports of minerals during followed by iron ore 13% and granite 4 percent. India imports diamond (uncut) and after cutting & polishing exports the same thus earning substantial foreign exchange by value addition. The share of diamond in the value of exports of minerals fluctuated form 60% to 77% during the period to The export of iron ore had fluctuating trends throughout the decade and at 47 million tonnes during , it was almost at the same level of previous year. Granite emerged as one of the leading foreign exchange earner during the decade. Its value of exports at Rs crore in was more than twice of the value in and registered an increase of about 14% as compared to The exports of manganese ore fluctuated during the decade ending The exports during were 75 thousand tonnes which were lower by 24 (73)
92 percent whereas the value of exports of manganese ore decreased by 45% as compared to the preceding year. Other notable mineral items exported from India during were alumina, barytes, chromite, coal, coke, lead ore & conc., titanium ores & conc., precious & semi-precious stones, zinc ore & concentrates, etc. Imports The value of imports of minerals and metals went up steeply from Rs crore in to the level of Rs crore in During the year , the share of petroleum (crude) in the total value of imports of minerals was 68% and that of diamond was 14%, coal 8% and natural gas and copper ore & concentrates 3% each. The value of import of petroleum (crude) was Rs crores in and that of diamond was Rs crore. India imported 103 million tonnes of coal valued at Rs crore in The quantity of imports of petroleum (crude) went up steadily from 83.7 million tonnes in to million tonnes in The value of imports of petroleum (crude) alone was at Rs crore which accounted for 68% in the total value of imports of minerals in (74)
93 The imports of rock phosphate fluctuated during the decade ending The quantity of imports of rock phosphate at 9.73 million tonnes increased significantly by 87% and the value also increased to Rs crore in which was more than the double as compared to the previous year. The imports of sulphur (excluding precipitated, sublimed and colloidal) were at the level at 1.4 million tonnes in , fluctuated during the decade and it was about 2.04 million tonnes during The value of imports (excluding precipitated, sublimed and colloidal) was Rs crore in Coke, copper ores & concentrates, iron ore, asbestos, precious and semiprecious stones, manganese ore, marble and molybdenum ores & concentrates natural gas etc. were the other important minerals imported into India in (75)
94 Exports of Chromite, to Year Quantity Value ( 000 tonnes) (Rs. Crore) (76)
95 Exports of Granite, to Year Quantity Value ( 000 tonnes) (Rs. Crore) (77)
96 Value of Exports of Granite, to (By Principal Countries) ( Rs. Crore) Country All Countries China USA Germany Italy Turkey UK Belgium UAE Hong Kong Chinese Taipei / Taiwan Others (78)
97 Exports of Iron Ore, to Year Quantity Value (Lakh tonnes) (Rs. Crore) (79)
98 Value of Exports of Iron Ore, to (By Principal Countries) (Rs. Crore) Country All Countries China P Rp Japan Korea Rp Netherlands Bangaladesh Others (80)
99 Exports of Manganese Ore, to Year Quantity Value ( 000 tonnes) (Rs. Crore) (81)
100 Exports of Marble, to Year Quantity Value ( 000 tonnes) (Rs. Crore) (82)
101 Exports of Mica, to Year Quantity Value ( 000 tonnes) (Rs. Crore) (83)
102 Imports of Asbestos, to Year Quantity Value ( 000 tonnes) (Rs. Crore) (84)
103 Imports of Coal, to Year Quantity Value ( 000 tonnes) (Rs. Crore) (85)
104 Imports of Petroleum (Crude), to Year Quantity Value (Lakh tonnes) (Rs. Crore) (86)
105 Imports of Rock Phosphate, to Year Quantity Value ( 000 tonnes) (Rs. Crore) (87)
106 Imports of Sulphur*, to Year Quantity Value ( 000 tonnes) (Rs. Crore) * Excluding sublimed, ppt and colloidal. (88)
107
108 Value of Exports of Minerals, (By Principal Countries) Country Value Percentage (Rs. Crore) Contribution Total Hong Kong U Arab Emirates U S A China P Rp Belgium Israel Japan Thailand U K Switzerland Singapore Others (89)
109 Value of Exports of Metals, (By Principal Countries) Country Value Percentage (Rs. Crore) Contribution Total China P Rp U S A U Arab Emirates Belgium Korea Rp Germany Italy Saudi Arabia Malaysia UK Indonesia Nepal Netherlands Spain Others (90)


110
111 Value of Imports of Minerals, (By Principal Countries) Country Value Percentage (Rs. Crore) Contribution Total Saudi Arabia U Arab Emirates Iraq Nigeria Kuwait Iran Qatar Australia Belgium Hong Kong Venezuela Angola Indonesia Others (91)
112 Value of Imports of Metals, (By Principal Countries) Value Percentage Country (Rs. Crore) Contribution Total Switzerland U Arab Emirates South Africa China P Rp Australia U S A U K Korea Rp Japan German F R/Germany Russia Hong Kong Chinese Taipei/Taiwan Malaysia Others (92)
113 Exports, Imports and Net Trade in Minerals and Metals, to (Rs. Crore) Year Minerals and Metals (Including Petroleum) Minerals (Excluding Petroleum Crude) Exports Imports Difference Exports Imports Difference (93)
114 Exports, Imports and Net Trade in Minerals and Metals, to (Rs. Crore) Petroleum Crude Metals Year Exports Imports Difference Exports Imports Difference (94)
115 Share of Principal Minerals in the Value of Mineral Exports, to Year Exports of all Minerals (Rs. Crore) Diamond* Iron Ore Exports Percentage Share of Principal Minerals Granite Alumina Precious & Semi- Precious Stones Zinc Ores& Conc. Chro mite Bauxite Others * Includes mostly cut, industrial and powder. (95)
116 Share of Principal Minerals in the Value of Mineral Imports, to Year Imports of All Minerals (Rs. Crore) Petroleum (Crude) Imports Percentage Share of Principal Minerals Copper Diamond* Natural Coal Ore & Gas Conc. Coke * Includes mostly cut, industrial and powder. Others (96)
117 Share of Principal Countries in the Value of Exports of Diamond, to Exports of Diamond (Mostly Cut) Value of Percentage Share of Principal Importing Countries Year Exports Hong (Rs. Crore) UAE USA Belgium Israel Thailanpore Singa- Others Kong (97)
118 Share of Principal Countries in the Value of Imports of Diamond, to Imports of Diamond (Mostly Cut) Year Value of Imports (Rs. Crore) Belgium Percentage Share of Principal Exporting Countries UAE Hong Kong UK Israel USA Others (98)
119 Production, Exports/Imports and Apparent Consumption as Percentage of Total Availability, (By Selected Minerals) Total Percentage Share of Mineral Availability * Gross Apparent Imports Exports ( 000 tonnes) Production Consumption Barytes Steatite Iron Ore Bauxite Silica sand Limestone Chromite Coal Magnesite Manganese Ore Rock Phosphate Petroleum (crude) Sulphur & Pyrites Asbestos * Total Availability = Apparent Consumption + Exports = Production + Imports (99)
120 Average Daily Employment in Mines Section 5 Average Daily Employment in Mines Average Daily Employment in Mines ( By Groups ), to : 103 Average Daily Employment in Metallic Minerals Mines, (By Sectors) Average Daily Employment in Non Metallic Minerals Mines, (By Sectors) Average Daily Employment in Mines (By Category / Sector), : 104 : 105 : 106 (100)
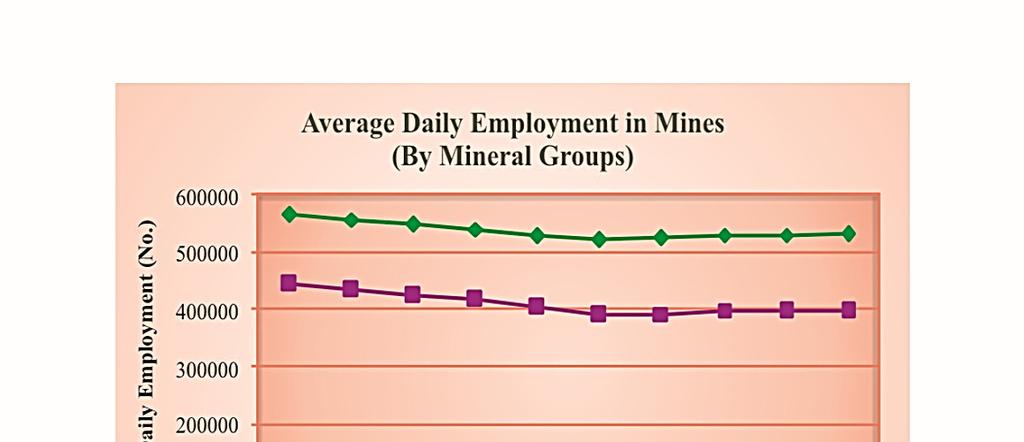
121 Section-5 Average Daily Employment in Mines The average daily employment of labour at around 5.67 lakh persons during , was shrinking till and then increased marginally every year during the decade ending Among the major group of minerals, fuel accounted for 75% to the total employment during , metallic minerals 16% and non-metallic minerals 9 percent. The average daily employment of labour in was which were marginally higher as compared to the preceding year. In the case of fuel minerals, coal and lignite together accounted for 93% of the labour force engaged during Iron ore accounted for 54% of the total employment in metallic group of minerals, followed by manganese ore 17%, bauxite 8%, chromite 7%, lead & zinc concentrates about 6% and copper concentrates and gold 4 percent each. The share of limestone in the labour employed in non-metallic minerals was 45% followed by steatite, garnet (abrasive) and dolomite (6% each), silica sand 4%, sillimanite, apatite & phosphorite (together), kaolin and chalk about 3% each while remaining 21% labour were employed in other non-metallic minerals. In the case of metallic and non-metallic minerals covered under MCDR, 1988 (which excludes fuel, atomic and minor minerals) 428 mines of category 'A' employed 88 thousand persons while 2233 mines of 'B' category employed about 47 (101)
122 thousand persons in The contribution of category 'A' and category 'B' mines to the total value of MCDR minerals in was 78% and 22% respectively. About 42 thousand persons were engaged in 221 public sector mines and 93 thousand persons engaged in 2440 private sector mines in The shares of public and the private sectors in the total value of metallic and non-metallic minerals production were 36% and 64% respectively. (102)

123
124 Average Daily Employment in Mines, to (By Groups) Year Total Fuels* Metallic Non-metallic Minerals Minerals *: Calendar year Source: Fuel - DGMS, Dhanbad Metallic & Non-metallic - Returns received under MCDR, (103)
125 Average Daily Employment in Metallic Minerals Mines, (By Sectors) Mineral Total Public Private Total Iron Ore Manganese Ore Bauxite Chromite Lead & Zinc Concentrates Gold Copper Concentrates Tin Concentrates (104)
126 Average Daily Employment in Non-Metallic Minerals Mines, (By Sectors) Mineral Total Public Private Total Limestone Steatite Garnet (Abresive) Dolomite Silica Sand Sillimanite Apatite & Phosphorite Kaolin Chalk Others (105)
127 Category/Sector Employment in Mines, (Metallic & Non-Metallic Minerals) (By Category/Sector) No. of Mines Average Daily Employment for the Group Value of Production (Rs. Crore) Total Category A Category B Public Sector Private Sector Category 'A' i) Mechanised Mines ii) > 150 labours in all iii) > 75 labours in workings below ground Category 'B' : Other than 'A' (106)
128 Section 6 Consumption of Minerals Consumption of Minerals, to Iron & Steel Industry : 110 Cement Industry : 111 Refractory Industry : 112 (107)
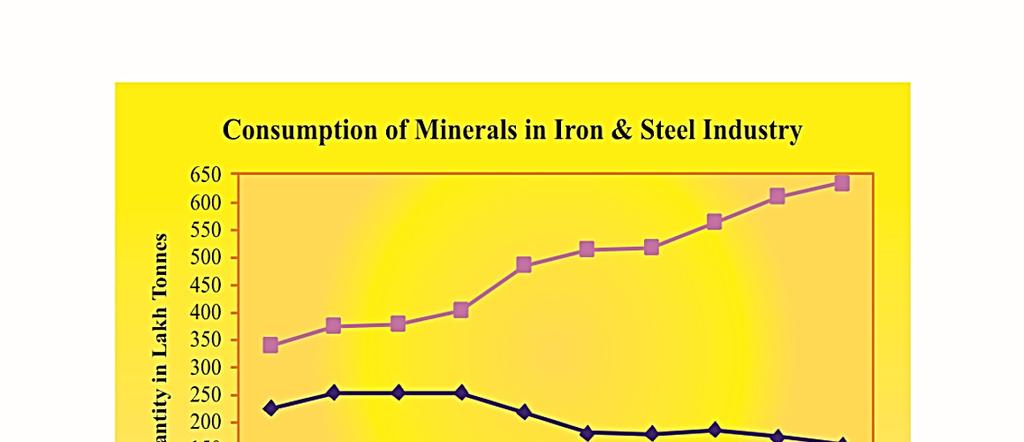
129 Iron & Steel Industry Section-6 Consumption of Minerals Iron ore is the basic raw material required for iron & steel industry. Besides coal, limestone, dolomite, manganese ore, bauxite, ferro-alloys, fireclay and fluorite are also widely consumed. During the year , upward trend of mineral consumption in above minerals was observed in iron & steel industry except in case of coal and fluorite. Significant increase in consumption was noticed in respect of manganese ore (69%), ferro-alloys (11%), limestone (6%), iron ore (5%), and dolomite (1%). Consumption of bauxite and fire clay maintained almost the level of previous year in The consumption of coal decreased by about 8% in as compared to previous year. Cement Industry Important minerals, consumed in cement industry are limestone and other calcareous materials and gypsum. Besides quartz, quartzite & silica sand, bauxite, coal, china clay, fire clay and iron ore are also consumed. During the year consumption increased in respect of bauxite, (108)
130 quartz/quartzite/silica sand, limestone and other calcareous materials while a considerable decrease was observed in case of iron ore (3%), coal (9%) and fireclay (4%). The consumption of kaolin and gypsum maintained almost the same level. Refractory Industry During the year chromite, kaolin, fireclay and magnesite showed downward trend of consumption in refractory industry. Consumption of bauxite, diaspore, dolomite, Kyanite & Sillimanite and Quartz & Quartzite maintained the same level of previous year. (109)
131 Consumption of Minerals in Iron & Steel Industry, to ( 000 tonnes) Iron Year Ore * Coal * Limestone Dolomite Fluorite Manganese Ferro- Bau- Fire Ore Alloys xite clay N.A. N.A N.A. N.A N.A. N.A N.A. N.A * Lakh Relates to despatches of coal. (110)
132
133 Consumption of Minerals in Cement Industry, to ( 000 tonnes) Year Limestone *# Coal * Gypsum * Quartz$ Bauxite Iron Ore Kaolin Fireclay * Lakh tonnes. #: Limestone and other calcareous Relates to despatches of coal. $ Includes Quartz, Quartzite and Silica Sand. (111)
134 Consumption of Minerals in Refractory Industry, to ( 000 tonnes) Year Dolomite Fireclay Magnesite * Quartz & Bauxite & Chromite* Kyanite & Quartzite Diaspore Sillimanite Kaolin * Includes consumption in iron & steel industry. (112)
135 Section 7 Production of Mineral-Based Products Production of Mineral-based Products, to Cement and Asbestos-Cement Products : 115 Ceramic Products : 116 Fertilizers : 117 Sulphuric Acid : 118 (113)
136 Section 7 Production of Mineral-Based Products Cement and Asbestos-Cement Products The output of cement in the country during at 2235 lakh tonnes was just double as compared to 1118 lakh tonnes at the beginning of the decade and it was 7% higher as compared to the level of previous year. Ceramic Products The total production of ceramic products consisting of glazed tiles and insulators showed increasing trend from 758 thousand tonnes at the beginning of the decade to a highest level of 1634 thousand tonnes at the end of it. The output of glazed tiles at 718 thousand tonnes in recorded an increasing trend and was at the peak level of 1573 thousand tonnes during Production of insulators recorded a fluctuating trend during the decade and was at the level of 61 thousand tonnes during Fertilisers and Sulphuric Acid The output of fertilisers witnessed fluctuations during the decade and reported the production of 10.9 million tonnes in The production of sulphuric acid at 5870 thousand tonnes was 4% higher in as compared to the previous year. (114)
137 Production of Cement and Asbestos-Cement Products, to Year Cement Asbestos-Cement Products* Production ( Lakh tonnes) Production ( 000 tonnes) N.A. * Includes the production of asbestos cement sheets and Asbestos cement pressure & building pipes, etc. Source: Department of Industrial Policy and Production figures pertain to the units included in the sample/frame for Index of Industrial Production with base year (115)
138 Production of Ceramic Products, to ( 000 tonnes) Year Glazed Tiles Insulators (H.T. and L.T.) Source: Department of Industrial Policy and Production figures pertain to the units included in the sample/frame for Index of Industrial Production with base year (116)
139 Production of Fertilisers, to ( 000 tonnes) Year Phosphatic Nitrogenous Source: Annual report , Department of Fertilisers, Ministry of Chemicals and Fertilisers. (117)
140 Production of Sulphuric Acid, to ( 000 tonnes) Year Production Source: Department of Industrial Policy and Production figures pertain to the units included in the sample/frame for Index of Industrial Production with base year (118)
141 Mining Machinery, Section 8 Mining Machinery Dipper Shovels : 121 Front- End Loaders : 122 Bulldozers : 123 Motor Graders : 124 Haulers/Dumpers : 125 Drills/ Blast Holes : 126 Crushers : 127 Air Compressors : 128 Locomotives : 129 Back Hoes : 130 Cranes : 131 Surface Miners : 132 (119)
142 Section 8 Mining Machinery During the reporting year, , a total number of 542 opencast mechanised mines were covered for compilation of statement on mining machinery as against 490 mines covered during Hence, there is a increase of 10.61% on the coverage of mines during the year. Like previous year, the majority of the mechanised mines covered are of limestone, iron ore, steatite, bauxite, chromite and others. Conventional method of deep hole blasting with Shovel Dumper combination are mostly found. It is observed that there is a decrease in the number of mining machinery like Hauler / Dumper, Front End Loader, Dipper Shovel (Hydraulic), Back Hoe, Motor Grader, Crusher and Bull Dozer; whereas, an increase in the number of mining machinery like Dipper Shovel (Mech.), Drills / Blast holes, Air Compressor, Surface Miners and Cranes is reported during the year. (120)
143 Mining Machinery in Metalliferrous Opencast Mechanised Mines in India, Dipper Shovels (Mechanical and Hydraulic) Capacity Total Mechanical Hydraulic (Cu.m) Total Public Private Total Public Private Total Public Private In Use (Nos.) < > Total In Reserve (Nos.) < > Total (121)
144 Mining Machinery in Metalliferrous Opencast Mechanised Mines in India, Front End Loaders Capacity In Use (Nos.) In Reserve (Nos.) (cu.m.) Total Public Private Total Public Private < > Total (122)
145 Mining Machinery in Metalliferrous Opencast Mechanised Mines in India, Bulldozers/Ripper Dozers Capacity In Use (Nos.) In Reserve (Nos.) (h.p.) Total Public Private Total Public Private < > Total (123)
146 Mining Machinery in Metalliferrous Opencast Mechanised Mines in India, Motor Graders Capacity In Use (Nos.) In Reserve (Nos.) (h.p.) Total Public Private Total Public Private < > Total (124)
147 Mining Machinery in Metalliferrous Opencast Mechanised Mines in India, Haulers/Dumpers Capacity In Use (Nos.) In Reserve (Nos.) (tonnes) Total Public Private Total Public Private < > Total (125)
148 Mining Machinery in Metalliferrous Opencast Mechanised Mines in India, Drills/Blast Holes Capacity in diameter In Use (Nos.) In Reserve (Nos.) of the hole/bit (m.m.) Total Public Private Total Public Private < > Total (126)
149 Mining Machinery in Metalliferrous Opencast Mechanised Mines in India, Crushers Capacity In Use (Nos.) In Reserve (Nos.) (tonnes/hour) Total Public Private Total Public Private < > Total (127)
150 Mining Machinery in Metalliferrous Opencast Mechanised Mines in India, Air Compressors (Diesel & Electric) Capacity Total Diesel Electric (cu.m./min.) Total Public Private Total Public Private Total Public Private In Use (Nos.) < > Total In Reserve (Nos.) < > Total (128)
151 Mining Machinery in Metalliferrous Opencast Mechanised Mines in India, Locomotives Pay load In Use (Nos.) In Reserve (Nos.) capacity Total Public Private Total Public Private (tonnes) < > Total (129)
152 Mining Machinery in Metalliferrous Opencast Mechanised Mines in India, Back Hoes Capacity In Use (Nos.) In Reserve (Nos.) (cu.m.) Total Public Private Total Public Private < > Total (130)
153 Mining Machinery in Metalliferrous Opencast Mechanised Mines in India, Cranes Lifting In Use (Nos.) In Reserve (Nos.) capacity Total Public Private Total Public Private (tonnes/hour) < > Total (131)
154 Mining Machinery in Metalliferrous Opencast Mechanised Mines in India, Surface Miners Capacity In Use (Nos.) In Reserve (Nos.) (tonnes/hour) Total Public Private Total Public Private < > Total (132)
155 Appendix - I Decennial Growth in Production of Important Minerals Mineral Unit Fuels Coal 000 t Lignite 000 t Natural Gas (Utilised) m.cu. m Petroleum (Crude) 000 t Metallic Minerals Bauxite 000 t Chromite 000 t Copper Concentrates 000 t Copper Ore 000 t Gold Kg Gold Ore 000 t N.A Iron Ore 000 t Lead Concentrates 000 t Zinc Concentrates 000 t Lead & Zinc Ore 000 t N.A Manganese Ore 000 t Silver kg (Contd.) (133)
156 Decennial Growth in Production of Important Minerals (Concld.) Mineral Unit Non-Metallic Minerals Apatite & 000 t Phosphorite Barytes 000 t Diamond th. carats Dolomite 000 t Fire Clay 000 t Gypsum 000 t Kaolin 000 t Kyanite 000 t Sillimanite 000 t Laterite 000 t 5 N.A. N.A. N.A Limestone 000 t Magnesite 000 t Mica (Crude) tonnes 10182* Steatite 000 t * Relates to dressed mica. (134)
157 Appendix II Decennial Mineral Production Mineral Unit Fuels Coal 000 t Lignite 000 t Natural Gas (Utilised) m. cu. m Petroleum (Crude) 000 t Metallic Minerals Bauxite t Chromite t Copper Ore t Copper Conc. t Gold Ore t Gold kg Iron Ore 000 t Lead & Zinc Ore t Lead Conc. t Zinc Conc. t Manganese Ore t (135)
158 Decennial Mineral Production (Contd ) Mineral Unit Silver kg Tin Conc. kg Non-Metallic Minerals Agate t Apatite t Phosphorite t Asbestos t Ball Clay t Barytes t Calcite t Chalk t Clay (Others) t Corundum kg Diamond crt Diaspore t Dolomite t Dunite t Felspar t (136)
159 Decennial Mineral Production (Contd ) Mineral Unit Fireclay t Felsite t Fluorite (Graded) t Fluorite (Conc.) t Garnet (Abrasive) t Garnet (Gem) kg Graphite (R.O.M.) t Gypsum t Iolite kg Jasper t Kaolin t Kyanite t Sillimanite t Laterite t Limestone 000 t LimeKankar t (137)
160 Decennial Mineral Production (Contd ) Mineral Unit Limeshell t Magnesite t Marl t Mica (Crude) t Mica (Waste & Scrap) t Ochre t Perlite t Pyrophyllite t Pyroxenite t Quartz t Quartzite t Silica Sand t Sand (Others) t Salt (Rock) t Shale t (138)
161 Decennial Mineral Production (Concld.) Mineral Unit Slate t Steatite t Selenite t Sulphur t Vermiculite t Wollastonite t (139)


162