Supporting Information. Multivalent Electrochemistry of Spinel Mg x Mn 3-x O 4 Nanocrystals
|
|
|
- Laurel Hines
- 5 years ago
- Views:
Transcription
1 Supporting Information Multivalent Electrochemistry of Spinel Mg x Mn 3-x O 4 Nanocrystals Chunjoong Kim,,, Abdullah A. Adil,, Ryan D. Bayliss,, Tiffany L. Kinnibrugh #, Saul H. Lapidus #, Gene M. Nolis,, John W. Freeland #, Patrick J. Phillips,, Tanghong Yi,,Hyun Deog Yoo,, Bob Jin Kwon,, Young-Sang Yu, Robert Klie,, Peter J. Chupas #, Karena W. Chapman #, and Jordi Cabana *, Department of Chemistry, Department of Physics, University of Illinois at Chicago, Chicago, Illinois 60607, United States Department of Materials Science and Engineering, Chungnam National University, Daejeon, South Korea Joint Center for Energy Storage Research (JCESR), # X-ray Science Division, Advanced Photon Source, Argonne National Laboratory, Lemont, Illinois 60439, United States Advanced Light Source, Lawrence Berkeley National Laboratory, Berkeley, Californaia 94720, United States *Corresponding author: Jordi Cabana (jcabana@uic.edu) 1
2 Table S1. Evaluation of the site occupancies for a tetragonal spinel structure with a fixed composition of Mg0.5Mn2.5O4 Models R-factor Tetrahedral Sites Octahedral Sites Mg Mn Mg Mn A B C D E F
3 Intensity (arb. unit) (101) (211) (112) (200) (103) (004) (220) (105) (312) (303) (321) (224) (400) (413) Mg 0.5 Mn 2.5 O 4 Mn 3 O Scattering Angle (2θ ) Figure S1. Laboratory XRD patterns of Mg0.5Mn2.5O4 (top) and Mn3O4 (bottom). Reference peak positions and intensities of Mn3O4 (I41/amd (141), JCPDS card No ) are displayed in the bottom. 3


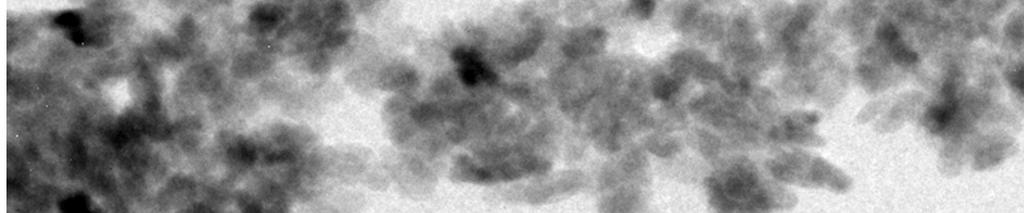


4 Figure S2. Representative TEM images of (a) Mn3O4 nanocrystals revealing the average size of ~18.3 nm (b) Mg0.5Mn2.5O4 nanocrystals with the size of ~5 nm ⅹ ~15 nm. 4
5 Figure S3. Representative fits of the PDF data for as-synthesized Mg0.5Mn2.5O4 nanocrystals using models where the occupancies of the tetrahedral and octahedral sites in the tetragonal spinel were varied according to the corresponding models in Table S1. 5
6 0.4 Current (ma) Mg 0.5 Mn 2.5 O Mn 3 O Voltage (V vs. SCE) Figure S4. Linear sweep voltammetry of Mg0.5Mn2.5O4 (top) and Mn3O4 (bottom) nanocrystals in aqueous electrolytes. 6
7 Normalized Absorption Normalized Absoprtion (a) Pristine Charged Discharged Energy (ev) (b) Energy (ev) Pristine Charged Discharged Figure S5. (a) Mn K-edge X-ray absorption spectra of pristine, oxidized (charged) and reduced (discharged) with (B) near edge region. Spectra were measured at beamline 4-1 at SSRL, in transmission mode using a Si (220) double crystal monochromator. A reference 7
8 XAS of Mn standard foil located in front of a reference ion-chamber was measured simultaneously with each spectral sample for energy calibration. All data processing, including normalization of transmission spectra was carried out using the software SIXPACK. [Webb, S. M. The MicroAnalysis Toolkit: X-ray fluorescence image processing software. AIP Conference Proceedings 1365, (2011).] Pre-edge background subtraction and XANES normalization were carried out by fitting a linear polynomial to the pre-edge region and a quadratic polynomial to the post-edge region of the absorption spectrum. The energy threshold, E 0, of the reference Mn foil was determined from the first derivative peak of the spectrum, and all XANES spectra were linearly calibrated using the difference between the obtained E 0 and the tabulated absorption edge energy for Mn K- edge (6539 ev). 8
9 Normalized Absorption (a) Discharged Charged Pristine Mn(+4) Mn(+3) Mn(+2.66) Energy (ev) Normalized Absorption (b) Discharged Charged Pristine MgMn 2 O Energy (ev) Figure S6. (a) O K- and (b) Mg K-edge X-ray absorption spectra of pristine, oxidized (charged) and reduced (discharged) obtained by the TFY mode. 9
10 (a) * (101) * (103) (211) * * (105) (312) (321) (224) Intensity (arb. unit) Discharged to -0.3 V Discharged to -0.2 V Discharged to -0.1 V Discharged to 0 V Charged to 1 V Pristine Mg x Mn 3-x O Scattering Angle (2θ ) Intensity (arb. unit) (b) (c) Discharged to -0.3 V Discharged to -0.2 V Discharged to -0.1 V Discharged to 0 V Charged to 1 V (101) Scattering Angle (2θ ) (200) (103) (211) Scattering Angle (2θ ) Pristine Mg x Mn 3-x O 4 Figure S7. (a) Structural change of Mg0.5Mn2.5O4 by charge (oxidation) and subsequent discharge (reduction), collected by laboratory XRD. *: peaks from the XRD holder or current collectors. Detailed view around (b) (101) and (c) (200), (103), and (211) peaks showed partially reversible structural changes between tetragonal spinel and layered phases. 10
11 11
12 Figure S8. HRXRD pattern of the Mg0.5Mn2.5O4 nanocrystals after oxidation in aqueous electrolytes. HRXRD was originally collected by high-energy X-rays (λ = Å) and then converted to the energy of averaged Cu Kα (λ = Å), to enable comparison with other figures. 12
13 (a) Intensity (arb. unit) Li Ch100 Ch100 Mg 0.5 Mn 2.5 O 4 (Pristine) Scattering Angle (2θ ) (b) Intensity (arb. unit) Ch100 Mn 3 O 4 (Pristine) Scattering Angle (2θ) Figure S9. S-XRD of (a) Mg0.5Mn2.5O4 and (b) Mn3O4 at the pristine and oxidized states. In the case of Mg0.5Mn2.5O4, oxidations carried out in Mg 2+ aqueous and Li + non-aqueous electrolytes are compared, labeled consistently with Figure 4. Diffraction was originally collected by high-energy X-rays (λ = Å) and then converted to the energy of averaged Cu Kα (λ = Å) to enable comparisons with other figures. 13
14 4.0 Voltage (V vs. Li + /Li 0 ) Specific Capacity (mah/g) Figure S10. Galvanostatic discharging of oxidized Mg0.5Mn2.5O4 nanocrystals in a Li half-cell configuration. The oxidation of the Mg0.5Mn2.5O4 nanocrystals was carried out in aqueous electrolytes containing a Mg salt, washed and dried prior to loading in the Li metal cell. The experiment was conducted at C/20. 14
15 2nd 10th 3rd 0.8 1st (a) Voltage (V vs. SCE) rd th 2nd 1st Specific Capacity (mah/g) Intensity (arb. unit) (b) * (101) * (112) (200) (103) (211) (004) * (220) (105) (312) (321) (224) (400) * 2nd discharge 2nd charge 1st discharge 1st charge Pristine Scattering Angle (2θ ) Figure S11. (a) Extended galvanostatic cycling of Mg0.5Mn2.5O4 between 0.9 and -0.4 V (vs. SCE). (b) Laboratory XRD patterns collected in the fully oxidized (charged) and reduced (discharged) states collected during the first two cycles, showing a reversible spinellayered transition. (*: peaks from the XRD holder or current collectors) 15