Abstract. Determine mechanical properties of finished cold formed structural hollow section (CFSHS) (WP1).
|
|
|
- Moses Bates
- 6 years ago
- Views:
Transcription
1
2
3 Abstract Structural hollow sections on the market are classified into three groups based on the manufacturing method: hot formed, hot finished and cold formed. Common arguments against the safe use of coldformed hollow sections are that mechanical properties of cold-formed hollow sections are inhomogeneous around perimeter due to difference in strain hardening during cold forming. Cold forming reduces impact toughness of cold-formed hollow sections, which restricts the use of them at low temperatures. The tensile plastic elongation of a cold formed hollow section is lower and depends on the location in the sections. This may restrain the use of plastic design methods, which require adequate amount of ductility. There may be microcracks in the corners of cold-formed hollow sections, which will reduce safety of the structure and fatigue properties. The overall objective of Design rules for cold formed structural hollow sections project is to validate whether these argument are meaningful in the design of welded connection from cold formed structural hollow sections. This overall objective is divided to following more detailed objectives: Determine mechanical properties of finished cold formed structural hollow section (CFSHS) (WP1). Determine rotation capacity and limits for cross-section classification required in plastic analysis for CFSHS (WP2). Determine reliable design rules for welded tubular connections using CFSHS (WP3A). Extend applicability of design rules for welded tubular connections for CFSHS having b/t > 35 (WP3B). Determine requirements for reliable welding of CFSHS connections (WP4). The research work was divided into four work packages. Summary of the work done in these is presented in following paragraphs: WP1 MECHANICAL AND TOUGHNESS PROPERTIES OF CFSHS (CHAPTER 2) Characteristic properties of cold-formed hollow section differ from hot-formed and hot-finished hollow sections. In cold-formed structural hollow section (CFSHS) mechanical and ductility properties vary around the section, while cold forming rate differs in different parts of the section. The strength and deformation capacities are decreased at least in the cold-formed corner areas. Extensive test programme has been executed to determine mechanical and toughness properties of CFSHS. Aim of this work has been to show the actual characteristics of CFSHS at European market and verify requirements set in product standard EN 1219 and in Eurocode 3, Part 1.1 for the steel material. The test programme was composed of cold-formed structural hollow sections from five different manufacturers of cold-formed sections in Europe. Requested steel grade for most of sections was S355. For comparison three hot-formed hollow sections and four cold formed from higher strength steel grade S46 were included in the test programme. The whole test programme contained 51 sections and 15 different section sizes. For each section following measurements and tests were carried out: Cross-sectional dimensions of each CFSHS were measured. Chemical analysis was made to determine chemical content of base material. 3
4 Tensile test coupons were manufactured from five different locations around perimeter: from the weld positions, from both faces and from two corners having either minimum or maximum corner radius. For three sections, which were used to determine deviation of properties around perimeter, altogether 13 coupons were manufactured around half of the perimeter. The toughness properties of hollow sections were determined by defining transition curve with Charpy V Notch (CVN) impact tests. In addition also influence of welding to brittle fracture possibility at low temperatures was studied experimentally with test programme that is composed of coupon and whole section tension tests for welded and non welded specimen in room and at low temperatures. Altogether 14 whole section tension tests for five different section sizes were done at room and low temperature (- 6 o C) for non welded and welded sections. Some welded sections contained transverse weld pass in the mid-length of section done with TIG process to simulate heat input. Tensile test coupons from same sections were manufactured and tested. Both welded and non welded coupon from flat face and corner was tested in the room temperature and at -6 o C temperature. WP2 APPLICABILITY OF PLASTIC DESIGN FOR CFSHS MEMBERS AND STRUCTURES (CHAPTER 3) Some recent research work has raised doubts about applicability present cross section classification requirement for CFSHS in plastic design arguing that they do not satisfy the material ductility requirements of Eurocode 3, Part 1.1 or that they have not enough geometric ductility (ability to develop the needed large rotations keeping the plastic moment capacity). Applicability of present section classification limits for CFSHS in Eurocode 3, Part 1.1 are studied. In this research project, the ductility of hollow sections in general and CFSHS in particular has been studied both numerically and experimentally. Test programme has been executed and extensive amount of numerical analyses have been done to extend the experimental results. The objective has been to find understanding of the parameters, which influence the rotation behaviour of hollow sections. Ductility requirement for plastic design is proposed to be characterised by available inelastic rotation instead of rotation capacity even though there is connection between these two definitions. Experimental and numerical analyses has been carried out to describe different phenomena that have an effect on the ductility and rotation capacity. Modifications are proposed to current cross-section classification of hollow sections of Eurocode 3. A more demanding limit for cross-section class 1 is proposed, which includes interaction between the flange and web slenderness. Alternative design procedure for cross-section classification is given where the available rotation requirement is analysed structurally and compared to available inelastic rotation of members. Advanced approach, which is based on the concept of available inelastic rotation, av, is proposed for the global plastic design. The member performance may be analysed determined with experimentally verified analytical methods or numerically using calibrated FE simulation. Required and available inelastic rotations at plastic hinge location are compared directly. The required rotation has been studied with FE simulation for beams and portal frames. The available rotation for CFSHS is verified using different methods: calculation models, FE simulations and experimentally. Test results from literature are collected as test database, which has been extended with set of 2 bending tests. 4
5 WP3A APPLICABILITY OF DESIGN RULES FOR TUBULAR CONNECTION FROM CFSHS (CHAPTER 4) The design models for structural hollow section joints proposed in design provision are developed from tests with hot-formed structural sections (HFSHS) at room temperatures. Relatively few test results are available for cold-formed structural hollow sections (CFSHS) at low temperatures. High degree of cold forming may decrease the ductility in the corner areas for CFSHS. Due to this higher degree of cold forming, the yield strength of the corner is typically higher than that of the adjacent flat faces, where degree of cold forming is lower and consequently the yield strength is lower but ductility better. When the applicability of cold-formed structural hollow sections are considered, the ultimate loading carrying capacity shall not be the critical for the use of present design methods but the deformation capacity. The possible decrease in deformation capacity may not occur in room temperatures but in lower temperatures. The deformation capacity of the joint can be restricted by preventing the plastic deformation to take place. This will happened partly due to the gap geometry itself, where the free deformation of the chord face in transverse direction is prevented by adjacent brace members. The pretension of the chord member will decrease the deformation capacity of the joint as well. Thus pretension of the chord member was included in K- and X-joint tests series. Behaviour of CFSHS in welded connections is studied with K-joint and X-joint test in normal and at low temperatures. The test programme comprised of altogether 41 K-joint test and 32 X-joint tests. WP3B EXTENSION OF APPLICABILITY OF DESIGN RULES FOR TUBULAR CONNECTIONS (CHAPTER 5) Eurocode 3, Part 1.8 provides design guidelines for rectangular hollow sections joints made of members having b/t ratios smaller than 35. In practice, there is an increasing demand to use more slender sections. These sections are already regulated in technical delivery conditions such as EN 121 or EN The present product ranges of the manufacturers are however much wider, especially for cold formed sections. Design rules backed by experimental tests for K-Joints with gap made out of rectangular hollow sections (RHS) are given, for example, in Eurocode 3. Here, the allowable width-thickness ratio of welded RHS K-Joints with gap is limited to 35. In addition to the slenderness limits, Eurocode 3 gives a restriction for the gap size. In the framework of this research project 47, tests on K-joints with gap and with slenderness as well as gap sizes outside the range given in Eurocode 3 are carried out. The ultimate load and the load deformation behaviour had been determined. For high slenderness 2 and high width ratios buckling of the chord webs could be observed from the tests in case of gap sizes permissible in Eurocode 3. Because this failure mode has not to be considered for K-joints, the formula for T- and Y-joints for chord web failure is used for the design load prediction. For very small gap sizes, down to the minimum requirements for welding, either punching shear failure or brace effective width failure can be observed. For both failure modes, the influence of a reduced effective length could be observed in the tests. Another failure mode observed in the tests is the buckling of the compression brace, which appears if the width ratio < 1.. WP4 EFFECT OF WELDING IN COLD FORMED AREAS (CHAPTER 6) According to DIN 1714, Part 1, Edition 1988, ageing is a change of the properties of a material at or close to room temperature by movement of interstitial dissolved elements. In relation to welding in cold-formed areas, strain ageing is relevant. In addition to the preceding cold-forming, 5
6 strain ageing causes an increase in the yield strength, tensile strength and hardness, together with a decrease of strain, the reduction of area and the Charpy V notch impact energy. In the last few decades such restrictions have been formulated against dangerous strain ageing in different design provisions. In this project only the influence of strain ageing adjacent to the weld seam is to be investigated. Notch effects and geometrical influences such as single-layer welding are to be excluded or minimised in order to prevent any dominating influence of such conditions on the test process. A multi-layer weld would e.g. cause a normalising effect that would cover the ageing. On this basis, the bead-on-plate weld has been removed afterwards, so that only the influence of the thermal effect of the weld bead in the cold-formed area of the specimen - the strain ageing caused by welding - remains as an influencing parameter. The bead-on-plate weld is only regarded as an expedient for the generation of the ageing area typical for a weld seam. The shift of the transition temperature caused by welding (ageing effects) is investigated using Charpy V notch test (CVN tests) and cold-formed structural hollow sections. For the evaluation of brittle fracture, the notch was prepared in the zone reheated by welding. It was to be investigated, whether this reheating (ageing) influences the brittle fracture temperature. An extensive material analysis was carried out, in which transition temperatures at 27 J of the following material conditions were to be determined: base material (sampling location in flat area), base material (sampling location in curved area) and base material (sampling location in curved area, artificially aged). For each material condition, about 18 tests are carried out to obtain sufficient data for statistical analysis. Welding in cold-formed areas is also an open question for for dynamically loaded structures (fatigue resistance). Especially for structural joints made of hollow sections with large widthratios b 1 /b, it is often necessary to weld in the areas close to the edges. A lot of these structures are subjected to dynamic loading. Therefore the fatigue behaviour of welded (notched) and nonwelded (un-notched) test specimens made of different steel grades and wall thicknesses are compared directly with each other to determine, whether a weld notch influences the fatigue behaviour in cold-formed regions of hollow sections and if so, to what extent. The intention of all tests was to find out, whether there is a difference in the fatigue behaviour of artificial aged specimens and non-aged specimens. It was not the intention to get an absolutely correct fatigue curve for square hollow sections under unusual loading conditions as they have been used during the tests. The fatigue tests were carried out as 4-point-bending-tests, both on welded and unwelded specimens for comparison. The weld seam was removed before the tests by grinding. 6
7 Contents Abstract 3 Contents 7 1 Introduction Structural hollow sections Hot formed hollow sections Project 1 2 Mechanical and toughness properties of CFSHS Introduction Test programme Chemical composition Geometrical dimensions Mechanical properties Testing Effect of cold forming on mechanical properties Effect of welding and low temperature Requirements of product standard EN Ductility requirements for steel material in Eurocode Toughness properties Testing and evaluation Analysis of results 36 3 Applicability of plastic design for CFSHS members and structures Introduction Ductility of hollow sections Ductility of cross section defined by available inelastic rotation Influence of load type and moment gradient Influence of plate slenderness and aspect ratio Experimental and numerical verification Influence of manufacturing method Required inelastic rotation at the structural level Influence of lateral restraints Recommendation for cross-section classification Current cross-section classification Modified proposal for classification limit in class Guidance for plastic design Alternative approach based on available and required rotation checking Numerical evaluation of available inelastic rotation Design models for available inelastic rotation Conclusions 73 4 Applicability of design rules for tubular connection from CFSHS Introduction Methods and materials Analysing methods Materials Experimental tests Test specimen Test set up 8 7
8 4.4 Test Results Evaluation of test results Conclusions and recommendation 91 5 Extension of applicability of design rules for tubular connections Aim of the investigation Test programme Test set-up Test rig, measuring equipment and test set-up Load introduction Measuring arrangement and measuring methods Fabrication and geometry of test specimens Material properties General observations and results from test Influence of the gap size parameter g and the width ratio on the load carrying behaviour Influence of the thickness ratio on the load carrying behaviour Influence of brace inclination on the load carrying behaviour Influence of material properties on the load carrying behaviour Influence of imperfections Annotation to some test results Calculation of welded connections between rectangular hollow sections according to pren Modified analytical model for (reduced) punching shear failure Comparison of test results with calculation results according to pren Conclusions Numerical investigations Effect of welding in cold formed areas Introduction and aims Test specimens Hollow sections Mechanical-technological data Chemical analysis Welding Metallography Charpy V notch impact (CVN) tests Fatigue tests Recommendations and Future work General conclusions 139 Technical Annex 145 References 147 8
9 1 Introduction 1.1 Structural hollow sections Structural hollow sections on the market are classified into three groups based on their manufacturing method: hot formed, hot finished and cold formed. Hot formed sections are extruded from continuously cast rounds and the final section is longitudinally seamless. Both hot finished and cold formed are roll formed from the steel strip into circular or directly rectangular shape and weld edges of strip longitudinally together. The external weld is usually cleaned off mechanically to improve the external appearance of the tube. In hot finished hollow sections the mother pipe is reheated to rolling temperature before shaping into final circular, square or rectangular shape. For cold formed hollow sections sizing and shaping is done without reheating. The hot-formed and hot finished are considered similar from the material characteristics of final product, even though form of initial billet and the whole manufacturing are different. Still the product standard EN 121 [1-1] covers them both. Product standard for cold-formed structural hollow sections is EN 1219 [1-2]. Soininen [1-3, 1-4] has stated that the most common arguments against the safe use of cold-formed hollow sections are: The mechanical properties of cold-formed hollow sections are inhomogeneous around perimeter due to difference in strain hardening during cold forming. The tensile plastic elongation of a cold-formed hollow section is lower and depends on the location in the sections. In hot formed and hot finished sections mechanical properties are homogenous over the whole cross section. There may be microcracks in the corners of cold-formed hollow sections, which will reduce safety of the structure and fatigue properties. Therefore allowance of welding on cold-formed corner region is limited in design rules. Cold forming reduces impact toughness of cold-formed hollow sections, which restricts the use of them at low temperatures. These arguments are used also in promotions of hot formed and hot finished hollow sections against cold-formed sections. Cold formed hollow sections have some advantage, which have made them competitive against hot formed and hot finished hollow sections. The manufacturing method needs less energy and manufacturing lines are more compact and less expensive. Cold formed hollow section can be produced with tighter tolerances and they have better surface quality Hot formed hollow sections Thus there exist different processes in production of hot formed hollow sections in principle hot formed hollow sections are manufactured in following manner: Continuously cast heated rounds are shaped into hollows in press or rolling mill. The temperature of round is between 115 and 13 o C. A piercing mandrel is inserted into shell to shape the hollow in required diameter and thickness. 9
10 These circular shells are reheated before forming into the final dimensions and circular, square or rectangular tube shape. Cold forming of hollow sections The cold forming process of hollow section may be divided into following phases: Pre-mill Preparation - The strip is uncoiled and fed through another set of levelling rollers and a guillotine trims the ends of the strip. Welding joins the strips, the edges are trimmed and they are recoiled as the raw material for the forming mill. Cold Forming and Welding - Two alternative possibilities exists for cold-forming. The final shape is reached through circular mother pipe or direct cold forming into square or rectangular shape. Series of forming rolls forms the flat steel into mother tube. The steel is not heated and this gradual cold forming process enhances the strength of the steel and allows for very tight dimensional tolerances. The strip edges are heated by either high frequency (HF) induction or electric resistance welding and then forged together by weld rolls to create a continuous longitudinal weld without the addition of filler metal. The most common welding process is the electric resistance welding, where the edges of the strip are heated normally by high frequency electrical current. The weld seam is then cooled and processed. Special scarping tools remove the external weld flash and the pipe is cooled uniformly in a cooling trough. Because weld quality is absolutely vital to the quality of the end products, its integrity is checked and any tube that does not measure up is registered as reject material. The weld seam of thicker section may be heat treated, normalised just after welding by inductive heating. This heat treatment is normally covers an area about 1 mm on the both sides of the weld. In direct forming in square or rectangular shape forming dies progressively shape the flat strip by forming the top two corners of the square or rectangular tube. Subsequent stations form the bottom two corners. No cold working of the sides of the shape is performed, and the shape s seam is welded by high-frequency contacts when the tube is near its final shape and size. The welded tube is cooled and then driven through a series of sizing rolls. Sizing and Shaping - The tube then enters the sizing and shaping stations where rolls turn it into products such as square and rectangular hollow sections. These sections are then cleaned and degreased before entering the in-line painting process. Hot finished hollow sections The manufacturing process for hot finished sections is similar to cold-formed hollow sections. The steel strip is shaped into either open pipe or directly rectangular section in multi stand cold forming process. The longitudinal edges of strip are connected to each other with welding. In high frequency induction (HFI) welding short distance of edges is heated in welding temperature and pushed together using pressure rolls. The external weld reinforcement is removed using special grinders. Internal weld reinforcement may be removed also. Before hot finished hollow section is shaped into final circular, square or rectangular shape, the mother pipe is reheated inductively to rolling temperature. 1.2 Project In the design recommendations such as Eurocode 3 Design of steel structures (EN ) (1-3) requirements are set for mechanical properties of steel material to ensure adequate deformation capacity needed in plastic design. Requirements cover minimum values for tensile strength to yield strength ratio f u /f y, elongation at fracture A 5 and uniform elongation at maximum force u / y. Numerical values for these requirements differ in different provisions. 1
11 Tests on welded joints of cold formed and hot formed hollow section show that the observations from the tests do not correlated with these requirements. Welded connections from cold-formed hollow sections [1-3] have shown to have sufficient resistance and deformation capacity even at low temperatures. Thus the requirements set for the base material are not fulfilled in the corner areas due to cold forming. These tests also have shown that chemical composition and welding parameters seems to have significant influence on the ductile behaviour of the joint independent on fulfilment of requirements for base material. Therefore the objective of Design rules for cold formed structural hollow sections project is to validate whether these requirements set for mechanical properties of the base material are meaningful in the design of welded connection from cold formed structural hollow sections. Utilisation of plastic design for both structures such as beams and welded connections is trusses are considered. Restriction to welding in the cold-formed area is studied separately. Eurocode 3, Part 1.8 Design of joints (EN ) [1-4] provides design guidelines for rectangular hollow sections joints made of members having b/t ratios smaller than 35. In practice, there is an increasing demand to use more slender sections. The present product ranges of the manufacturers are however much wider, especially for cold-formed sections. Therefore extension of this b/t ratio is of interest. In general the overall objective of Design rules for cold formed structural hollow sections project can be stated in the form: to obtain reliable and economical design rules for cold formed structural hollow sections (CFSHS) This is obtained by verifying available design rules given in Eurocode 3 and developing new design rules for these European design provisions. The study subjects set for the project this general objective is divided to following more detailed objectives: 1. Determine mechanical properties of finished cold formed structural hollow section (CFSHS) (WP1). 2. Determine rotation capacity and limits for cross-section classification required in plastic analysis for CFSHS (WP2). 3. Determine reliable design rules for welded tubular connections using CFSHS (WP3A). 4. Extend applicability of design rules for welded tubular connections for CFSHS having b/t>35 (WP3B). 5. Determine requirements for reliable welding of CFSHS connections (WP4). Research work in the project was divided into four main work packages (WP) to obtain their detailed objectives (Figure 1-1). Work package WP3 considering tubular connections is divided into two parts WP3A and WP3B depending on the objective set for research. Collaborating partners in each work packages are shown in Table 1-1. The first partner in each is responsible one for the work in that specific work package. 11
12 WP2 Deformation capacity LABEIN University of Pisa University of Navarra (AC to LABEIN) WP3A WP3B Tubular connections University of Pisa University of Karlsruhe Lappeenranta University of Technology (SC to VTT) WP4 Welding University of Karlsruhe Voest-Alpine Krems (SC to Karlsruhe) WP1 Material properties Rautaruukki Metform (SC to VTT) VTT Technical Research Centre of Finland Figure 1-1. Division of project into Work Packages and partners involved in the research work in each Work Package. Table 1-1. Work packages and partners involved in research. Work package WP1 Material properties WP2 Deformation capacity WP3 Tubular connections WP3A Applicability of design rules WP3B Extension of applicability WP4 Welding WP5 Management and co-ordination SC - Subcontractor AC - Associated contractor Partners Rautaruukki Metform (SC to VTT) VTT Technical Research Centre of Finland LABEIN University of Navarra (AC to LABEIN) University of Pisa Lappeenranta University of Technology (SC to VTT) University of Pisa University of Karlsruhe University of Pisa Voest-Alpine Krems (SC to Karlsruhe) University of Karlsruhe VTT Building and Transport Voest-Alpine Krems (SC to Karlsruhe) VTT Technical Research Centre of Finland 12
 mechanical and ductility properties vary around the section, while cold forming rate differs in different parts of the section.")
13 2 Mechanical and toughness properties of CFSHS 2.1 Introduction Characteristic properties of cold-formed hollow section differ from hot-formed and hot-finished hollow sections. In cold-formed structural hollow section (CFSHS) mechanical and ductility properties vary around the section, while cold forming rate differs in different parts of the section. The strength and deformation capacities are decreased at least in the cold-formed corner areas. Extensive test programme has been executed to determine mechanical and toughness properties of CFSHS. Aim of this work has been to show the actual characteristics of CFSHS at European market and verify requirements set in product standard EN 1219 (2-1) and in Eurocode 3, Part 1.1 (pren )(2-2) for the steel material. The test programme was composed of cold-formed structural hollow sections from five different manufacturers of cold-formed sections in Europe. Requested steel grade for most of sections was S355. For comparison three hot-formed hollow sections and four cold formed from higher strength steel grade S46 were included in the test programme. The whole test programme contained 51 sections and 15 different section sizes. Mechanical properties around section and toughness properties from flat face were determined. 2.2 Test programme The whole test programme and sections are shown in Table 2-1. For each section size slenderness rations are given. Section sizes from different manufacturers A, B, C, D and E are shown in different columns. Also hot-formed (HF) section and high strength steel (S46) section sizes are included. Section sizes in the additional test programme are given in the column AD. Altogether 51 sections were enclosed to the programme containing 15 different section sizes. The tests reported in this report are also collected to Table 2-2 showing also the section number used to identify different sections. As an example cross-sections of test series B and AD are shown in Figure 2-1. Figure 2-2 division into different slenderness ranges according to non-dimensional parameter (H+B)/2T, which is used to describe cross-sectional size. B AD Figure 2-1. Sections in test series B and AD are shown. 13
14 Table 2-1. The whole test programme is given containing section sizes and different manufacturers for test specimen in WP1. Section Section size H/T B/T H/B Test series 1 name HxBxT A B C D E HF 46 AD RHS1 5x5x T T RHS1 5x5x TC TC TC RHS2 1x1x T T T T T RHS2 1x1x TC TC TC TC RHS2 1x1x TC TC TC TC T13 RHS2 1x1x TC 2 TC TC TC TC RHS2 1x1x TC TC TC TC RHS3 15x15x TC TC TC TC RHS4 2x2x TC TC RHS5 3x3x TC RHS5 3x3x TC RHS6 2x1x T13 RHS6 2x1x TC TC TC TC T13 RHS6 2x1x TC TC RHS7 16x16x TC TC T five tensile coupons around perimeter C Transition curve with Charpy V notch specimen T13 Detailed tensile property distribution. 13 coupons around half of the perimeter. 1 Manufacturers A/B/C/D/E, hot-formed HF, S46 steel grade S46, additional tests AD 2 Deviation of results in the same specimen and effect of testing speed (Four additional sections) CF S46 HF S CF S355 Number of sections < (H+B)/2T < Figure 2-2. Number of specimen with different slenderness ratio in the test programme is shown. Slenderness is depicted with non-dimension ratio (B+H)/2T. 14
15 Table 2-2. Identification of test sections is given for the whole test programme. Section code Manufacturer A, B, C, D, E Size of specimen HxBxT Informed Steel grade Tensile coupon test S1 A 1x1x3 S355J2H 1 W, 2 H, 3 B, 4 Rmax, 5 Rmin Toughness with impact tests S2 A 1x1x5 S355J2H 1 W, 2 H, 3 B, 4 Rmax, 5 Rmin Charpy V Notch S4 A 1x1x6 S355J2H 1 W, 2 H, 3 B, 4 Rmax, 5 Rmin Charpy V Notch S5 A 1x1x8 S355J2H Test speed 1. S6 A 1x1x8 S355J2H Test speed 2. S7 A 1x1x8 S355J2H Test speed 3. S8 A 1x1x8 S355J2H 1 W, 2 H, 3 B, 4 Rmax, 5 Rmin Charpy V Notch S9 A 1x1x8 S355J2H Test speed 4. S1 A 1x1x8 S355J2H Test speed 5. S14 A 1x1x1 S355J2H 1 W, 2 H, 3 B, 4 Rmax, 5 Rmin Charpy V Notch S15 A 15x15x8 S355J2H 1 W, 2 H, 3 B, 4 Rmax, 5 Rmin Charpy V Notch S16 A 2x2x1 S355J2H 1 W, 2 H, 3 B, 4 Rmax, 5 Rmin Charpy V Notch S17 A 3x3x6 S355J2H 1 W, 2 H, 3 B, 4 Rmax, 5 Rmin Charpy V Notch S18 A 3x3x12.5 S355J2H 1 W, 2 H, 3 B, 4 Rmax, 5 Rmin Charpy V Notch S19 A 2x1x8 S355J2H 1 W, 2 H, 3 B, 4 Rmax, 5 Rmin Charpy V Notch S2 A 2x1x1 S355J2H 1 W, 2 H, 3 B, 4 Rmax, 5 Rmin Charpy V Notch S21 B 5x5x3 S355J2H 1 W, 2 H, 3 B, 4 Rmax, 5 Rmin S22 B 5x5x5 S355J2H 1 W, 2 H, 3 B, 4 Rmax, 5 Rmin Charpy V Notch S23 B 1 1x1x3 S355J2H 1 W, 2 H, 3 B, 4 Rmax, 5 Rmin S24 B 1 1x1x5 S355J2H 1 W, 2 H, 3 B, 4 Rmax, 5 Rmin Charpy V Notch S25 B 1x1x6 S355J2H 1 W, 2 H, 3 B, 4 Rmax, 5 Rmin Charpy V Notch S26 B 1x1x8 S355J2H 1 W, 2 H, 3 B, 4 Rmax, 5 Rmin Charpy V Notch S28 B 1x1x1 S355J2H 1 W, 2 H, 3 B, 4 Rmax, 5 Rmin Charpy V Notch S29 B 15x15x8 S355J2H 1 W, 2 H, 3 B, 4 Rmax, 5 Rmin Charpy V Notch S3 B 2x2x1 S355J2H 1 W, 2 H, 3 B, 4 Rmax, 5 Rmin Charpy V Notch S31 B 2x1x8 S355J2H 1 W, 2 H, 3 B, 4 Rmax, 5 Rmin Charpy V Notch S32 B 2x1x1 S355J2H 1 W, 2 H, 3 B, 4 Rmax, 5 Rmin Charpy V Notch S33 C 1x1x5 S355J2H 1 W, 2 H, 3 B, 4 Rmax, 5 Rmin Charpy V Notch S34 C 2x1x8 S355J2H 1 W, 2 H, 3 B, 4 Rmax, 5 Rmin Charpy V Notch S35 C 16x16x6 S355J2H 1 W, 2 H, 3 B, 4 Rmax, 5 Rmin Charpy V Notch S36 D 1x1x8 S355JH 1 W, 2 H, 3 B, 4 Rmax, 5 Rmin Charpy V Notch S37 D 1x1x1 S355JH 1 W, 2 H, 3 B, 4 Rmax, 5 Rmin Charpy V Notch S38 D 15x15x8 S355JH 1 W, 2 H, 3 B, 4 Rmax, 5 Rmin Charpy V Notch S39 D 2x1x8 S355JH 1 W, 2 H, 3 B, 4 Rmax, 5 Rmin Charpy V Notch S4 E 5x5x3 S355J2H 1 W, 2 H, 3 B, 4 Rmax, 5 Rmin S41 E 5x5x5 S355J2H 1 W, 2 H, 3 B, 4 Rmax, 5 Rmin Charpy V Notch S42 E 1x1x3 S355J2H 1 W, 2 H, 3 B, 4 Rmax, 5 Rmin S43 E 1x1x6 S355J2H 1 W, 2 H, 3 B, 4 Rmax, 5 Rmin Charpy V Notch S44 E 1x1x1 S355J2H 1 W, 2 H, 3 B, 4 Rmax, 5 Rmin Charpy V Notch S45 E 16x16x6 S355J2H 1 W, 2 H, 3 B, 4 Rmax, 5 Rmin Charpy V Notch S46 B 1 1x1x3 S46 1 W, 2 H, 3 B, 4 Rmax, 5 Rmin S47 B 1 1x1x5 S46 1 W, 2 H, 3 B, 4 Rmax, 5 Rmin Charpy V Notch S48 B 1x1x6 S46 1 W, 2 H, 3 B, 4 Rmax, 5 Rmin Charpy V Notch S49 B 1x1x8 S46 1 W, 2 H, 3 B, 4 Rmax, 5 Rmin Charpy V Notch S5 HF 5x5x5 S355J2H 1 W, 2 H, 3 B, 4 Rmax, 5 Rmin Charpy V Notch S51 HF 1x1x8 S355J2H 1 W, 2 H, 3 B, 4 Rmax, 5 Rmin Charpy V Notch S52 HF 15x15x8 S355J2H 1 W, 2 H, 3 B, 4 Rmax, 5 Rmin Charpy V Notch S53 A 1x1x3 S355J2H 1 W, 2 H, 3 B, 4 Rmax, 5 Rmin S54 A 1x1x6 S355J2H 13+1 coupons Charpy V Notch S55 A 2x1x8 S355J2H 13+1 coupons S56 A 2x1x4 S355J2H 13+1 coupons 1 Sections were directly cold formed into rectangular shape from the strip. 15
16 For each section following measurements and tests were carried out: Cross-sectional dimensions of each CFSHS were measured. Chemical analysis was made to determine chemical content of base material. Tensile test coupons were manufactured from five different locations around perimeter: from the weld positions, from both faces and from two corners having either minimum or maximum corner radius. For three sections, which were used to determine deviation of properties around perimeter, altogether 13 coupons were manufactured around half of the perimeter. The toughness of hollow sections was determined with Charpy V Notch (CVN) impact tests. The transition curve was determined with three specimen in single temperature for sections having material thickness larger or equal than 5 mm Chemical composition Carbon equivalents CEV and P CM (Figure 2-3) are calculated to describe characteristic of base material and weldability of steels based on chemical composition of steels. CEV is calculated with equation CEV Mn Cr Mo V Cu Ni C (2-1) P CM is calculated with equation. Si Mn Cu Cr Ni Mo V P CM C 5B (2-2)
17 .5 A CEV CEV (%) B CEV C CEV D CEV E CEV HF CEV S46 CEV (H+B)/2T Figure 2-3. Carbon equivalent CEV and P CM values for hollow sections in the test programme given as function of section slenderness. PCM (%) A PCM B PCM C PCM D PCM E PCM HF PCM S46 PCM (H+B)/2T Geometrical dimensions Cross-sectional dimensions were measured from each section according to instruction given in EN The measurement of width, height and thickness is quite obvious. Instead corner region widths are measured according to instruction in EN Then the external corner radius R is calculated as the average value from the corner measurements a i, b i, c i and d i. Therefore the true internal and external corner radius were measured with radius templates. Also thickness of corner area is measured from corner coupons. Following conclusion can be drawn from the measurement of overall geometrical dimensions: The overall dimensions of sections fulfilled tolerance in the product standard EN The thickness of sections depends on the coil thickness used to produce the section. The normalised thickness measurements are compared to tolerances of EN 1219 in Figure 2-4. The average values are well within requirements set in EN The value that falls below minimum tolerance is for hot-formed section. Judgement of corner radius is more challenging, while in practise the widths of corner area are measured not the radius and there is large deviation in the widths. Figure 2-5 shows normalised corner width values as function of thickness that can be compared to the EN 1219 tolerances. The average of all corner width measurement from section is used as base value. The error bars show the minimum and maximum corner width value from the respective section. The deviation of widths within single section can be very large. Some of the values fall clearly below the tolerance set in EN
18 T av /T nom A B C D E.9 HF EN 1219: Thickness tolerances MAX MIN T av (mm) Figure 2-4. Comparison of measured thickness to tolerances set in EN 1219 for thickness. Thickness is average of eight measurements from flat faces of hollow section. Error bars show maximum and minimum values within these measurements C av /T av A B C D E HF.5 EN 1219: External corner profile tolerances MAX MIN T av (mm) Figure 2-5. Average of measured corner area widths compared to tolerances set in EN Average value is calculated from two widths available for each corner. The error bars show minimum and maximum values within corner area widths from one section. The green dots show values for hotformed sections. Dimensions of corner region and corner radius relate to condition in Eurocode 3, Part 1.8 (pren :23) for welding in the cold formed zones or adjacent to them. According to clause 4.14 (1) welding may be carried out within a length 5t either side of the cold formed zone provided that the cold formed zones are normalised after cold forming but before welding or the r/t ratios satisfy requirements set in given Table 4.2. These conditions are compared against measured internal corners to material values thickness in Figure
19 min R int /T av A B C D E.25 pren : Table 4.2 MAX T T av (mm) Figure 2-6. Evaluation of measured corner radius dimensions against limitation to welding in the coldformed zone according to pren The minimum of actual internal corner radius measured with corner gauges is used in the comparison. T av is the average thickness from all thickness measurements around section. 2.3 Mechanical properties Testing Mechanical properties are determined from tensile coupon tests according to EN Three sections were enclosed to test programme to determine the deviation of properties around perimeter of section in more detail. Deviation was determined with altogether 14 coupons; one from the location of weld seam and thirteen around the half of the perimeter of the section (Figure 2-7 S54 and S56). These coupon are located in following positions: Centres of three faces: one in the face of seam weld (Coupon 11), one opposite to that (Coupon 23) and one perpendicular to these (Coupon 17) and Both corners (Coupon 14 and 2). Coupons located to both sides of the corner in the way that the other edge of the coupon is located in position where the corner area starts (Coupons 13 and 15 for corner 14 and Coupons 19 and 21 for corner 2). Coupon located in the faces 1/3 or 1/4 of width from the corner seam weld face (Coupon 12), face next to that (Coupons 16 and 18) and face opposite to that (Coupon 22). From section of the main test programme tensile test coupons were manufactured from five positions around the perimeter of CFSHS (Figure 2-7 right). The seam weld is located in the middle of the W coupon (Coupon 1 W). The coupons from flat elements H (Coupon 2 H) and B (Coupon 3 B) are positioned in the middle of the side of specimen. 19
20 The corner coupons are manufactured from two corners: Rmax from the corner where the largest corner radius was measured (Coupon 4 Rmax) and Rmin from the corner where smallest corner radius was measured (Coupon 5 Rmin) B/ B/ H/4 12 Position: 1 W Position: 5 Rmin H/ W 1 W Charpy V Test specimen Position: 2 H S54 1x1x6 Position: 4 Rmax Position: 3 B S56 2x1x4 Figure 2-7. Location and designation of coupon test specimen in the sections S54 and S56 to determine detailed distribution and in the section of the main test programme. Note: the location of weld in reality is usually in the H face of section. H coupon is chosen opposite to longitudinal weld. The coupons were dimensioned according to instruction given in testing standard EN 12. The width of the corner coupons was equal to the average value of internal radius for the section but not less than 5 mm. The internal radius was calculated from external radius obtained with the widths of the corner area and average thickness of the section. The width was rounded to full millimetre value. The corner coupon is positioned in the middle of the corner area. The billets for coupons machined directly from the section. The ends of the corner coupons and weld coupon were machined before testing to avoid eccentricity in the testing. The tensile tests were carried out according to standard EN 12 at displacement control. The test speed was 5% of the allowable maximum specified by EN 12. In the elastic range up to strain level 1.% used straining rate (mm/min) corresponding to stressing rate was 15 N/mm 2 s -1 and after the corresponded that straining rate.4 1/s. The force-elongation values recorded during loading were transferred to engineering stress strain curve. The force is divided with nominal coupon area and strain is calculated from proportional elongation. Mechanical properties are determined from these stress-strain curves according to EN Following notes are on the determination of values: R p.2 proof strength corresponding to.2% permanent extension is determined with nominal elastic modulus E = 21 N/mm 2. This has an effect on the proof stress value depending on the true elastic modulus; when it is higher the proof stress is overestimated using nominal elastic modulus and when it is lower the proof stress is underestimated. In the determination of A gt percentage of total elongation at maximum force the shape of engineering stress strain curves influences the results. Especially the coupons from flat faces do not exhibit clear elongation when the necking initiates. The range of elongation around maximum force can be large. The shifting in measurement system makes determination of absolute maximum difficult. The location of fracture in the coupon may have an effect on the value of A 5 percentage of elongation after fracture determined from coupon. When the fracture is not located in the middle of 2
21 the coupon the measurement length for A 5 has to be chosen in the way that the extension is measured from the narrow part of coupon non centric to fracture position. In weld coupon (1 W) the area of seam weld is not taken in to consideration in the area of coupon. Stress is determined dividing the force with area obtained with thickness and width of the coupon has been measured. Therefore the stress value may be larger than in reality Effect of cold forming on mechanical properties The cold forming of steel strip as hollow section has an influence of the mechanical properties of hollow cross-section. In principle cold forming increases the stress level and decreases elongation values. The cold forming rate varies in different part of the cross section. The cold forming into circular mother tube has about the same influence through the perimeter of the shell. Some variation may occur near the edges. Most of the cold work is done in shaping the section from circular mother tube into rectangular shape. The largest cold forming rates are found in the corners of the section. Also welding of the longitudinal seam influences mechanical properties. The distribution of mechanical properties around section was studied with three section sizes having different slenderness ratios: b/t = 12.7, 16.7 and 25. As described in Chapter tensile test coupons were manufactured from different positions around half of the perimeter of section. Engineering stress-strain -curves from tests is shown in Figure 2-8 to characterise changes in stress strain relationship due to cold forming. The changes in characteristics of stress strain relationship due cold forming can be seen from the curves: Strength is increased. This influences both proof stress R p.2 and tensile strength R m. Elongation values are decreased. Uniform elongation before reaching the maximum force, where necking localises, is significantly lower in cold formed corners. Elongation at fracture are also lower, thus the localised elongation at necking before fracture seems be of same order. The cold forming has significant effect on the stress-strain relationship in the actual corner, where the cold forming rate is highest. Cold forming has influence on the properties of the flat face near the corner, but this region is equal to 1-2 times material thickness Strength properties The amount of increase in strength values is shown in Figure 2-9 for proof stress R p.2 and in Figure 2-1 for tensile strength R m. The ratio between minimum strength values found from the face to respective value from corners is drawn as function of section slenderness (B+H)/2T. Similar pattern is found from both figures; the lower the slenderness ratio is the smaller is increase in strength due to cold forming. The amount of cold forming to circular tube increases strength levels in low slenderness ration. Therefore difference between values from flat face and corners is smaller in lower slenderness. Respective comparison against material thickness T, corner radius R and corner radius to thickness ratio R/T, which depend on each other, shows, that the higher these value are the lower is increase in strength values due to cold forming. Some thinner section from manufacturer B having quite high slenderness was manufactured directly into rectangular shape, but these cases cannot be deviated from results. 21
22 E (N/mm 2 ) B/ H/ E (N/mm 2 ) B/ H/ W 1 W E (%) E (%) S56 2x1x4 A S355J2H B/T = E (N/mm 2 ) B/ H/ E (N/mm 2 ) B/ H/ W 1 W E (%) E (%) S54 1x1x6 A S355J2H B/T = B/ B/ H/ H/ W 1 W E (N/mm 2 ) E (N/mm 2 ) E (%) E (%) S55 2x1x8 A S355J2H B/T = 12.5 Figure 2-8. Influence of cold forming rate to engineering stress strain curves Elongation properties The cold forming has significant effect on the uniform elongation, before necking localises. Figure 2-11 shows the rations between elongation values at maximum force from flat faces compared to corners as function of section slenderness (B+H)/2T. Respectively effect of cold forming rate to elongation after fracture values is shown in Figure
23 Figure 2-9. Effect of cold forming in proof stress R p.2 around section as function of section slenderness (B+H)/2T. The proof stress in the corners is compared with minimum proof stress found from face of the section. R p2 : Ri / min(h,b) A 4Rmax A 5Rmin B 4Rmax B 5Rmin C 4Rmax C 5Rmin D 4Rmax D 5Rmin E 4Rmax E 5Rmin S46 4Rmax S46 5Rmin (H+B)/2T Figure 2-1. Effect of cold forming in tensile strength R m around section as function of section slenderness (B+H)/2T. The tensile strength in the corners is compared with minimum tensile strength found from face of the section. R m : Ri / min(h,b) A 4Rmax A 5Rmin B 4Rmax B 5Rmin C 4Rmax C 5Rmin D 4Rmax D 5Rmin E 4Rmax E 5Rmin S46 4Rmax S46 5Rmin (H+B)/2T Figure Effect of cold forming in elongation at maximum force A gt as function of section slenderness (B+H)/2T. The elongation at maximum force in the corners is compared with maximum elongation at maximum force found from face of the section. A gt : Ri / min(h,b) A 4Rmax A 5Rmin B 4Rmax B 5Rmin C 4Rmax C 5Rmin D 4Rmax D 5Rmin E 4Rmax E 5Rmin S46 4Rmax S46 5Rmin (H+B)/2T Figure Effect of cold forming in elongation after fracture A 5 as function of section slenderness (B+H)/2T. The elongation after fracture in the corners is compared with maximum elongation after fracture found from face of the section. A 5 : Ri / min(h,b) A 4Rmax A 5Rmin B 4Rmax B 5Rmin C 4Rmax C 5Rmin D 4Rmax D 5Rmin E 4Rmax E 5Rmin S46 4Rmax S46 5Rmin (H+B)/2T 23
24 2.3.3 Effect of welding and low temperature The heat input of welding affects mechanical properties, when CFSHS members are welded. Welding causes avoidable flaws, which may initiate brittle crack growth. Combined with low temperature the possibilities of brittle fracture or in general decreased ductility are to be considered also is welded connections. In cold-formed structural hollow section (CFSHS) mechanical and ductility properties vary around the section, while cold forming rate is different in different parts of the section. The strength is increased and deformation capacity is decreased in the corner areas due to work hardening during cold forming. The coupon test shows that the properties around section are different. Therefore whole section tension tests are used to evaluate the redistribution around section Test programme To determine effect of welding on mechanical properties on cold-formed material and to consider possibility of brittle fracture test programme presented in Table 2-3 was defined. The test programme contained following tests: Tensile tests are done for coupons made from sections with transverse weld. Whole section tension tests are made with specimen with similar transverse weld. These results are compared to similar tests for non-welded specimen. These tensile coupon tests and whole section tension tests for welded and non-welded specimen are done at both normal (+2 o C) and low temperature (-6 o C). Coupon tests to verify effect of welding and effect of low temperature are done with two coupons - one from flat face and one from corner area (2 H and 4 Rmin). Effect of low temperature on the mechanical properties of CFSHS is studied with two different section from different manufacturer to verify effect of steel strip content. Some whole section tension tests are carried out in normal temperature to verify average distribution of mechanical properties around the cross-section. For these sections detailed distribution around section is determined with 13 coupons located around half of the perimeter of section. Table 2-3. Contents of the additional test programme. The number in each cell shows amount of tests done for this section. No of test Non welded specimen Welded specimen Test type Coupon test Whole section tension test Coupon test Whole section tension test Test temperature x1x x1x x1x From two manufacturer A and B to study effect of base material. 2 Same whole section tension test results are used for both comparison. 24
25 Welding In the welding of transverse pass around hollow section specimen MAG (135) process was replaced by TIG (14) process in order to avoid the need for surface machining after welding. In TIG-welding the adjustable parameters are travel speed and current. If the heat input in TIG-process is the same as in MAG-process, the throat thickness a of fillet weld in MAG-welding can be estimated by the following simple semi empirical formula U I a 5 v (2-3) The measured welding process parameters and calculated values are seen in Table 2-4. Thermo couples measured the maximum root side temperature during the weld process. The passes are welded without consumables except the case of tube with wall thickness of 1 mm, where additional filler material was used in order to avoid the decreasing of the wall thickness caused by TIG process. Table 2-4. The welding parameter Testing Tube U TIG [V] I TIG [A] v TIG [m/s] Q [kj/mm] a fillet [mm] T max,root [C] 1x1x x1x x1x Principle of test set-up for whole section tests is seen in Figure The end plates were connected to testing machine with pinned connections in one plane. During testing both overall extension over the testing length and local extension within specimen at varied length was measured. The local extension measurement length was increased because necking localised outside measurement length. Section was equipped with strain gauge in location of transverse weld. In the low temperature test also temperature of the specimen was controlled: the coolant liquid was circulating in the section long enough before testing. Figure 2-14 shows stress displacement curves from whole section tensile tests for section 1x1x1. L = 5 mm L local End plate Coolant circulation Insulate foam Weld Strain gauge Local displacement Applied force Total displacement Figure Principle of test and measurement arrangement in whole section tensile test. 25
26 stress [MPa] Stress-displacement curves 1x1x total displacement [mm] 111A 111B 111C 111D Figure Stress displacement curves from tests for section 1x1x1: A - is room temperature with no weld; B - low temperature with no weld; D - room temperature with transverse weld and C - low temperature with transverse weld. The low temperature testing for tensile coupons was done with testing equipment having cooling chamber. To ensure equal testing conditions for normal temperature testing all tensile tests for welded coupons and comparative test at normal temperature for non-welded coupons were done with the same testing equipment. The welding of sections for coupon tests was done in the same time as the section for whole section tension tests were welded. The marking of the positions for manufacturing was made clear to ensure that tensile test coupons are from the same corner and face. The bar of each section size was cut and marked to guarantee that the direction of sections was same Conclusions Whole section tensile tests and coupon tests are evaluated separately. The effect of low temperature and effect of welding are analysed from results. In the whole section tensile tests strength comparison is done from the maximum force. Thus also the stress corresponding to.2% proof stress is given. Ductility verification is done with total extension at fracture divided by the whole section length. In the coupon tests evaluation is based on mechanical properties: proof stress R p.2, tensile strength R m and uniform elongation at maximum force A gt and elongation at fracture A 5. Following conclusions can be drawn from the results: Effect of low temperature on mechanical properties: Tensile strength is higher in low temperature (-6 o C) than in room temperature (+2 o C) for both section without and with transverse weld. In whole section tensile tests decrease of temperature increases tensile strength in both welded and non-welded sections about 1%. In coupon tests tensile strength R m is increased about 1-2% depending on the section size. Proof stress R p.2 is increasing about in the same ratio as the tensile strength in both whole section tensile and coupon tests. Decrease of temperature increases also deformation capacity independent of existence of transverse weld. In the whole section tension test plastic elongation is % higher. In coupon test elongation at fracture A 5 seems to be increasing in most of the comparison, thus two comparison from the face of section show decrease. 26
27 Elongations at maximum force A gt show large deviation in the comparison with no clear dependence with temperature or section size. The characteristics of stress strain curve having shallow shape may have an influence on the value defined. In room temperature whole section test stress-displacement curve has similar shape than corners in coupon test especially in thick sections. Maximum force occurs at relative low elongation value. In low temperature tests the shape is shallower like in faces of the hollow section. Effect of welding on the mechanical properties: Welding does not have significant an effect on the tensile strength in room or at low temperature. In the whole section tests the transverse weld is not the weakest position in the section. Also sections with transverse weld fail from the non-welded part of specimen in whole section tension test. In coupon tests at room temperature welding does not change the tensile strength R m values in the face of section but seems to decrease it in corners about 1%. At low temperature welding does not influence the tensile strength values. Transverse weld seems to decrease the deformation capacity in both room and at low temperatures. In coupon tests at room temperature welding decreases total elongation values 25% in faces and also in corners, except in corner of section 1x1x6. At low temperature welding decreases total elongation after fracture A 5 values 2% in faces but in the corners reduction is lower, except in corner of section 1x1x3. Thus in whole section tests this may be due to used long measurement length of extension, which is used to calculate elongation. In the coupon tests the elongation along the length of section is not uniform in welded section. Fractures of specimen did not occur in the weld zone. In the whole section tests fracture initiated from the longitudinal seam weld Requirements of product standard EN 1219 Requirements according to EN 1219 for strength properties are shown in Table 2-5. The tensile test results are evaluated against these requirements. According to this product standard verification of properties is done with tensile test from the flat face. Figures show main mechanical properties from coupons B and H drawn as functions of section slenderness. In addition to value given in Table 2-5 also uniform elongation A gt is drawn. Table 2-5. Requirements according to EN 1219 for strength and impact properties. Tensile test - EN 12 Charpy V Notch - EN 145 Minimum yield strength R eh N/mm 2 Minimum tensile strength R m N/mm 2 Minimum elongation A % L S Test temperature o C Minimum impact energy KV (J/cm 2 ) S355JH S355J2H S46MH S46MLH Statistical evaluation of results in test database is based on 38 sections from steel grade S355. Single section S33 was excluded while it did not fulfil the tensile strength requirement for S355 and is assumed to be of steel grade S275. Also sections S5-S7 and S9-S1 of 1x1x8 from manufacturer A are excluded, while their testing condition were not similar to other and their results would have caused too large influence on this single sections size on the deviation. 27
28 Results from the statistical evaluation of strength properties are collected to Table 2-6, where mean value, standard deviation and coefficient of variation are given each coupon separately. In addition minimum and maximum values are given. Also results from evaluation, where the coupons from both faces and from both corners have been considered as one test group, are given. Respectively analysis of elongation values is presented in Table 2-7. Properties determined from faces of sections fulfilled strength requirements according to EN 1219 except in single case. This exception seems to be of steel grade S275. One other section had single tensile strength value 1% below the requirement, but the tensile strength from other face was above 49 N/mm 2. The elongation requirement was fulfilled in all cases. Results from statistical evaluation of strength properties in Table 2-6 shows that also strength properties at longitudinal seam weld and in the corners fulfil requirement of EN Instead the elongation values at fracture are fulfilled neither in the seam weld nor at corners. Thus the average is close to the requirement. The properties of weld depend on the treatment after welding: normalising is needed to achieve adequate ductility. Thus it should be considered that the requirements are set for the tensile test made from face of section. Figure Proof stress R p.2 values for coupons 2 B and 3 H from faces of the section. In the lower picture the same results are shown in more detail. Figure Tensile strength R m values for coupons 2 B and 3 H from faces of the section. In the lower picture the same results are shown in more detail. Note that results for section S33 of steel grade S275 are included in the pictures. R p2 (N/mm 2 ) R m (N/mm 2 ) N/mm 2 49 N/mm 2 (H+B)/2T Average (N/mm 2 ): 439 COV (%): 9.9 A 2H A 3B B 2H B 3B C 2H C 3B D 2H D 3B E 2H E 3B S46 2H S46 3B HF 2H HF 3B Average (N/mm 2 ): 541 COV (%): (H+B)/2T A 2H A 3B B 2H B 3B C 2H C 3B D 2H D 3B E 2H E 3B S46 2H S46 3B HF 2H HF 3B 28
29 Figure Elongation values at maximum force A gt for coupons 2 B and 3 H from faces of the section. A gt (%) Average (%): 1.7 COV (%): 32.7 A 2H A 3B B 2H B 3B C 2H C 3B D 2H D 3B E 2H E 3B S46 2H S46 3B HF 2H HF 3B (H+B)/2T Figure Elongation values at fracture A 5 for coupons 2 B and 3 H from faces of the section. A 5 (%) % A 2H A 3B B 2H B 3B C 2H C 3B D 2H D 3B E 2H E 3B S46 2H S46 3B HF 2H HF 3B 5 Average (%): 27.9 COV (%): (H+B)/2T Table 2-6. Statistical evaluation of proportional limit R p.2 and tensile strength R m. R p.2 N/mm 2 W H B Rmax Rmin W H B Rmax Rmin R m AVER STDEV COV(%) AVER STDEV COV (%) MIN MAX
30 Table 2-7. Statistical evaluations of elongation at maximum force A gt and after fracture A 5. A gt A 5 (%) W H B Rmax Rmin W H B Rmax Rmin AVER STDEV COV(%) AVER STDEV COV(%) MIN MAX Assessment of the strength results available for the sections is carried out according to guidelines given in EN 199 Eurocode: Basis of structural design (22). The characteristic strength properties determined from the test results are collected to Table 2-8. The factor k=1.64 which with in this case provides characteristic values corresponding to 5% fractile at 75% confidence level. The evaluation is done using both normal and lognormal distribution. According to Probabilistic Model Code (21) prepared by Joint Committee of Structural Safety (JCSS) log normal distribution should be used for strength properties of steel. The JCSS proposes 7% as coefficient of variation for yield strength and tensile strength of structural steel. Table 2-8. Characteristic values for proportional limit R p.2 and tensile strength R m according to EN 199 using normal and log-normal distribution: char = mean 1.64 stdev. R p.2 N/mm 2 W H B Rmax Rmin W H B Rmax Rmin R m Normal Log. N The characteristic proof strength R p.2 values are above the limit set in EN 1219 for stress used as yield strength f y =355 N/mm 2. The characteristic value for tensile strength R m instead falls 1% below the required value (f u =49 N/mm 2 ) even though all the tests results are above as in case of B face Ductility requirements for steel material in Eurocode 3 Eurocode 3, Part 1.1 (pren ) sets following requirements for the ductility of structural steel in section Ductility requirements. When minimum ductility is required, it will be expressed in terms of limits for: 1. The ratio f u /f y of the specified minimum ultimate tensile strength f u top specified minimum yield strength f y ; 2. The elongation at failure on a gauge length 5.65 A (where A is the original cross-sectional area); 3
31 3. The ultimate strain u, where u corresponds to the ultimate strength f u. According to note given the limiting values of the ratio f u /f y, elongation at failure A 5 and the ultimate strain u may be defined in the National Annex. Thus some values were given as recommendations: 1. f f 1. 1 ; (2-4) u y 2. Elongation at failure not less than A 5 15% ; (2-5) 3. u 15 y, where y is the yield strain ( E ). (2-6) y f y The requirements were modified from prestandard ENV during the conversion to EN standard. These requirements are transferred to mechanical properties from tensile test: 1. f f R R p 1. 1 u y m.2 Statistical evaluation of test results is shown in Table A 5 15% The statistical evaluation of elongation at fracture values are collected to Table u 15 y When the true proof stress level is considered while the use of nominal does not give safe sided evaluation of this requirement. Following conversion is made f y f y, n R p A gt Agt % E E f R f 21 y, n p.2 Statistical evaluation of this parameter is shown in Table 2-1. y, n The tensile test results are presented against these requirements. Each requirement is considered separately for properties from the longitudinal weld position, faces of the section and corners. Test database for coupon test from CFSHS of steel grade S355 is analysed against these requirements Tensile strength to yield strength ratio Table 2-9 shows results for tensile strength to yield strength ratio in different position sections: in the weld, in both faces of section and in two corners of section. For coupons from each position average value, standard deviation and coefficient of variation are given. Characteristic value is calculated according to EN 199 Basis of structural design. To show maximum deviation smaller and largest value is given separately. The results are also presented graphically in Figure 2-19 as function of section slenderness (B+H)/2T for longitudinal weld position, for flat faces and for corners of section Elongation after fracture Statistical evaluation of elongation after fracture A 5 is done at Table 2-7. Figure 2-2 shows elongation at fracture results for longitudinal seam weld, both faces and both corners as function of section slenderness. 31
32 Table 2-9. Statistical evaluation of R m /R p.2 ratio is given. The characteristic value is calculated according to EN 199 using equation given in the footnote. R m / R p.2 W B H Rmax Rmin AVERAGE STDEV COV (%) Character MAX MIN c = m s Uniform elongation at maximum force Table 2-1 shows results for elongation at maximum force values in different position sections: in the weld, in both faces of section and in two corners of section. For coupons from each position average value, standard deviation and coefficient of variation are given. Characteristic value is calculated according to EN 199 Basis of structural design. To show maximum deviation smaller and largest value is given separately. The results are also presented graphically in Figure 2-21 as function of section slenderness (B+H)/2T. Table 2-1. Statistical evaluation of elongation at maximum force A gt related requirement ratio where the effect of true proof stress has been considered. 1 R p.2 f y, n A gt W B H Rmax Rmin AVERAGE STDEV COV (%) Character MAX MIN c = m s 32
33 1.5 A 1W 1.4 B 1W C 1W R m /R p D 1W E 1W S46 1W (H+B)/2T R m /R p A 2H A 3B B 2H B 3B C 2H C 3B D 2H D 3B E 2H E 3B S46 2H S46 3B CEV Figure Values for R m /R p.2 ratios drawn as function of slenderness (B+H)/2T for longitudinal weld above, flat faces at centre and corners below. R m /R p A 4Rmax A 5Rmin B 4Rmax B 5Rmin C 4Rmax C 5Rmin D 4Rmax D 5Rmin E 4Rmax E 5Rmin S46 4Rmax S46 5Rmin (H+B)/2T 33
34 Average (%): 16.1 COV (%): A 5 (%) % A 1W B 1W C 1W 1 D 1W E 1W 5 S46 1W HF 1W (H+B)/2T 4 A 5 (%) % A 2H A 3B B 2H B 3B C 2H C 3B D 2H D 3B E 2H E 3B S46 2H S46 3B HF 2H HF 3B 5 Average (%): 27.9 COV (%): (H+B)/2T Figure 2-2. Values for elongation after fracture drawn as function of slenderness (B+H)/2T for longitudinal weld above, flat faces at centre and corners below Average (%): 16.9 COV (%): 14.2 A 4 Rmax A 5 Rmin B 4 Rmax B 5 Rmin C 4 Rmax C 5 Rmin A 5 (%) % D 4 Rmax D 5 Rmin E 4 Rmax E 5 Rmin 1 S46 4 Rmax S46 5 Rmin 5 HF 4 Rmax HF 5 Rmin (H+B)/2T 34
35 f y /R p2 A gt (%) A 1W B 1W C 1W D 1W E 1W S46 1W (H+B)/2T 2. f y /R p2 A gt (%) A 2H A 3B B 2H B 3B C 2H C 3B D 2H D 3B E 2H E 3B S46 2H S46 3B (B+H)/2T Figure Values for f y /R p.2 A gt ratios drawn as function of slenderness (B+H)/2T for longitudinal weld above, flat faces at centre and corners below. f y /R p2 A gt (%) A 4Rmax A 5Rmin B 4Rmax B 5Rmin C 4Rmax C 5Rmin D 4Rmax D 5Rmin E4Rmax E 5Rmin S46 4Rmax S46 5Rmin (H+B)/2T Conclusions Following conclusions are drawn from evaluation of ductility requirements for steel material against tensile test results for section in test programme: The properties from flat faces B and H of section fulfil all three ductility requirements. Characteristic value for the tensile strength to yield stress ratio is Values for elongation after fracture are clearly larger than required 15%. Some individual sections do not fulfil requirement for uniform elongation at maximum force. The longitudinal seam weld has to be normalised after welding to fulfil elongation requirements in ductility. Thus even some individual sections don t satisfy the tensile strength to yield stress ratio. 35
36 The requirement for uniform elongation at maximum for corners of section is not fulfilled. Most of the sections do not satisfy this requirement. Some sections fail also in elongation after fracture and tensile strength to yield stress ratio requirement. The changes in characteristic of stress-strain relationship due to high cold forming rate decrease the uniform elongation dramatically. The influence of this has to be considered in the K- and X-joint tests. The safety of design provision has to be considered while design models are based on the plastic hinge mechanism. 2.4 Toughness properties Brittle fracture is characteristic for normally ductile steel material at certain low temperatures. Toughness of a material is its ability to absorb energy in the plastic range. Safe use of steel structures requires that at service temperature chosen steel material does not exhibit brittle behaviour. This toughness is defined as materials ability of absorb energy either in presence of notch under dynamic loading or using unnotched specimen which may be loaded in principle statically under loading conditions where critical member is in tension Testing and evaluation The toughness of steel material is measured with Charpy V Notch (CVN) specimen, which is standardised in testing standard EN 145. The rectangular test specimen with a machined notch of specified geometry is used. Dynamic testing is done in pendulum testing machine where the amount of energy absorbed by the test specimen is measured. The test specimens are cooled at desired testing temperature in cooling chambers or using liquid hydrogen before testing. Test specimen for Charpy V Notch (CVN) impact tests were taken from the flat face of the section opposite to H coupon (Figure 2-7). The billet for test specimen was sawn or machined from the section. Through thickness notch position was used in the specimen. The dimension of test specimen was 1 x W x 55 according to EN 145-1, which means that the height of test piece was 1 mm and length was 55 mm. The width varied with different wall thickness of the section; about.5 mm was machined from both surfaces of the section except with 12.5 mm material thickness, which was machined to 1 mm width. The width values for each section thickness are given in Table The cross-sectional dimensions and notch depth were measured before testing to determine true area. Table Width of the impact test specimen corresponding to section thickness. Nominal material thickness of section (mm) Width of the impact test specimen (mm) Analysis of results When independent absorbed energy KV values are plotted against respective testing temperature values, a transition curve is formed showing the change from ductile (shear) behaviour to brittle (cleavage) behaviour. Ductile region of toughness curve is called "upper shelf" and brittle region as "lower shelf". Between them is transition region. The classification of material properties is different design for steel structures, pressure vessels and bridges and also requirement is product standards are based on certain amount of absorbed energy at specified temperature. In addition to absorbed energy values also the amount of ductile area may be used to define the transition curve. The percentage of shear fracture from cross-sectional area at notch position, than can 36
37 be considered to be ductile, is used in vertical y-axis. This ductile-to-brittle transition temperature (DBTT) is defined at temperature when the amount of ductile behaviour of cross-sectional area is 5%. In addition to temperature and loading rate (static or dynamic) the constraint depending on material thickness which affect on the stress state in the crack tip. Plane strain state, which provided best constraint, occurs at very thick specimen. Plane stress condition is found in very thin specimen with lowest constraint. The change in specimen dimensions influences constraint and stress state, which have different impact of absorbed energy level. Therefore general correlation between energy values obtained with CVN specimen of different size or shape are not feasible. The results are presented in a graph where the impact strength is in the y-axis and testing temperature in x-axis. Line is drawn through average impact strength values determined for set of tests in the same test temperature. The amount of ductile area of fracture surface is presented in the same way. Figure Transition temperatures corresponding 35 J/cm 2 fracture toughness requirement EATT (Energy Absorption Transition Temperature) as function of section slenderness (B+H)/2T. EATT ( o C) A B C D E S46 HF (H+B)/2T Figure Transition temperatures corresponding 5% ductile area criteria SATT (Shear Appearance Transition Temperature) as function of section slenderness (B+H)/2T. SATT ( o C) A B C D E S46 HF (H+B)/2T Conclusion drawn from the results: Requirement set in product standard EN 1219 is for 35 J/cm 2 for J at o C temperature and for J2 at -2 o C temperature. EATT transition temperature fulfils these criteria clearly, when the CVN specimen are chosen from plane element with though thickness crack position. 37
38
39 3 Applicability of plastic design for CFSHS members and structures 3.1 Introduction If the plastic design is utilised, it has to be ensured that the structure possesses enough deformation capacity. Thus, section ductility of members becomes an important requirement to ensure stability of the members at plastic hinge locations enabling the structure be able to carry further load through redistribution of internal forces. Plastic design rests on the following assumptions: Each member section is able to reach the plastic moment level through plastic yielding of the entire cross section. The material possesses enough ductility so that large plastic strains can be accommodated without fracture. The section has sufficient ductility allowing rotation at relatively constant moment will occur through a considerable rotation. Previous research has raised doubts about applicability of present plastic design rules for cold formed structural hollow sections (CFSHS). The argument has been that they do not satisfy the material ductility requirements of Eurocode 3, Part 1.1 (pren ) or that they have not enough geometric ductility (ability to develop the needed large rotations keeping the plastic moment capacity). Recent studies published by Wilkinson and Wilkinson&Hancock [3-2, 3-3] support the latter conclusion. They found that a large number of sections currently classified in the cross-section class 1 did not meet rotation requirements for plastic design. In this research project, the ductility of hollow sections in general and CFSHS in particular has been studied both numerically and experimentally. Test programme has been executed and extensive amount of numerical analyses have been done to extend the experimental results. The objective has been to find understanding of the parameters, which influence the rotation behaviour of hollow sections. In chapter 3.2 ductility requirement for plastic design is proposed to be characterised by available inelastic rotation instead of rotation capacity even though there is connection between these two definitions. Experimental and numerical analyses has been carried out to describe different phenomena that have an effect on the ductility and rotation capacity. In chapter 3.3 modifications are proposed to current cross-section classification of hollow sections of Eurocode 3, which considers the finding in chapter 3.2. In chapter 3.4 alternative design procedure for cross-section classification is given where the available rotation requirement is analysed structurally and compared to available inelastic rotation of members. The member performance may be analysed determined with experimentally verified analytical methods or numerically using calibrated FE simulation. 3.2 Ductility of hollow sections Ductility of cross section defined by available inelastic rotation The behaviour of a real beam is quite different from the assumption made in the plastic hinge theory. The moment-rotation diagram presents not only a curve shapes between the elastic and the plastic moment, but it also goes over the value of the plastic moment because of the strain hardening of steel. 39
40 The curve reaches a maximum, which corresponds to the maximum bearing capacity of the beam, and then, the moment must decrease because of local instability phenomena. Local buckling of compressed part of the section is the mechanism responsible for a change in the stress distribution giving rise to the resistance loss at that part. The fact of reaching the plastic moment corresponds to the full plastification of a cross-section, the formation of the plastic hinge. When the moment continues to increase, the plastic hinge rotates inelastically (Figure 3-1). Figure 3-1. Idealised moment-rotation behaviour at plastic hinge. Inelastic rotation,, can be defined as the parameter necessary to allow redistribution of bending moments M. Ductility of a cross section can be measured in terms of inelastic rotation at the moment of ultimate strength or inelastic rotation at the instant of falling below theoretical plastic moment resistance. Available inelastic rotation, av, is typically derived from the moment-rotation curve measured in the 3- point or 4-point bending tests and it is obtained from the descending branch of the curve at the moment of crossing down the plastic moment level (Figure 3-2). The available inelastic rotation av of the plastic hinge is clearly defined in the figure which presents a typical M- curve for a 3-point bending beam and can be expressed by the following formula: av (3-1) rot pl where: rot is the rotation corresponding to the bending moment as it reaches the plastic moment value (M pl ) in the descending part of the moment-rotation curve, expressed in radians and pl is the elastic rotation corresponding to the theoretical plastic bending moment (M pl ) of the beam, expressed in radians. 4
41 Figure 3-2. Concept of available rotation. Rotation capacity, R, can be used as a ductility parameter. Available rotation capacity (R av ) is defined as the ratio between the available plastic rotation, av, and a theoretical rotation, pl, calculated at the plastic moment level. R av = av / pl (3-2) with pl = M pl L / 2 E I (3-point bending test) or pl = M pl (L+l) / 2 E I (4-point bending test with a length l between loads). In the same way, required rotation capacity, R req, is defined as the ratio between the required inelastic rotation, req, and the theoretical rotation, pl. Rotation capacity can be used instead of inelastic rotation to make the parameter dimensionless. The validity of plastic analysis can also be checked in the cross-sections by comparing rotation capacities although it is essential to compute both available and required rotation capacities with the same reference length to keep consistency. The concept of rotation capacity introduces a supplementary parameter length L of a reference beam which describes structural parameter and not cross-sectional as also observed in previous ECSC funded project Promotion of plastic design for steel and composite cross-sections [3-4]. Available rotation capacity relates to a particular length while pl depends also on the length of the beam, which may be difficult to identify. Wilkinsson calculates a particular rotation capacity, R-value, in terms of curvatures instead of rotations by dividing inelastic curvature with the elastic one. Curvature (M pl / EI) does not depend on any reference length thus leading to R values which can be considered as a cross-section property. 41
42 The simplest way to check ductility of plastic hinges is to compare directly structurally required and cross-sectionally available inelastic rotations instead of transforming rotations in rotation capacities R values. Design programmes may directly compute rotations instead of R parameters. The inelastic rotations are depends mainly on the dimensions of the cross-sections and the material properties of webs and flanges. In general, they do not depend on the span length except in those cases where insufficient lateral restraints may cause lateral or lateral-torsional buckling coupled with local buckling. In the rotation capacity R the span length is also included, while it is a function of pl. ( pl =M pl (L+l)/2EI, for 4 point bending beam with span length L and distance between loads l). This approach is proposed also in Background document 5.9 for chapter 5 of EN on b/t ratios by Sedlacek and Feldmann [3-5]. The paragraph (14) states: "..The conclusions for the present EN rules are as follows: the presentation of the available rotation capacities terms of angles ("phi-values") gives more information on the actual inelastic behaviour rather than the presentation in terms of nondimensional "R-values" which is the comparison of the rotation of inelastic deformation of the plastic hinge and the elastic deformation of the beam". In conclusion: The available inelastic rotation describes with av is a proper parameter to characterise the deformation capacity of a cross-section under bending. av can be considered as a cross-section property while it depends on the yielding and local buckling which are determined by geometrical and material properties of the section. Available rotation capacity defined as the ratio between the available inelastic rotation, av, and a theoretical rotation, pl, is a function of the total span length of the beam. Also the total rotation rot is function of the total length since the elastic part of rotation is included in it which is distributed along all the member length. Available inelastic rotation ( av ), as measured in a 4-point bending test, comprises a component distributed along the constant-moment central region of the beam and a component concentrated at the plastic hinge zone. Only this second component of the available inelastic rotation can be considered to be a characteristic cross-sectional parameter. The distributed part depends on the distance between loads so it cannot be considered as a cross-section parameter Influence of load type and moment gradient The influence of the type of loading on the available rotation was assessed with FE simulation. Four point bending tests are mostly used for evaluating rotation capacity of hollow sections. Once bending progresses beyond the elastic region, inelastic deformation concentrates in the plastic hinge appearing at the constant moment central region of the beam. Available rotation at the hinges is measured by monitoring rotation values at both ends. In this study, the distance between loads for the 4-point bending test was the key parameter to investigate. When the rotation is expressed, in the usual way, by the sum of angles measured at both support ends a general trend is observed: the larger the distance between loads is the higher inelastic rotations and lower maximum moments are obtained. The observation of the deformation patterns obtained for every case provides additional insight on the apparent reduction of deformation capacity when increasing the length of the constant-moment region. The analysis of the deformed shapes allows differentiating three kind of deformation for every case: 1. Elastic deformation: it is distributed along the full span length of the beam. 2. Distributed plastic deformation: it develops in a uniformly distributed manner along the constantmoment region. 3. Localised plastic deformation: it is concentrated in the plastic hinge. 42


43 Thus, the available inelastic rotation can be divided in two components depending on the origin of the deformation: the first one, the distributed inelastic rotation, distributed along the constant-moment region and a second part, the concentrated inelastic rotation, which is developed in the plastic hinge itself. This latter part of inelastic rotation does depend on either the total span length or the length between loads. This concentrated part of the inelastic rotation is the responsible for the decreasing of the moment below the plastic moment level due to local buckling developing in the plastic hinge area. However, the distributed part of inelastic rotation depends on the distance between loads, where the bending moment is constant. The longer this region is the higher distributed component of inelastic rotation appears. Therefore the total inelastic rotation depends clearly on the distance between loads. The deformation patterns in Figure 3-3 show very clearly an increasing role of the distributed component of inelastic rotation when increasing the distance between loads. The case with larger length between loads (upper picture in Figure 3-3) shows a fully distributed inelastic rotation: the plastic hinge has not appearing. However, the case with shorter length between loads (lower picture in Figure 3-3) presents an inelastic deformation almost completely dominated by the concentrated rotation at the plastic hinge area. Figure 3-3. Effect of distance between loading point to the deformation pattern. Figure 3-4 shows the plastic buckling deformation at the hinge location after the maximum of the bending moment for two cases with different distances between loads, l=1 mm and l=4 mm. l = 1 mm l = 4 mm Figure 3-4. Plastic buckling deformation at hinge locations when length between loading point is varied. Figure 3-5 shows how the distance between loads alters the moment-rotation curve. On the left are moment rotation curves where the rotation is from the ends of the beam and on the right the rotation is at the plastic hinge. The moment-rotation curve on the right shows that the concentrated component of available inelastic rotation is not significantly affected by the length between loads. 43
44 M (Nm) l=8 15 l=4 1 l=6 l=12 5 l= Rotation at ends (ª) l=4 l=6 l=1 5 l=12 l= Rotation at the plastic hinge (º) Figure 3-5. Effect of distance between loading points to different rotations: on the left at ends and on the right at the plastic hinge. Thus, the following conclusions may be drawn: Available rotation capacity defined as the ratio between the available inelastic rotation, av, and a theoretical elastic rotation, pl, depends on the total span length of the beam. Also the total rotation rot is dependent on the total length since it includes the elastic part of rotation which is distributed along the member length. Available inelastic rotation ( av ), as measured in a 4-point bending test, comprises a component distributed along the constant-moment central region of the beam and a component concentrated at the plastic hinge zone. Only this second component of the available inelastic rotation can be considered to be a characteristic cross-sectional parameter. The distributed part depends on the distance between loads. As a consequence, the 4-point bending test must be designed so that the distance between loads is not much larger than the expected size for the plastic hinge. Then the contribution of the distributed part of deformation to the inelastic rotation is minimised Influence of plate slenderness and aspect ratio Experimental and numerical verification Experimental verification Test programme (Table 3-1) was executed to verify performance of hollow sections. Most of the sections chosen to it were cold formed but some hot formed were included as reference to compared differences caused by manufacturing methods. The bending tests provided also insight about the influence of web and flange slenderness on the section ductility. Some of specimens were selected to fall in the surroundings of boundary between crosssection class 1 and 2. 44
45 Table 3-1. Section sizes in the test programme. Section Material H B T R Flat f y Corn f y length (mm) (mm) (mm) (mm) (N/mm 2 ) (N/mm 2 ) (mm) 1 2x1x12.5 S355J2H x1x1 S355J2H x6x6 S355JH x1x8 S355JH x2x8 S355J2H x2x8 S355J2H x2x8 S355J2H x8x3 S355J2H x2x7 S355JH x15x5 S355J2H x15x5 S355J2H x1x6 S355J2H x1x4 S355J2H x1x8 S355J2H x15x3 S355J2H x1x4 S355J2H x2x4 S355J2H x7x3 S355J2H x7x5 S355J2H x1x5 S355J2H HF 1x1x8 S355JH HF 15x15x5 S355J2H HF 25x15x5 S355J2H Four-point bending loading arrangement has been adopted, where the load is transferred to the web through suitable web reinforcement, as much as possible independent on the upper flange of the section. A system of hinges and sliding plates, where the friction is minimised using couples of teflon sheets, allowed fulfilling at the best the theoretical conditions. The tests were carried out under displacement control. Displacements were measured using inductive transducers from in the seven sections, while the loads were measured through a load cell (Figure 3-6). Plastic hinge rotations are evaluated as sum of the rotations of sections No. 3 and No. 5, deduced considering differences in measured displacements in sections No. 3 / No. 2 and No. 5 / No. 6, (Figure 3-7). Of course, as actual rotations in sections No. 3 and No. 5 are smaller than actual rotations in sections No. 2 and No. 6, this method overestimates rotations in the elastic range, but the errors becomes smaller as plastic hinge develops. 45

; represents the available")
46 Figure 3-6. Test arrangement detail at the support and on the loading position. P load cell Figure 3-7. Location of displacement transducers in bending tests. Table 3-2 summarises the results for tested specimen. The available inelastic rotation and maximum moment obtained from the measured moment-rotation curves are given. Figure 3-8 shows the measured available rotations as a function of slenderness ratios. Figure 3-9 show example of moment rotation curves for section size 15x15x5. In Table 3-2 following values are given: av,nom avflange av,true represents the available inelastic rotation at nominal M p value (M p is determined with f y =355 MPa); represents the available inelastic rotation at the M pfl value (M pfl is determined with the actual f y values for the flange); represents the available inelastic rotation at the M ptrue value (M ptrue is determined with the actual f y values for flanges and corner areas); R represents the rotation capacity at nominal M p value (M p is determined with f y =355 MPa); R flange represents the rotation capacity at the M pfl value (M pfl is determined with the actual f y values for the flange); R true represents the rotation capacity at the M ptrue value (M ptrue is determined with the actual f y values for flanges and corner areas). 46
47 Table 3-2. Actual slenderness rations of tested sections. Maximum bending moment and available rotation obtained from the tests. SECTION web flange M max [knm] av,nom [deg] av,flange [deg] av,true [deg] R nom R flange R true 1 2x2x x1x8 (HF) > 15 > 15 > 15 >2 >2 >2 3 1x1x > 15 > 15 > 15 >2 >2 >2 4 2x1x >15 > 15 > 15 >2 >2 >2 5 1x1x >15 > 15 > >15 >15 6 3x2x x2x x2x x1x x1x x6x > 15 > 15 > 15 >2 >2 > x8x x8x x8x x15x x15x5 (HF) x15x5 (HF) x2x x1x > 15 > 15 > 15 >2 >2 > x15x x15x5 (HF) x1x >1 >1 > >15 > x15x x1x x2x x7x x1x x7x >1 >1 >1 >9 >9 >9 47
48 Inelastic available rotation - M pl (f y,nominal ) 5 Flange slenderness f > (HF) 5.2 (HF) (HF) EC3 CS Class 1 EC3 CS Class 2 Test sections 1 > Web slenderness w Inelastic available rotation - M pl (f y,flange ) 5 Flange slenderness f > (HF) 1.6 (HF) (HF) EC3 CS Class 1 EC3 CS Class 2 Test sections 1 > Web slenderness w Flange slenderness f >15 Inelastic available rotation - M pl (f y,flange+corner ) > (HF) 1.2 (HF) (HF) EC3 CS Class 1 EC3 CS Class 2 Test sections Web slenderness w Figure 3-8. Experimentally determined available inelastic rotation (degrees) in flange/web slenderness charts. Sections are classified using actual flange and web slenderness calculated with true crosssectional dimensions and flange material strengths. The available rotations are determined corresponding plastic moment level based on nominal yield strength, measured yield strength from flange and actual where increased yield strength on corners in included. 48
49 8 Test 14 (CF) 7 Test 15 (HF) M pl (actual CF) 6 M pl (actual HF) M [knm] 5 4 Test 16 (HF) M pl (nominal) Rot - [degree] Figure 3-9. Moment rotation curves for section size 15x15x5. Three sections were tested coldformed and two hot-formed Numerical analysis The influence of web and flange slenderness on the ductility of hollow sections was evaluated using FE simulations. The simulation programme comprises 24 section sizes selected in a slenderness range corresponding to the limit between cross section class 1 and class 2 (Figure 3-1) since this is the relevant area regarding usability of hollow sections for plastic analysis. To obtain moment-rotation curve each case was analysed numerically using nonlinear FE analyses where both geometrical and material non-linearities were included. The characteristics of CFSHS were considered by using different material properties for flat and corner part of hollow sections in the models. The geometrical non-linearity was initiated with initial imperfection. Three types of initial imperfections were considered for each section: a) Local buckling: maximum magnitude of.1% of the flange width; b) Local buckling: maximum magnitude of 1% of the flange width and c) web bow-out and flange bow-in: maximum magnitude of 1/5 the plate width. Thus, a total number of 72 numerical tests were performed. Table 3-3 summarizes the results in terms of calculated available inelastic rotations. 49
50 Flange slenderness EC3 Class 1 Wilkinson proposal Analysed sections Web slenderness Figure 3-1. Sections chosen for the numerical simulations. EC3 Class 1 line shows current slenderness limit for cross section class 1. Wilkinson proposal as updated limit for cross-section class 1 is obtained from [3-3, 3-4]. Table 3-3. Available rotation values obtained from numerically determined moment rotation curves. For comparison analysed cases are calculated with two calculation models: Kecman and Kubo. FEM AV (deg) Section i.i. 1%b i.i..1%b i.i. bow Kecman model Kubo model 8x8x x8x x8x x8x x8x x15x x15x x15x x15x x1x x12x x15x x18x x1x x 12x x1x x1x x7x x7x x12x x15x x3x x14x x15x
51 The rotation values predicted by simplified calculation models of Kecman [3-11, 3-12] and Kubo-type [3-13] are also included for comparison purposes (see section of this report where these models are described and their accuracy verified against test database). A reasonably satisfactory correlation is obtained for the imperfection level equal to.1% of the flange width, as it is shown in Figure 3-11 for both models. 6 Kecman vs. FEM av Kecman ii=1%b ii=.1%b ii=bow (1/5) av FEM Figure Comparison between results from numerical FE analyses and simplified calculation models: On the top Kecman-model and on the bottom Kubo model. In the vertical axis are the values from simplified models and in the horizontal axis values from FE analyses. av Kubo ii=1%b ii=.1%b ii=bow (1/5) Kubo vs. FEM av FEM Following conclusions can be drawn: Available inelastic rotation seems to depend on both web and flange slenderness ratios. Interaction between web and flange slenderness can be noted. The maximum moment and the inelastic rotation up to the maximum moment depend essentially on the flange slenderness. Figure 3-12, upper case, shows the resulting momentrotation curves for a series of five sections with the same web slenderness. It is observed that flange slenderness determines how far the curve goes before reaching the maximum load. However, slope of descendent part of the curve does not seem to be substantially affected by the change in flange slenderness. The lower case of Figure 3-12 shows the resulting momentrotation curves for a series of five sections with the same flange slenderness: in this case the curves are very similar up to the maximum moment. Afterwards, and in contrast to the preceding behaviour, the slope of descending part appears to depend heavily on the web slenderness. 51
52 1.2 Sections f =29.1, ii=.1%b x8x3 8x8x3 M / M pl x8x3 (lw=29,9) 1x8x3 (lw=37,28) 12x8x3 (lw=45,48) 14x8x3 (lw=53,67) 16x8x3 (lw=61,86) Rotation (degrees) Figure On the top, effect of web slenderness on the moment rotation behaviour with constant flange slenderness. On the bottom, effect of flange slenderness with constant web slenderness. M / M pl Sections w =57.8, ii=.1%b 3x1x6 15x1x3 3x1x6 (lf=16.8) 3x12x6 (lf=2.89) 15x7x3 (lf=24.99) 25x15x5 (lf=33.19) 15x1x3 (lf=37.28) Rotation (degrees) The reason behind that is that behaviour up to the maximum of the moment seems to be determined by the initiation of local flange buckling so that flange slenderness is the key parameter influencing the moment rotation curve before it reaches the maximum load. A very limited influence of web slenderness is observed provided that flange slenderness is in the range next to cross-section class 2 limit. Descendent slope of moment rotation curve after the maximum of the moment depends mainly on the web slenderness with a limited influence of flange slenderness when next or above cross-section class 2 limit. However, behaviour after the maximum load seems to be determined by the interactive coupling of local web buckling accompanying the primer flange buckling. Figure 3-13 shows the resulting inelastic rotation as function of the web slenderness with constant flange slenderness (the upper case) and as function of flange slenderness with constant web slenderness (the lower case). In both graphs, results for the three imperfection levels considered in the study are included. 52
53 5 Sections f = ii=bow(1/5) av ii=.1%b ii=1%b Web slenderness w Figure Available inelastic rotation values obtained from parametric analysis programme. On the top the flange slenderness is constant and on the bottom the web slenderness. av 6 4 ii=.1%b ii=bow(1/5) Sections w = ii=1%b Flange slenderness w Aiming at assessing the interactive influence of flange and web slenderness ( f and w ) on the ductility, results from the parametrical study have been processed to provide the shape of iso-rotation curves when representing the available rotation values in terms of both, flange and web slenderness. These isorotation curves indicate combinations of f and w giving the same available rotation. Parabolic polynomial regression over the results of numerical experimentation is used to find iso-rotation curves (Figures 3-14, 3-15 and 3-16). The current limit for cross section class 1 and modification proposal by Wilkinson are shown in the figures. 53
54 Figure Initial imperfection in analysis local buckling: maximum magnitude of.1% of the flange width fla ng e 25 sle nd ern 2 ess 15 Available rotation (degrees) and isorotation curves, i.i. = 1%b web slenderness Figure Initial imperfection in analysis local buckling: maximum magnitude of 1% of the flange width Figure Initial imperfection in analysis web bow-out and flange bow-in: maximum magnitude of 1/5 the plate width. 54
55 3.2.5 Influence of manufacturing method Figures 3-9 for section size 15x15x5 and Figure 3-17 for section 25x15x5 show comparison of moment rotation curves from tests to cold formed and hot formed section of same size. The characteristics in the shape of curves are similar thus the level of maximum moment deviates while the material strengths are different. The level of available inelastic rotation is also of same magnitude. It seems, that manufacturing method does not have major influence on the performance of sections, when plastic buckling occurs Test 2 (HF) Test 19 (CF) M pl (actual HF) M pl (actual CF) M pl (nominal) M [knm] Rot - [degree] Figure Comparison of moment-rotation curves for hot-formed and cold-formed hollow sections of same section size 25x15x Required inelastic rotation at the structural level A parametrical study has been carried out to assess the required inelastic rotations at the structural level. The evaluation has been performed by virtual testing carried out by both, matrix structural analysis and finite element analysis on structural systems composed of continuous beams (2 and 3 span) and portal frames. Two types of analyses are dealt with in this study: elastic-perfectly plastic (EP), and plastic-zone analysis (PZ). The elastic-perfectly-plastic analyses are performed using the matrix structural analysis program, MASTAN that allows for plastic analysis including second order effects. The plastic-zone analysis is performed via finite element analysis using COSMOS program. For the continuous beams under the Ultimate Limit State a vertical uniform load is applied incrementally until the collapse mechanism is reached. The Serviceability Limit State is also checked to consider the worst possible scenario. The deflection limits are set equal to L/2 for the vertical displacement and H/15 for the horizontal displacement. In the case of portal frames also Limit States, Ultimate and Serviceability, are considered. The types of actions taken into account are a uniform vertical load, to account for the dead load and snow, and a horizontal load that accounts for the wind effect. Again, these loads are applied incrementally and proportionally until the collapse mechanism is reached. The deflection limits are set equal to L/2 for the vertical displacement and H/15 for the horizontal displacement. For the two and three span continuous beams uniformly, the first plastic hinges are formed at the internal supports; the subsequent ones are formed within the external spans, thus yielding the collapse mechanism. Consequently, the first hinge undergoes the largest inelastic rotation, which will reach a 55
56 maximum at the time of collapse. For long spans the vertical deflections become large enough for the Serviceability Limit State to control the performance of the structure. If a plastic hinge is already formed then the rotation is measured at the time when the allowable displacement is reached. Figure Two and three span continuous beam. Collapse mechanisms and bending moments. Table 3-4 below illustrates the results obtained using the EP analysis for different lengths of two and three span continuous beams. The darker shaded area indicates that Ultimate Limit State is limiting the performance of the structure. The lighter shaded area indicates that Serviceability Limit State is controlling the performance. The non-shaded area corresponds to the cases when the allowable displacement is reached before any plastic hinge is formed. Maximum rotation demand predicted by the elastic-plastic (EP) and plastic-zone (PZ) methods have shown to be quite similar, although the more accurate PZ method predicts a larger ultimate load. Table 3-4. Rotations corresponding to plastic hinges are given. Darker shaded are cases where ULS is limiting and lighter shaded were SLS. 2 Span Section Type 3 m 4 m 5 m 6 m # # # # Span Section Type 3 m 3.6 m 4 m 5 m # # # # The maximum rotation required for plastic analysis is below 2 for two span beams. Three span beams require rotations below 1 degree. A similar trend is expected for four and five span continuous beams. A typical portal frame built with structural hollow sections has also been considered. The first plastic hinge is formed at the intersection between the girder and the column and consequently will undergo the largest rotation, which will reach a maximum at the time of collapse. For long spans the vertical deflections and for high frames the horizontal deflections become large enough for the Serviceability Limit State to limit the rotations. If plastic hinges are already formed then the rotation is measured at the time when the allowable displacement is reached. Figure Portal frame. Collapse mechanism. 56
57 In the same way as before, Table 3-5 below illustrates the results obtained using EP method for different lengths and heights of portal frames. The notation (r) means that the limiting factor is the plastic rotation under U.L.S.; (v) and (h) mean that the limiting factor has been the vertical or horizontal displacement, respectively, under S.L.S. The plastic zone method tends to predict slightly larger inelastic rotations and ultimate loads than the elastic-plastic method. Table 3-5. Rotations corresponding to plastic hinges are given. Darker shaded are cases where ULS is limiting and lighter shaded were SLS. Height 6 m 8 m 1 m Span Section Type 1 m 12 m 15 m 18 m 2 m # (h).83 (v). (v). (v). (v) # (r) 2.35 (r) 1.7 (v).86 (v).67 (v) # (h). (h). (v). (v). (v) # (h).44 (h).76 (v).63 (v). (v) # (h). (h). (h). (h). (v) # (h). (h). (h). (v). (v) Conclusions regarding the required inelastic rotation in standard structural systems, derived from this study are the following: Although the structural systems may undertake substantial plastic deformation prior to the collapse mechanism, in practice the Serviceability Limit State, which imposes limitations on the displacements, limits the required plastic rotations. The maximum rotation angle measured in continuous beams is of the order of 2º (.35 radians). In cases of large spans the deflections imposed by the Serviceability Limit State constitute the limiting factor, and no plastic hinges are formed. In the case of portal frames the plastic hinges may undergo rotations of up to 3º (.5 radians) Influence of lateral restraints The influence of lateral restraints in the deformation capacity of hollow sections has been assessed from conclusions derived in a parametrical study by numerical experimentation. The criteria set forth in Eurocode 3, Part 1.1 (ENV ) (3-6) is used to induce lateral instability. The initial bow imperfection e o prescribed by ENV is modelled by means of the equivalent lateral force applied at the compression flange and defined as (Clause 5.3.3): 8M pleo q (3-3) 2 hl where, M pl is the plastic moment, h is the height of the section, L is the length of the beam, and e o = m L/5. m =1 in this case. According to ENV Clause 5.4.3, lateral restraint at the compression flange should be provided at all plastic hinge and plastic zone locations within a distance from the plastic hinge not exceeding 1.5 times the width of the flange. The parametric study is performed considering 2 and 4 times this distance, in order to assess its influence in the rotation capacity and plastic moment as show in Figure 3-3. In addition, the beam is analysed with lateral restraints at the supports only. 57
58 Lateral Restraints according to ENV (EC3) Lateral Restraints at 4 times the ENV (EC3) limit Lateral Restraints at supports. Figure 3-2. Different lateral restraint locations used in the analyses. The results obtained for the different sections are illustrated in the following tables. The three parameters that are used as means of comparison are, the plastic moment M pl, the total inelastic rotation av, and the non-dimensional rotation R av. The distances that have been considered for lateral restraints have been the distance imposed by the ENV , two and four times this distance, and the restraints at the supports only. It is important to mention that no lateral buckling instability has been detected and as shown in the tables both the plastic moment and rotation capacity do not vary significantly with the restraint distance. Table 3-6. Results for the section 1x1x3. Distance for lateral M pl (knm) av (º) R av restraint EC kn m EC kn m EC kn m At Supports 14.5 kn m Table 3-7. Results for the section 16x8x3. Distance for lateral M pl (knm) av (º) R av restraint EC kn m EC kn m EC kn m At Supports 25.1 kn m
59 The main conclusions are the following: 1. Cold formed structural hollow sections have a large torsional capacity and, as a consequence, a large lateral stability as well. 2. The distance of lateral restraint in the neighbourhood of the plastic hinge and plastic zone can be much larger than that for open sections. The rotation capacity does not appreciably change even for four times the distance prescribed by Eurocode 3. Consequently the limits to prevent lateral torsional buckling set forth by Eurocode 3, although valid for open sections, are over conservative for rectangular structural hollow sections. 3.3 Recommendation for cross-section classification Current cross-section classification Following assumptions are made for members when plastic design may be used: Each member section is able to reach the plastic moment level through plastic yielding of the entire cross section. The material possesses enough ductility so that large plastic strains can be accommodated without fracture. The section has sufficient ductility to allow for a considerable rotation at a relatively constant moment. Concerning material ductility specifications, EN defines a key number of requirements to ensure that the material is able to sustain all the deformation required by the plastic hinge. In fact, all the available test evidence, including tests made in this project, confirm that the limiting factor determining the failure mode is not material ductility but geometrical ductility. Local buckling affects the bending behaviour of hollow sections. As a consequence, steel design specifications define different classes of cross sections depending on how sensitive they are to the occurrence of local buckling during bending. In EN , sections are classified as Class 1, 2, 3 or 4 based on the point at which local buckling occurs and the consequent capability of the section to maintain the plastic moment level for sufficiently large rotations which are needed to allow for moment redistribution in plastic design: Class 1: Sections, which are able to form a plastic hinge with sufficient rotation capacity, required for plastic analysis. Class 2: Sections, which can develop their plastic moment resistance but have limited rotation capacity due to local buckling. Class 3: Sections in which local buckling is liable to prevent development of plastic moment resistance. Class 4: Sections in which local buckling is liable to prevent development of elastic moment resistance. The rules for classification consider the combination of cross-sectional dimensions (b/t slenderness ratios for the web and flange), the yield strength and the type of applied loading (separate or combined axial and/or bending moments). Clause (4) of Eurocode 3 (ENV ) states cross section requirements for plastic global analysis: For building structures in which the required rotations are not calculated, all members containing plastic hinges shall have class 1 cross-sections at the plastic hinge location. 59
60 Doubts have been presented about applicability of CFSHS for plastic design arguing that they do not satisfy the material ductility requirements of ENV or that they have not enough geometric ductility (ability to develop the needed large rotations keeping the plastic moment capacity). Recent studies by Wilkinsson [3-3, 3-4] support the latter conclusion based on interpretation of test results performed for the purpose. They found that a large number of sections currently classified as Class 1 demonstrated insufficient rotation for plastic design making the above clause unsafe in certain cases. Based on the results of the study on hollow section ductility (Chapter 2.2), it has also been concluded that current limits of classification in ENV may be nonconservative for hollow sections when used to ensure ability of a class 1 section to exhibit sufficient rotation capacity for every structure. Therefore following studies have been made to alter cross-section classification limits of ENV for hollow sections especially cold-formed structural hollow sections Modified proposal for classification limit in class 1 In Background document 5.9 for chapter 5 of EN on b/t ratios [3-5] has been stated available rotation capacity R av which would identify sections which fulfil requirements for the use of plastic design, should be R av 3.. In continuous beams required available rotation for before SLS become limiting is of the order of two degrees and respectively in portal frame up to three degrees. Figure 3-21 shows rotation capacities determined for tested sections. Respective inelastic available rotation values are shown in Figure 3-8 (c. low). Rotation capacity R - M pl (f y,flange+corner ) 5 Flange slenderness f > (HF) 1.2 (HF) (HF) EC3 CS Class 1 EC3 CS Class 2 Test sections 1 > Web slenderness w Figure Rotation capacities R determined for tested specimen. The available rotation is determined using plastic bending moment resistance level calculated with actual flange and corner yield strengths. Figure 3-22 shows inelastic available rotation values and rotation capacity values for all the cases in the test database (Table 3-9). Both values determined using yield strength from the flange of section. Increased yield strength of corners is not considered. The values between hot-formed and cold formed sections are comparable. 6
61 Class 1 limit New proposal Wilkinsson Zhao & Hancock Flange slenderness / / / 4.2. /. 2.5 / / / / / / / / / / / / /.8.8 / / / / Web slenderness 5.8 / / / / / / / / / / / / / / / / / / / / / / / 2.9. /..5 /.6. /. 1.2 / / / / Class 1 limit New proposal SEDLACEK Pisa University Flange slenderness / / / / / 4.3 >15 / > / / / / / / / / / / / / / / / / / / / / / / / / / Web slenderness Figure Inelastic rotation av and rotation capacity R av values are shown for each case in test database ( av / R av ). The values are determined using actual yield strength from the flange of the section. The influence of corners is not included. The current rules for classification consider the combination of cross-sectional dimensions, b/t slenderness ratios for the web and flange in an independent way. As concluded in Chapter 3.2.4, ductility is dominated by flange slenderness when the section is in the region of lower web slenderness ratios ( w < 6) and only global patterns (constant along the length) of initial imperfections are considered. However, the influence of interaction with web slenderness becomes relevant in region 61
62 between Class 1 and Class 2. When considering local patterns of initial imperfections the interactive influence of web slenderness happens to be more intense even for sections in the lower range of web slenderness (see iso-rotation curves represented in Chapter 3.2.4). Previous work from Wilkinsson& Hancock reached similar conclusions. This proposal is made on the basis of keeping straightforward and simple rules but incorporating the findings of this research in terms of providing a safer approach to classify a hollow section to Class 1 for the plastic design. Thus, interaction between both, web and flange slenderness, should be considered to account for the interacting influence of both parameters particularly in the region of the border between Class 1 and Class 2. This proposal is based on the information from iso-rotation curves, which are fitted to calibrated numerical simulation results and test results. Previous findings reported by Wilkinsson have also been taken into consideration to confirm reached conclusions. Thus, at present state, following changes in the present classification limit are proposed: A global limit for flange slenderness should be lowered though the test results are deviating. In Figure 3-22 lower limit down to f = 25 is proposed instead with current limit of f =33. Detailed statistical analysis is required to adjust the level of safety. A linear interaction between flange and web slenderness should be considered in the region where web slenderness approaches current limit of Class 1 ( w = 72). Wilkinson s proposal as relationship is adopted but modified to be limited to proposed global limit of f = 25: w 72 (5/6) f with f 25 (3-4) According to the results from calibrated numerical simulations which have shown to be conservative in comparison to tests this proposal would guarantee a minimum available inelastic rotation around 5-6 degrees (Figure 3-16) when considering global imperfections patterns and around 3 degrees when accounting for more unfavourable case of local imperfections (Figures 3-14 and 3-15). The proposal is also in reasonable agreement with test results collected in test database (Figure 3-22) though there are large deviations in the test results. This proposal is also in line with the one proposed by Wilkinson and Hancock [3-4], which is also indicated in Figure 3-1. More recently, Wilkinson [3-5] has proposed a simplified alternative ignoring the effect of flange-web interaction by setting an absolute limit on the web slenderness equal to 55 instead of 72. More detailed statistical analyses should be carried to adjust the slenderness limits in the way that safety level corresponds to other sections geometries. 3.4 Guidance for plastic design Alternative approach based on available and required rotation checking A more rigorous approach is also proposed based on the concept of available inelastic rotation as a measure of section geometrical ductility. The method which compares required and available inelastic rotations for each formed plastic hinges is an alternative to the use of section classification rules existing in ENV , for the verification of sufficient ductility of plastic hinges. ENV provides general rules concerning rotation requirements of plastic hinges (Clause 5.3.3): (3) At plastic hinges locations, the cross-section of the member which contains the plastic hinge shall have a rotation capacity of not less than the required rotation at that plastic hinge location. (4) To satisfy the above requirement, the required rotations should be determined from a rotation analysis 62
63 Thus, the application of the rotation capacity concept to plastic design as a global analysis method involves checking that the required inelastic rotation ( req ) does not exceed the available inelastic rotation ( av ) for each plastic hinge appeared in a structure submitted to design loads: req,d av,d or req,d av / M (3-5) where: req,d av,d av is the design value of required inelastic rotation at the plastic hinge location (calculated from plastic global analysis of the structure submitted to design loads). is the design value of available inelastic rotation is the characteristic value of available inelastic rotation. In the context of this research new tools in the form of simple models are proposed to evaluate available inelastic rotation. is partial safety factor. The values of partial safety factor should be determined from statistical evaluation of a sufficient number of available test results on the scope of the design model used to evaluate available rotations. At the present time a value M =1.5 is suggested on the basis of previous studies for open cross-sections since test data base is still insufficient to state definite values. Three different methods can be used for evaluation of available inelastic rotations: tests, numerical simulation (Finite Element Analysis) and approximate predictive models. Guidelines and recommendations are given in the following sections for evaluation by FEA (section 3.4.2). In addition to this, two predictive simplified models are proposed for the same purpose in section Preliminary estimates of the required inelastic rotations for standard structural systems that make common use of CFSHS, have been provided in section Numerical evaluation of available inelastic rotation Numerical simulation by finite elements provides an adequate way of modelling the inelastic behaviour involved in the collapse response of the cross-section. Detailed finite element modelling including effects of plasticity, strain hardening, geometrical nonlinearities and residual stresses is proposed for evaluating deformation capacities of individual members (section characterisation). Appropriate modelling alternatives are proposed for shape and magnitude of initial imperfections, material, residual stresses, and boundary conditions and meshing. A set of simulations to model the tests were performed to confirm the FE modelling strategy. The correlation analysis with the test results gives rises to the following conclusions: 1. Maximum load capacities (in terms of maximum moment) measured in tests are always well above the values predicted by FE models (Figure 3-23). This is very likely caused by the fact that real yielding stress of the material in test specimens is above the nominal values used in the FE models. Discrepancy caused by this over-strength effect can be overcome by updating the yielding and ultimate stresses assumed in FE models. M-curves derived from updated FE models are shown in the next figures also indicating the used factor. 2. The general shape of the M curves, particularly in the descending part, is reproduced by the FE models in a satisfactory way. Quantitative estimation of this agreement is done by comparing the parameters, which characterise the post-buckling descending slope of the curve ( 9% and 95% ). FEM seems to provide generally safer values of post buckling slopes for the three available cases (Table 3-8). 63
64 3. FEM curves appear to be shifted in the rotation axis when compared to the test ones, in such a way that rotations from tests are higher that in the simulations. Explanation for this discrepancy has been elaborated based on detailed modelling of the section 2x1x4. Standard modelling strategy was developed to provide simple and safe assumptions allowing safe predictions of available inelastic rotation be made. Some of these assumptions are revised using more realistic hypothesis with regard to both material data and imperfections: Actual stress strain curves from material tests. Measurements of imperfections for the test specimen showed that the imperfections are sensibly uniform along the specimens where the magnitude of local imperfection (with wave lengths in the order of flange width) is far from reaching the level proposed in standard modelling strategy (,1% of flange width in the first local eigenmode). Based on the case was modelled without using any initial imperfections (Figure 3-24). The results show how the calculated curve approaches closer to the experimental one although it remains still far from reaching the experimental rotation levels. Table 3-8. Comparison of the available ration results at level of 9% and 95% of the moment resistance. Tests FEM 95% 9% 95% 9% 3x2x x2x x1x
65 3 x 2 x M / Mpl.nom Test 1 Test 2 Abaqus, sc aled rotation (degree s) 4 x 2 x M / Mpl Test Abaqus, scaled rotation (degrees) 2 x 1 x M / Mpl Test Abaqus, scaled rotation (degree s) Figure Comparison of moment-rotation curves from tests and FE simulations for section sizes3x2x8, 4x2x8 and 2x1x4. FE results are analysed with nominal material properties and then scaled to reach experimental moment resistance. M pl is calculated with nominal yield strength. 65
66 2x1x4, material VTT, influence of imperfections %b, local imperfection no imperfection Test Rottation (degrees) Figure Effect of imperfection on the moment rotation curve for section 2x1x4. It can also be observed a very relevant lack of agreement between the numerical and test curves regarding the starting slope in elastic part. This is an indication that rotations could not be measured in the same way. Measurements of rotations in tests are done by using vertical displacements of locations 2 and 3, on the one hand and 5 and 6 on the other one (Figure 3-7). Due to the elastic part of rotations, this measure overestimates the actual rotation of the plastic hinge. The following figure shows the difference between the M- curve obtained by directly monitoring rotations at both ends of the plastic hinge (as proposed in standard strategy) and the one obtained from the test (deduced from displacements at a given distance of both loading ends). It can also be appreciated how the initial slope of elastic part of the curve fits now much better to the experimental one although rotations are still lower compared to test (Figure 3-25). 2x1x4, material VTT, influence of rotation measurement method no imperfection, direct rotations Rottation (degrees) no imperfection, rotations from displacements Test Figure Effect of different ways of determining rotation to moment rotation curves. Detailed observations of the respective deforming shapes (FE model and test) give also some differences. The general mode is the same but deformation in the test tends to concentrate very close to one of the loading plates. Numerical deformation is also shifted from the midspan but in a less evident manner. Residual stresses that can be expected to arise in the areas where loading plates are welded are very likely to be responsible for this effect as well as for the shifting of the curve towards regions of higher rotations as observed in test curve. Preliminary numerical studies proved the strong influence of residual stresses on the shape of the moment-rotation curve before reaching the maximum moment. Figure 3-26 shows how the introduction of a given pattern of residual stresses (uniform along the beam) makes the ascending part of the moment-rotation curve to lie closer to the experimental one. 66
67 H36W12T Exp 1 No R.S. - No I.I. 5 R.S. - No I.I. Mpl fy nominal,5 1 1,5 2 2,5 3 3,5 4 4,5 5 Rotation (degrees) Figure Effect of residual stresses on the moment rotation curve Design models for available inelastic rotation Types of models A review of predictive simplified models for evaluation of available inelastic rotation of CFSHS is done on the basis of their theoretical basis, scope, limitations and application guidelines. A test database collecting test data and results from different sources has been used for the purpose of performing a reliability analysis of the different models by correlation with the test results. Approximate models, however, conform to practical demands although they are valid in limited ranges and scope. Important physical effects to consider are: Membrane stress rearrangement-giving rise to a post critical load capacity reserve. Occurrence of yielding at plate edge and loss of capacity resulting from this kind of yielding. Bending moments developing in a buckled plate and determining the basic mechanism responsible for the loss of capacity of the plate to carry membrane stresses. Yielding mechanisms of plastic deformations of plates in post buckling range. Relevant additional factors to take account of their effects in models are strain hardening, residual stresses and initial geometrical imperfections. The following models are distinguished considering their purpose and physical basis: I. Models aimed to obtain the maximum bending moment capacity of the member Most of them are based on the Effective Width concept. Attention is focused on predicting the response up to the maximum moment. These models do not try to simulate the behaviour after the maximum moment so post buckling modelling is not of concern for them. They provide estimation of ultimate resistance of a member under bending moment or bending moment combined with axial force as well as deformation of the member (rotation) when ultimate moment is reached. The difficulties associated to the calculation of the falling branch of the moment-rotation curve is avoided by assuming that the total inelastic rotation available prior to the moment falling below the plastic moment is directly related to the rotation at maximum moment. These kinds of methods are more suitable for slender sections made up with webs and flanges of thin plate. Buckling of webs or flanges is then likely to occur in elastic region. This local buckling does not 67
68 lead immediately to the loss of resistance in the member appearing a post critical reserve of load bearing capacity. Thus, models based on effective widths take into account membrane stress rearrangement and occurrence of yielding at plate edge derived from local buckling. Conversely, they do not consider the loss of capacity to carry membrane stresses due to bending moments arising in a buckled plate. This limits its applicability for stocky sections. Nevertheless, effective width approach has been extended into the inelastic range to account for plasticity effects actually taking place for plates in the intermediate range of slenderness. Alternative models to the ones based on Effective Width concept to evaluate moment-rotation response of moderately thick plate members are based on tracking the stress-strain path at each plate of the section. II. Models aimed to obtain the falling branch of moment-rotation curve The physical base behind most of these models is some approach of yield line kinematics mechanisms. Local buckling causes the stress distribution to change suddenly: a flanged which is assumed to carry only membrane stresses before buckling will have to absorb bending moments once local buckling appears, reducing considerably its capacity to keep carrying membrane stresses. The models belonging to the previous group ignore the bending moments which begin to develop once local buckling has appeared so that they do not make any provision to account for the reduction caused to membrane strength. The behaviour of the member after the maximum of the load, in the post buckling range, is assumed to be dominated by this effect. In this respect, the models based on yield line kinematics mechanisms try to represent the post buckling response and particularly the descending part of the load-displacement or moment-rotation curves. These methods are suitable to deal with stocky sections made of relatively thick plates where local buckling comes into being with yielding practically at the same time. No relevant post critical reserve is considered to develop. III. Models based on statistical fitting These models have their applicability limited by the range of test results used for the fitting. Different forms of slenderness ratios are used as basic parameters. Complex and interacting phenomena involved in the real behaviour that determines the rotation capacity of a member are in this way integrated in very simple equations Test Data Base Three sets of experimental data, all of them corresponding to 4-point bending tests, have been found and used for correlation and validation of predictive models: Wilkinsson & Hancock (3-2), Sedlacek (3-7) and Zhao & Hancock (3-8) (Table 3-9). 68
69 Table 3-9. Test series in test database that have been used to evaluate behaviour CFSHS in bending. Type of test No. tests Sections d/b range b/t range Material Characteristics Reference 4 point bending test CF d=75-15 b=25-1 t=1,54-4,92 2 C35 C different loading methods Tests to examine compact web slenderness of CF RHS T.Wilkinson, GJ Hancock J.Struct.Eng. Vol 124 No1, Oct point bending test 28 4 CF-SHS 3 CF-RHS 4 HR-SHS 3 Fe span lengths (2 moment gradients) Investigation of the rotation behaviour of hollow section beams. Report EUR EN FeE46 G.Sedlacek et all. d=5-2 Fe51 b=4-2 t=3-8 4 point bending test 1 1 CF: - SHS from 1x1x3,8 to 65x65x2,3 - RHS from 125x75x3,8 to 1x5x2,8 1 (C45) ,9 33,7 Tests to determine plate slenderness limits for cold formed RHS of grade C45 XL Zhao, GJ Hancock, Steel Constr. Vol.25 No4, point bending test CF 3 HF d=1-4 b=1-2 t= S Tests done in this project at University of Pisa. The test results have been re-evaluated in terms of available inelastic rotations ( av ) to make them homogeneous and comparable since different definitions of rotation capacities were originally used. Sedlacek tests are reported in form of standard definition of rotation capacity so a simple multiplying operation by pl allows obtaining the desired available inelastic rotations ( av ). This is not the case for both sets of test results, Wilkinson&Hancock (3-3) and Zhao&Hancock (3-8), which give rotation capacities defined in terms of curvatures instead of usual definition in terms of rotations. In these cases available inelastic rotations ( av ) values are recalculated values of providing, thus, a homogeneous measurement for all the tests Proposed simplified methods based on Kecman model and Kubo model a) Method based on Kecman model: The Kecman model (3-9, 3-1) has been evaluated by comparing experimental results in test database to assess reliability of the model. The maximum moment M max is obtained through the following formulas: 69
70 a 2a b ae (1) b M max M m ptb when cr p (3-6) 3a b (2) M M M M cr p max p p p when p cr p 2 p (3) M M t ab t.5b t where max p p (3-7) when cr 3 p (3-8) 2 a t cr.9e (3-9) b a b M p ptba (3-1) 3 cr a e a.7. 3 p. with a a if (3-11) e cr p The comparison of maximum moment values calculated from the Kecman model and those from the test presents a satisfactory correlation as shown in Table 3-1 and Figure Table 3-1. Statistical analysis of comparison between experimental moment resistance and analytical determined with Kecman model. TESTS Maximum moment Correlation coefficient Average error All 99.7% 6.8% Wilkinsson-Hancock 99.1% 7.8% Sedlacek 99.9% 3.6% Zhao-Hancock 98.5% 12.2% University of Pisa 99.5% 7.3% The available rotation is calculated by numerical derivation of the formula giving the energy, W ), absorbed by the yielding line mechanism postulated by Kecman: M D where D W D D (3-12) 7
71 W 2.5 t a 2 D pu 2b arc tan 2 h x y y A z A A A 2 z A z A h 2 arc tan 2 h h ya za (3-13) ya r 3 b a h if a b or h if a b 2 2 h.5t J 2arc sin (3-14) b D (3-15) 2 x tan (3-16) A y A D r.7 h.7 h 7 35 (3-17) h tan b cos b sin 2h b sin y A (3-18) 2 1 tan From the M() curve obtained with these equations, a rotation value can be derived by intersecting the curve with a given plastic moment level (M pl ). The calculated rotation value has been assumed to represent the inelastic available rotation according to the definition given in the introduction ( av = rot - pl ). A reasonably satisfactory correlation has been obtained by comparison with test data although the rotations given by the model have been modified by a constant value to minimise the error. 6, 5, 4, Tests Wilkinsson-Hancock Tests Sedlacek Tests Zhao-Hancock Tests Pisa 3, 2, 1,,, 1, 2, 3, 4, 5, 6, Mmax (Tests) Figure Correlation between experimentally determined moment resistance and calculation with Kecman model. 71
72 Table Statistical analysis of comparison between experimentally determined inelastic available rotation and analytical determined with Kecman model. TESTS Available inelastic rotation Correlation coefficient Average error All 95.2% 22.2% Wilkinsson-Hancock 93.9% 26.7% Sedlacek 92.4% 18.8% Zhao-Hancock 98.3% 17.8% University of Pisa 97.5% 21% Figure 3-28 represents the comparison between the results given by the modified Kecman model (corrected by subtracting a constant rotation value equal to 2.72º) and the test results. The Kecman model provides a better agreement with test results of Zhao&Hancock and test from this project than with Sedlacek et all. and Wilkinsson&Hancock tests. 12, 1, 8, > 15 Tests Wilkinsson-Hancock Tests Sedlacek Tests Zhao-Hancock 2 2 Tests Pisa 7 7 6, 4, 2, Figure Correlation between experimentally determined available inelastic rotation and calculation with Kecman model. b) Method based on Kubo model Kubo (3-11) proposes a statistical formula using a combined flange/web slenderness ratio as basic parameter: (3-19) s pf pw,, 2, 4, 6, 8, 1, 12, Phi-av (Tests) where pf and pw are calculated from: b 12(1 2 ) y (3-2) t k E p 2 Kubo used data of I-sections to fit a simple formula for the rotation capacity R as follows:.24 R 12 (3-21).44 s 72
73 An equivalent model has been derived using a similar equation and re-evaluating the value of the coefficients by fitting with the test data base of hollow sections. The following formula has been obtained under the criterion of providing a conservative value for the available inelastic rotation: 2.5 av 4 (3-22) S This model has been implemented and evaluated by contrasting its results with the experimental data base with the aim of assess its reliability. Table Statistical analysis of comparison between experimentally determined inelastic available rotation and analytical determined with Kubo model. TESTS Available inelastic rotation Correlation coefficient Average error All 86,6% 53,5% Wilkinsson-Hancock 95,4% 49,7% Sedlacek 85,8% 37,8% Zhao-Hancock 94,6% 49,1% University of Pisa 96,2% 66,5% Figure 3-29 shows the comparison between the results given by the fitted Kubo-type model and the test results. Kubo-type model 12 9 Kubo-type model Tests-Wilkinsson & Hancock Tests-Sedlacek Tests-Zhao&Hancock Tests-Pisa 6 3 av 2, 5 S 4,2,25,3,35,4,45,5,55,6,65 Figure Comparison with experimentally determined inelastic available rotations to Kubo model. The method based on Kubo model provides a better agreement with test results of Wilkinsson&Hancock and Zhao&Hancock tests than with Sedlacek et all. tests. The large values of average error are motivated by the criterion used to provide safe values of available inelastic rotations. 3.5 Conclusions Following conclusions are drawn The available inelastic rotation marked av should be used to model the deformation capacity of a cross-section in bending, while it can be considered as a cross-section property that is limited by 73
74 material property related yielding and geometric dimension related local buckling. Traditionally rotation capacity R = ( rov - pl )/ pl. is used to describe deformation capacity. The inelastic rotation capacity of hollow sections depends on the shape of descending part of the moment rotation curve, which is limited by plastic local buckling as failure mode. Material ductility is not the limiting phenomena on the deformation capacity of hollow sections. When moment rotation performance of hollow sections is considered the moment resistance and the inelastic rotation up to the moment resistance seems depends essentially on the flange slenderness. The web slenderness seems to have an influence on the descending part of moment rotation curve after maximum moment has been reached. Available inelastic rotation depends on both web and flange slenderness ratios. There is interaction between web and flange. Cold formed and hot-formed sections behave similarly in four point bending tests. The moment resistance level depends on the material strength, which may be larger in cold formed sections due increased strength of corners. The moment-rotation curves have similar shape and available rotation values are of same magnitude though numerical differences may be found. There are no clear differences in moment rotation characteristic that reflect the manufacturing method. The current cross-section classification in EN seems to be non conservative for hollow sections. The interaction of web and flange in bending is not considered when slenderness limit are given separately. Also the rotation capacity required to form necessary plastic hinge should be clarified. A more demanding proposal for slenderness limits in class 1 is presented though statistical analyses is still required to set the safety level respective to other section shapes. Instead of cross-section classification more advanced analysis of structurally required rotation compared to available rotation of hollow section members should be used. The available rotation of structural member may be determined experimentally, numerically with calibrated FE simulation or using verified empirical design provision such as Kecman or Kubo model. 74
75 4 Applicability of design rules for tubular connection from CFSHS 4.1 Introduction The joints are typically the most critical points of any constructions. This statement is valid of course for structures made of structural hollow sections. The overall strength of the whole structure is in many cases depends on the load carrying and deformation capacities of the joints. On the other hand, from the fabrication costs point of view, the joints have again the most important role. Therefore special attention should be focused on the design of the joint. The design rules for structural hollow section joints obtained in design codes are developed based on the experimental verification of failure modes and safety level adjusted to experimental resistances. Most of these results, however, are based on tests of hot-formed structural sections (HFSHS) at room temperatures. Relatively few test results are available for cold-formed structural hollow sections (CFSHS) at low temperatures. Characteristic for CFSHS is that high degree of cold forming may decrease the ductility in the corner areas for CFSHS. Due to this higher degree of cold forming, the yield strength of the corner is typically higher than that of the adjacent flat faces, where degree of cold forming is lower and consequently the yield strength is lower but ductility better. This may have influence on the behaviour of hollow section joints. Under external service loads of the joints, the deformations will concentrate in the corners of the section. However, the higher yield strength of the corner area, which restrains the plastic deformation to take place, may direct plastic deformations to the areas adjacent to corners. Thus, even when the ductility would be decreased locally in the corner areas of sections, it will not decrease the overall deformation capacity of the joint. This mismatching effect is applicable as long the flat faces have smaller yield strength than the corners. This assumption is valid if the degree of cold forming in flat face is moderately small. The degree of cold forming in the corner area is more or less independent on the wall slenderness of the section. However, in the flat face the degree of cold forming depends on the b o /t -ratio (if the section has a round shape in the previous fabrication state). Therefore the b o /t -ratio should correlate to the general degree of the cold forming of the cross section. In order to study the most critical joint configurations with respect to deformation capacity, the section sizes are chosen in the way that the degree of cold forming is chosen to be high level. Thus the sections with small b o /t -ratio are chosen for test specimens. It is obvious, that the ultimate loading carrying capacity may not become critical but the deformation capacity, when the applicability of cold formed structural hollow sections for structural use is considered. The potentially decreased deformation capacity may not occur in room temperatures but in lower temperatures. Thus the tests are carried out in low test temperatures as well. Therefore the main objective is to validate the applicability of current design rules in Eurocode 3, Part 1.8 for cold-formed structural section joints, when the degree of the cold forming is high and the service temperature is low. Secondary objective is to define the critical parameters, which correlate to the capacity of the joint. The deformation capacity of the joint can be restricted by preventing the plastic deformation to take place. This will happened partly due to the gap geometry itself, where the free deformation of the chord face in transverse direction is prevented by adjacent brace members. The pretension of the chord member will decrease the deformation capacity of the joint as well. Thus pretension of the chord member was included in K- and X-joint tests series. Behaviour of CFSHS in welded connections is 75
76 studied with K-joint and X-joint test in normal and at low temperatures. The test programme comprised of altogether 41 K-joint test and 32 X-joint tests (2 executed at LUT and 12 at University of Pisa). 4.2 Methods and materials Analysing methods The ductility of the joint is depending on many parameters. The geometrical parameters can be taking into account in a theoretical model, but the other parameters like chemical composition, heat input and metallurgical phenomena are still impossible to include in any theoretical model. Therefore, the validation of design rules must be done with experimentally. Considering K- and X-joints, the deformation capacities are restricted in those joints by quite different mechanisms. Therefore both type of joints are included in this investigation. The results from experimental test will be compared to capacities defined by theoretical models given in current design code Eurocode 3, Part 1.8 [4-1]. For the deformation capacity of the joint, the reference value is a generally accepted limit for plastic deformation.1*b for = b 1 /b <1 and.5*b for =1, where b 1 is width of the brace member and b with of the chord, respectively Materials There are different kinds of cold-formed section depending for example on the chemical composition and fabrication method. Therefore CFSHS from two different manufacturers (A and B) are chosen for the test specimen. Also some hot-formed sections (HF) are tested form comparison. Taking into account the availability of different type hollow section tubes the S355 steel grade was chosen for the base material of the tubes. The tests seen in Table 4-1 for the material used in experimental tests are carried out. The results of these analysis are seen in test reports [4-2] and [4-3]. Table 4-1.Material characteristics determined from test specimen. Test test temperature parameters chemical compositions room carbon contents C equivalent carbon contents C equ coupon test same as joint temperature +2-6 C yield strength f y tensile strength f u, ultimate elongation A5 Charpy V- tests +2-1 C - 5 % - ductile area of fractured surface 4.3 Experimental tests Test specimen In K-joints the sections of brace members are typically smaller than the section of chord member (=b 1 /b <1). The gap type joints are preferred to lap type joints from fabrication point of view. In this type of K-joints the gap is critical area of the joint. The deformation capacity of the joint is highly depend on the deformation capacity of the gap. The deformation capacity of the gap is depend on the ductility of the flat face of the section and the geometry. The smaller the b o /t -ratio, the higher is the degree of cold forming. In addition, the smaller the gap size is compared to width of the chord (g/b ratio), the bigger are plastic strain concentrations. In order to find lower limit for deformation capacity, the test specimens are chosen to have gap sizes 76

77 near the lower limits allowed in the design code. In order to keep the geometry of the joint as simply as possible, the joints are designed to be symmetrical. The schematic picture of tested K-joint is seen in Figure 4-1. The geometrical parameters are seen in Table 4-2, where L 1 and b 1 * are distances from weld toe to weld of the tension brace, L 1 in longitudinal direction of chord member and b 1 * in transverse direction, respectively Figure 4-1. Joint geometry for K-joints. Figure 4-2. Joint geometry for X-joints. In X-joints the corners of the chord member are the critical areas. If the width of the brace members is smaller than that of the chord member (<1), the transverse ligaments between the corner of the chord and the fixing weld of the brace member are the critical areas. If the width of the brace and chord members are equal (=1), either the web side of the chord member or the parallel flat face of the brace member is critical. In both X-joint types the degree of cold forming of the flat faces will be the critical parameter when the deformation capacity of the joint is considered. In principle the X-joint will be even more critical than the K-joint concerning the degree of cold forming, while the transverse direction of the section is the critical direction, which is the major direction of cold forming as well. In K-joint only the transverse component of the brace load is actually critical. On the other hand the joint area is bigger in K-joint when compared to the cross section of the brace member thus decreasing the nominal stress level of joint. In spite of this, the K-joint area can be the critical part of the structure, if the gap size is small and the ductility of the flat face is reduced. The schematic picture of tested X-joints is seen in Figure 4-2 and the geometrical parameters are seen in Tables 4-3 and
78 Table 4-2. Dimensions for K-joints. Chord Brace Joint Speci- g men id b x h x t [mm] b /t b 1 x h 1 x t 1 [mm] b 1 /t 1 = b 1 /b [mm] R [mm] R i [mm] 1 [º] 2 [º] b 1 * L 1 [mm] [mm] K1 1.1 x 1.8 x x 8.4 x K2 1.5 x 1.2 x x 5. x K x 1.2 x x 5.1 x K4 1.2 x 1.7 x x 5. x K5 1.1 x 1.9 x x 7.1 x K6 1.1 x 1.7 x x 1.2 x K7 1.1 x 1.7 x x 5. x K8 1.4 x 1.2 x x 5. x K9 1. x 1.1 x x 5. x K1 1.4 x 1.2 x x 5. x K x 1.2 x x 5. x K x 1.2 x x 5. x K x 1.2 x x 5. x K x 1.1 x x 5.1x K x 1.4 x x 5.2 x K x 1.1 x x 5.1 x K x 1.3 x x 5.1 x K18 1.1x 1.2 x x 5.2 x K x 99.8 x x 5.1 x K2 1.2 x 1.4 x x 5.1 x K x 99.9 x x 49.9 x K x 1.3 x x 5.1 x K x 1.2 x x 5.2 x K x 1.3 x x 5.2 x K x 1.2 x x 5.4 x K x 15.3 x x 8.1 x K x 15.2 x x 8.2 x K x 15.4 x x 8.1 x K x 15.3 x x 8.2 x K x 15.2 x x 8.1 x K x 15.1 x x 79.9 x K x 15. x x 79.8 x K x 15.1 x x 8.1 x K x 15.4 x x 8.2 x K x 15.3 x x 8.4 x K x 1.3 x x 5.1 x K x 15.3 x x 8.3 x K x 15.1 x x 8.2 x K x 15.4 x x 8.2 x K x 15.2 x x 1.1 x K x 15.2 x x 1.2 x
79 Table 4-3. Dimensions for X-joints tested at LUT. Test Specim en Id Chord Braces Joint b x h [mm] R [mm] r [mm] b 1 x h 1 [mm] R 1 [mm] r 1 [mm] b w *) [mm] X3A 1.2x1.3x x1.3x X3B 1.2x1.3x x1.3x X4 1.2x1.3x x1.3x X6 99.8x99.8x x99.8x X8 99.8x99.9x x99.9x X x99.9x x99.9x X x99.9x x99.9x X x99.9x x99.9x X2 99.8x99.9x x5.3x X x99.9x x5.3x X x99.8x x99.8x X x99.8x x5.3x X x1.1x x1.1x X x1.1x x5.2x X26 1.2x1.3x x1.3x X27 1.2x1.3x x5.3x X28 1.5x1.3x x1.3x X29 1.5x1.3x x5.3x X3 15.1x15.x x8.2x X x15.4x x8.4x *) b w and h W are distances between from weld toe to weld toe relating to width and length of the joint area. Table 4-4. Dimensions X-joint tests tested at University of Pisa. Main parameters Special variables Chord Braces Joint Conditions Materials Failure (EC3) b xh xt b /t b 1 xh 1 xt 1 b 1 /t 1 =b 1 /b T F chord Type C eqv W=Web No CFSHS <.4 F No CFSHS <.4 F No HFSHS <.4 F No CFSHS >.4 F F=Flange B = brace Notes No CFSHS <.4 F K-joint chord No CFSHS <.4 W F u = 86 kn No CFSHS <.4 F No HFSHS <.4 F No CFSHS <.4 F F u = 24 kn No CFSHS <.4 B No CFSHS <.4 B/W? F u = 8 kn No HFSHS <.4 W See X1 h w *) [mm] 79
80 4.3.2 Test set up The statically illustration of test arrangement for K- and X-joints are seen in Figure 4-3. The special test parameters are seen in Table 4-5 and Table 4-6. The test arrangement for K- and X-joint can be seen in Figure 4-4 for LUT tests and in Figure 4-5 for University of Pisa tests. In both cases the low temperatures are arranged by circulating a coolant inside the test specimens. The test specimen is isolated by a mat made of plastic foam. This makes the installation of measuring devices rather difficult as well the observation of the joint behaviour during the test. The test specimens are instrumented by strain gauges and by local and global displacement transducers. Figure 4-3. Statical description of test set up in K-joint and X-joint test. Table 4-5. The special test parameters for X-joints tested at LUT. # b o x h x t b 1 x h 1 x t 1 type Manufacturer F chord T X3A 1x1x8 1x1x8 CFSHS A 58/6 +2 X3B 1x1x8 1x1x8 CFSHS A 58/6 +2 X4 1x1x8 1x1x8 CFSHS A / +2 X6 1x1x8 1x1x8 HFSHS HF 58/6 +2 X8 1x1x8 1x1x8 CFSHS B 58/6 +2 X13 1x1x1 1x1x1 CFSHS A 69/6 +2 X18 1x1x1 1 x1x1 CFSHS A 69/6-4 X19 1x1x1 1 x1x1 CFSHS A 69/6-6 X2 1x1x1 5 x5x5 CFSHS A 69/6-4 X21 1x1x1 5 x5x5 CFSHS A 69/6-6 X22 1x1x1 1 x1x1 HFSHS HF 69/6-4 X23 1x1x1 5 x5x5 HFSHS HF 69/6-4 X24 1x1x1 1 x1x1 CFSHS B 69/6-4 X25 1x1x1 5 x5x5 CFSHS B 69/6-4 X26 1x1x8 1 x1x8 CFSHS A 58/6-4 X27 1x1x8 5 x5x5 CFSHS A 58/6-4 X28 1x1x6 1 x1x6 CFSHS A 461/6-4 X29 1x1x6 5 x5x5 CFSHS A 461/6-4 X3 15x15x x8x6 CFSHS A 132/6-4 X32 15x15x1 8 x8x6 CFSHS A 112/6-4 8
81 Table 4-6. The special test parameters for K-joints. b # o x h x t b 1 x h 1 x t 1 type Manufacturer F chord T K1 1 x 1 x 6 8 x 8 x 5 CFSHS A +2 K2 1 x 1 x 8 5 x 5 x 5 CFSHS A 58-4 K3 1 x 1 x 8 5 x 5 x 5 CFSHS A 58-4 K4 1 x 1 x 8 5 x 5 x 5 CFSHS A 58-4 K5 1 x 1 x 8 7 x 7 x 5 CFSHS A 58-4 K6 1 x 1 x 8 1 x1 x 6 CFSHS A -4 K7 1 x 1 x 6 5 x 5 x 5 CFSHS A 46-4 K8 1 x 1 x 6 5 x 5 x 5 CFSHS A 46-6 K9 1 x 1 x 8 5 x 5 x 5 CFSHS A 58-6 K1 1 x 1 x 6 5 x 5 x 5 CFSHS A -6 K11 1 x 1 x 6 5 x 5 x 5 CFSHS A 46-6 K12 1 x 1 x 6 5 x 5 x 5 CFSHS A 46-4 K13 1 x 1 x 6 5 x 5 x 5 CFSHS A K14 1 x 1 x 6 5 x 5 x 5 CFSHS A K15 1 x 1 x 6 5 x 5 x 5 CFSHS A 46-4 K16 1 x 1 x 6 5 x 5 x 5 CFSHS B 46-4 K17 1 x 1 x 8 5 x 5 x 5 CFSHS B 58-6 K18 1 x 1 x 6 5 x 5 x 5 CFSHS B 46-2 K19 1 x 1 x 6 5 x 5 x 5 CFSHS B 46-2 K2 1 x 1 x 6 5 x 5 x 5 HFSHS HF 46-6 K21 1 x 1 x 6 5 x 5 x 5 CFSHS B K22 1 x 1 x 6 5 x 5 x 5 HFSHS HF 46-4 K23 1 x 1 x 6 5 x 5 x 5 HFSHS HF K24 1 x 1 x 6 5 x 5 x 5 HFSHS HF 46-6 K25 1 x 1 x 8 5 x 5 x 5 HFSHS HF 58-6 K26 15 x 15 x 1 8 x 8 x 6 CFSHS A 11-6 K27 15 x 15 x 1 8 x 8 x 6 CFSHS A K28 15 x 15 x 1 8 x 8 x 6 CFSHS A 11-4 K29 15 x 15 x 1 8 x 8 x 6 CFSHS A 11-6 K3 15 x 15 x 1 8 x 8 x 6 CFSHS A K31 15 x 15 x 1 8 x 8 x 6 HFSHS HF 11-6 K32 15 x 15 x 1 8 x 8 x 6 HFSHS HF K33 15 x 15 x 8 8 x 8 x 6 CFSHS A 92-6 K34 15 x 15 x 8 8 x 8 x 6 CFSHS A 92-6 K35 15 x 15 x 8 8 x 8 x 6 CFSHS A K36 1 x 1 x 6 5 x 5 x 5 HFSHS HF 46-6 K37 15 x 15 x 6 8 x 8 x 6 CFSHS A 72-6 K38 15 x 15 x 6 8 x 8 x 6 CFSHS A 72-6 K39 15 x 15 x 6 8 x 8 x 6 CFSHS A K4 15 x 15 x 6 1 x 1 x 6 CFSHS A 72-4 K41 15 x 15 x 8 1 x 1 x 6 CFSHS A

 is seen in Figure 4-6, where the")


82 Figure 4-4. Test set up for K- and X-joint tests executed in LUT. X-joint test arrangement. Mounting of inductive transducers Figure 4-5. Connection details and test set up for X-joint tests executed at University of Pisa. 4.4 Test Results A typical test result for K-joint (22) is seen in Figure 4-6, where the displacements perpendicular to the chord and the displacement in the end of tension brace versus the applied load are illustrated. Based on the simple drawing method the ultimate load F u and the plastic deformation p are presented as well. In Figure 4-7 is illustrated the same diagram for a X-joint X6. The three common failure mode are seen in Figure 4-8 for K- and X-joints. 82
83 K22 Force-displacement curves 5 4 Force [kn] Tension side Compression side End of tension brace Displacement [mm] Figure 4-6. Force-displacement curves for a K-joint K22. X4A Force-Diplacement Curves Force [kn] ends of braces joint local Displacement [mm] Figure 4-7. Force-displacement curves for X joints X4A. 83

.")


84 Figure 4-8. Typical failures for K- (left) and X-joint (right side). Failure mode can be ductile or partly brittle. In the following Tables 4-7 and 4-8 different tests are compared to each other to highlight some relationships or influences of effect of low temperature and differences between cold formed and hotformed sections. 84
85 Table 4-7. Influence of low temperature on the load resistances. Test b h t [mm] b 1 h 1 t 1 [mm] b /t b 1 /t 1 =b 1 /b Type T [ C] F chord [kn] N 1 [kn] p /b o [%] Failure mode CF B B 3-B CF B C C CF B * B * B HF * B B CF * B * B * B CF C C CF C C 1 45 crack in chord web. * marked sections did not fail from joint but from members. B is brace failure and C chord failure. Table 4-8. Influence of manufacturing method on the load resistances. Test b h t [mm] b 1 h 1 t 1 [mm] b /t b 1 /t 1 = b 1 /b T [ C] Typ e F chord [kn] N 1 [kn] p /b o [%] Failure mode CF B 5 HF C flan 3-B CF B 4 CF C 6 HF C flan CF B 12 HF * CF C flan 17 HF B CF * B 22 HF B CF * B 23 HF B * marked sections did not fail from joint but from members. B is brace failure and C chord failure. Following conclusion may be drawn: Decrease of testing temperature seems to increase resistance of the X-joint but also in most of the cases the deformation capacity of X-joint. The resistance in the X-joint tests for hot formed and cold formed is of same magnitude thus some deviation may be seen from the results. The deformation capacity don t show clear tendency while some cold formed joints did not fail from the joint but form the member. 85
86 4.5 Evaluation of test results The theoretical capacities for each joint are calculated according Eurocode 3, Part 1.8. Because the chord loading is tension, the tensile brace loading capacity can be find by the any of following formulas obtaining the lowest capacity for the K-joints: F y 8.9 f y, t sin 1 2 b1b2 2b b 2t if flange of the chord is critical (F) (4-1) F F f y t 2h 3 sin 1 4g 1 3t b 4 y 2 y f y t1 h1 4t1 b1 eff 1 2 if the web of the chord is critical (W) (4-2) 2 b if the brace is critical (B) (4-3) where b eff 1b t f 2 1 y, b (4-4) 1 b t1 f y,.1 And for X-joints, respectively: 2 f y t 2 Fy 4 (1 )sin sin F f y t 2h1 1t sin sin y 1 if flange of the chord is critical (F) and.85 (4-5) if the web of the chord is critical (W) and = 1. (4-6) y y eff F f t h 4t 2b if the brace is critical (B) and >.85 (4-7) where b eff 1b t f 2 1 y, b (4-8) 1 b t1 f y,.1 Failure of specimen can occur in four different places: Failure of a brace member (B); Failure in the flange of a chord (F); Failure of a chord member (C) and Failure in the web of a chord member (W). In Table 4-9. are seen the test results for K-joint tests and the theoretical capacities based on measured joint geometry and nominal yield strength. The capacity based on real yield strength and an informal ultimate capacity based on ultimate strength is presented as well. In the most tests the primary failure mode was ductile (d) except in one test K31 it was brittle (b). In several cases a ductile primary failure mode was followed by brittle (b) type secondary failure. This is presented by the symbol db in table 4-5. In some early tests the buckling (bc) of compression member (local or global) was the critical mode. In Tables 4-1 and 4-11 are presented the results for X-joints, respectively. 86
87 Table 4-9. Test results for K-joints. Id. number p /bo [%] F u [kn] Test Eurocode 3, Part 1.8 Comparison Ftest 3 % kn] failure mode F y,355 [kn] F y,2 [kn] F u [kn] failure mode F u,test F y,355 F u,test F y,.2 F u,test F u,cal K1.5* 67 B, bc F K2 1.* 465 B, db FB K3 1.5* 485 B, d FB K4 1.5* 49 B, d FB K5.1* 66 B, bc B K6.* 999 W, d W K F, d F K C, db F K B, d F K F, db F K C, db F K F, d F K F, d F K F, d F K C, db F K C, db F K17 1.* 54 B, d FB K B, d F K F, d F K F, db F K F, d F K F, d F K F, d F K F, db F K F, d FB K C, db F K27.9* 918 B, d F K F, d F K C, db F K3 2.7* 915 B, d F K C, b F K F, d F K C, db F K C, db F K B, d F K F, d F K C, db F K C, db F K F, d F K F, d F K C, db F * The joint did not fail but the member in tension broke. Average Stdev
88 Table 4-1. Test results of X-joints tested at LUT. Id. number p bo [%] ultimate load F u [kn] Test Calculation F EC3 Comparison load related to 3 % [kn] failure mode W=web B= Brace F=Flange F y,355 [kn] F y,2 [kn] F u [kn] failure mode W=web B=brace F=flange F u,test F y,355 F u,test F y,.2 F u,test F u F u,test3% X3A W/d W X3B B/d W X W/d W X W/d W X W/d W X13 2* 162 B/d W X18 2.5* 175 B/d W X19 3* B/d W X2 1.5* 455 B/d F X21 1.5* 468 B/d F X W/db W X B/d W X24 3.5* B/db W X B/db F X W/db W X B/db F X W/db W X F/d F X B/db F X B/db F * The joint did not fail but the member in tension broke. F u or F u,test F u Average Stdev In Figure 4-9 the relative capacities (a test value divided by a theoretical value) for K- and X-joints are illustrated. 88
89 test/calculated K1 K2 K3 K4 K5 K6 K7 K8 K9 K1 K1 1 K1 2 K1 3 relative ultimate strenght K1 4 K1 5 K1 6 K1 7 K1 8 K1 9 "Fu,test/Fy, Fu,tests/Fy,o K2 K2 1 joints K2 2 K2 3 K2 4 K2 5 K2 6 K2 7 K2 8 K2 9 K3 K3 1 K3 2 K3 3 K3 4 K3 5 K3 6 K3 7 K3 8 K3 9 K4 K4 1 test/calculated relative ultimate strenght Fu,test/Fy, Fu,test/Fy, joint members Figure 4-9. Relative strength (= F test /F calculated ) of the K- (upper) and X-joints (lower). Table Comparison of experimental and theoretical resistances at the room temperature. Test N. Location of failure at test EC3 Failure mode p /bo [%] P u [kn] N 1,Rd [kn] N P u 1,Rd 1 brace chord flange brace chord flange chord flange chord flange brace+chord flange chord flange chord flange chord flange chord flange+brace brace brace chord flange brace chord flange 7* brace chord flange brace brace chord+brace Brace brace Brace
90 The tests results were analyzed and correlation of different variables to analysis result was studied. Only the b /t -ratio seems to have clear correlation on the capacity. This correlation is seen in the Figure effect of bo/to-ratio relative capacity Fu/Fy, Fu/Fy, Fu,test/Fy effect of bo/to-ratio in X-joints, T= x1xt o / 1x1xt 1x1xt o / 5x5x5.4.2 b /t = Fu,test/Fy, Fu,test/Fyo Figure 4-1. Effect of the chord flange slenderness on the load carrying capacity. However, although the correlation between the flange slenderness and experimental resistance seems to be clear, the membrane effect increases load carrying resistance rather than the degree of cold forming of the chord section. In the K-joints the membrane effect are not so significant than in X-joints. This is due the gap effect, which is more important effect in the K-joints than the membrane effect and will take place independent on the b /t -ratio. 9
91 4.7 Conclusions and recommendation Main conclusions drawn from tests and their analyses that are valid for both K- and X-joints are: 1. Tested K- and X-joints fulfilled the generally accepted requirements for deformation capacity down to 4C temperatures and most test cases even down to 6C. 2. Present design rules in Eurocode 3, Part 1.8 to estimate resistance of K- and X-joints are safe and may be used both cold formed and hot formed structural hollow sections. 3. Degree of cold forming defined by b/t-ratio seems to be insignificant on the deformation and load carrying capacity of the joints made from CFSHS. 4. The manufacturing method of hollow sections (cold- or hot-formed) does not show significant differences in behaviour down to 4C test temperatures, when the performance of joints were compared. Following secondary conclusion and recommendations can be draw from results: Good correlation between load carrying capacity of joints and parameters varied in the test programme (material properties and joint geometry) could not be found. The small gap size (much smaller than allowed in Eurocode 3, Part 1.8) did not have significant influence on the resistance of K-joints. The limitation could be altered.. The calculation model predicted well the ultimate failure mode for K-joints (better than for X- joints). Some exceptions were found where two competing theoretical failure modes were close to each other. The resistance prediction calculated with the measured ultimate strength of base material matched well with the experimental resistance of tested joint. The results were even better, when the 3 % deformation limit was taken into account, when defined the ultimate capacity from test. The decrease of temperature seems to increase the load carrying capacity, when the temperature is decreased from room temperature to 4 C -6 C, if no brittle failure takes place. The primary failure mode was ductile in almost all cases down to 4 C and in most cases down to 6 C followed either by secondary brittle or ductile failure. Only with one hot formed K-joint (K31) the failure mode was fully brittle at 6 C. The larger the b /t -ratio, the bigger the relative load carrying capacity. This is valid especially for X-joints. However, this seems not to be due to the degree of cold forming but rather due to the membrane effect, which takes place more prominent in chord with large slenderness. The chord pretension seems to decrease the deformation capacity of the joint. The eccentricities of joints were small and seem to have no influence on the joint capacity. The weld geometry on the corner area of the chord is important in the case of X-joints, when =1. The additional weld passes with smooth surface and less eccentricity introduce considerable more load capacity. A good fusion of fillet weld in joint is a very important quality factor especially when wall thickness of chord is remarkable larger than wall thickness of brace member. 91
92
93 5 Extension of applicability of design rules for tubular connections 5.1 Aim of the investigation Eurocode 3 (pren : 23) [5-1] provides design guidelines for rectangular hollow sections joints made of members having b/t ratios smaller than 35. In practice, there is an increasing demand to use more slender sections. These sections are already regulated in technical delivery conditions such as EN 121 [5-2] or EN 1219 [5-3]. The present product ranges of the manufacturers are however much wider, especially for cold formed sections. Hollow sections offer a number of favourable characteristics with respect to load carrying capacity and function. Because of its closed shape and the missing definitive strong axis, they possess high torsional stiffness, almost balanced flexural rigidity in all directions and almost equal buckling behaviour about both major axes. Therefore, they are optimally suited for resisting loads in varying directions, which occur for wind or wave loading. In addition to these functional advantages, hollow sections offer attractive scopes for design. Design rules backed by experimental tests for K-Joints with gap made out of rectangular hollow sections (RHS) are given, for example, in Eurocode 3 [5-1]. Here, the allowable width-thickness ratios of welded RHS K-Joints with gap are limited to 35. In addition to the slenderness limits, Eurocode 3 [5-1] gives a restriction for the gap size. Table 5-1. Range of validity for welded RHS K joints with gap according to pren [5-1]. Braces Chord Chord and Braces Gap size Brace Angles Compression Tension b /t and h /t b,2 t1, 2 and t 1 h1,2 1, 2 and Class b b,6 2 b b,2 t1, 2 and t 1 h1,2 1, ) and Class 2 h /b and h 1,2 /b 1,2.5 but 2. b 1,2 /b g.35 and b.1.1 t 1 t t 2,5 1 b 1,5 (1 ) b Notes: 1 if g/b > (1-) and g/b > t 1 + t 2 treat the joint as two separate T or Y joints Hot finished hollow sections, which were the basis of previous research work, mostly comply with this limiting value (up to 9 % of the sections in EN [5-2]). The cold formed hollow sections conforming to EN [5-3] however often reach values of h/t = 4, even for small sections such as 8 x 4 x 2.mm. In practice, there is an increasing demand to use more slender sections for trusses, lattice girders, conservatories, greenhouses and also masts and cranes. These slender sections are also standardised in EN [5-3], the stock lists of the manufacturers giving even more sections outside the allowable limits. The use of these sections is therefore only permissible in many countries (e.g. Germany) by experimental verifications and expert advice, followed by acceptance for individual cases. 93
94 5.1.1 Test programme In Table 5-2, the geometrical dimensions and the geometrical parameters of the test specimens are shown in detail. The test programme aims to determine the influence of varying parameters on the load carrying behaviour with b /t -ratios and gap sizes outside the range covered at present. All test specimens possess a symmetrical arrangement of the braces, so that b 1 = b 1,2 ; h 1 = h 1,2 ; 1 = 1,2 etc. The specimens KJ-1 to KJ-4 are made of steel grade S355, while the specimens KJ-41 to KJ-47 are made of S46. In addition to the chord slenderness 2 Eurocode 3 [5-1] limits the non-dimensional gap size g min to a lower bound of 1 b g 1 2 b 1,2 2 g min (5-1) b 2 t 2 h 1 t 1 b1 h2 g b +e t h Figure K -joint geometry. The fabrication of the welded connections, however, requires a minimum non-dimensional gap size g min.w of only g t t t 1 2 1,2 2 2 gmin,w g min t t (6-2) 94
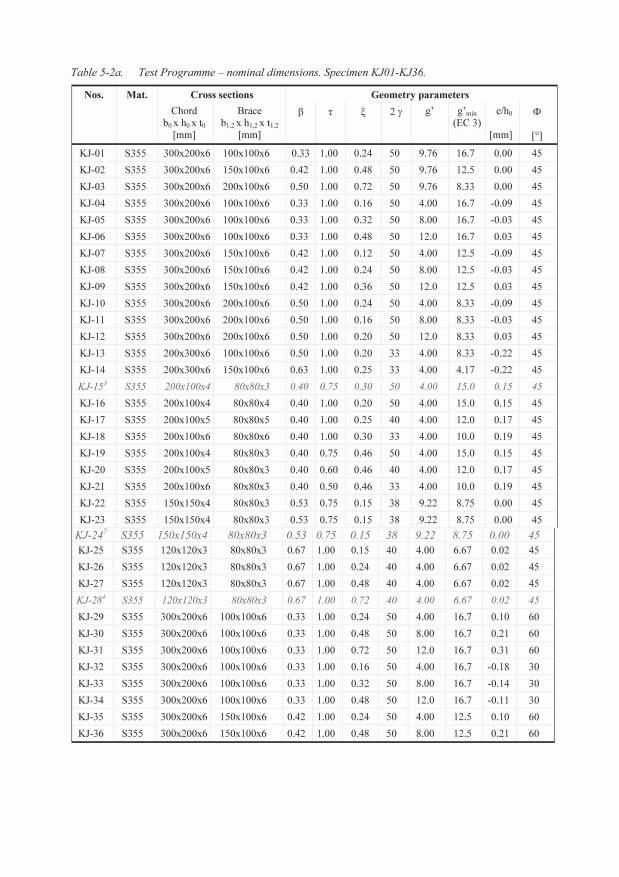
95 95
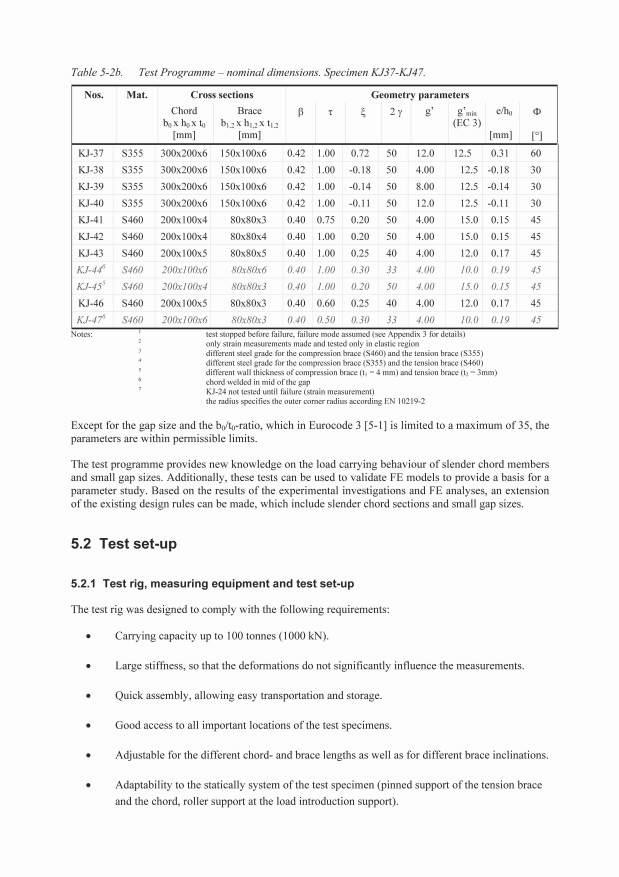
96 96
97 Applied load Reaction force Roller Pin Brace Brace Reaction force Chord Pin l = 5 b l = 5 b Figure 5-2. Statically system of the test set-up. The test rig consists of a base (HE 45 M) to which a column (HE 45 M) is rigidly fixed. The load is introduced to the compression brace by a hydraulic jack (1kN) placed on the base. The adjacent brace is subjected to tension due to reaction forces. The tension brace is attached to a hinge, which is connected by four threaded bolts (M2 1.9) and a plate (47x26x3 mm, S46) behind the column. The top of the column is supported by a strut (HE 3 A) with bolts. At the top and opposite side of the column, the chord support (eye bar) is welded on. For test specimens with small dimensions, an additional chord support can be bolted to the column at a lower level. eye bar eye bar packing pieces load cell lining filler plates Knoten KJ-1 Gurt bxhxt 3x2x6. Streben bxhxt 1x1x6. g' = 9.76 load introduction hydraulic jack threaded bolts column strut base bar Figure 5-3. Test set-up for large K joints and a brace angle of 45. Since the geometrical dimensions of the test specimens are different, the test set-up must be able to accommodate different chord- and brace lengths and varying brace angles too. Therefore, adjustments are made with packing pieces and filler plates. Drawings of the test rig are shown in Appendix 7. The load is manually introduced by a hydraulic jack (Lukas 1 kn) as compression load on one brace, so that the other brace is reacted by tension and the chord by compression loading. Due to the height of the main jack in use, some tests (KJ-35 to KJ-4) have had to be carried out with a shorter 97
98 jack (Weber). This jack however offers a limited ultimate load (approx. 6 kn) as well as a limited gauge length (approx. 5 mm). Below the support to the compression brace, a load cell (Hottinger Baldwin, 1 kn) is provided. To record the local displacements, linear voltage displacement transducers (LVDT - Hottinger Baldwin W5) are used. The data acquisition system and measuring amplifier is provided by a SPIDER 8 (Hottinger Baldwin) using CATMAN (Software) Version 3 and 4. This testing arrangement was chosen because it gives lower (more conservative) ultimate loads than a test set-up with the loaded chord in tension. The supports are provided as hinges so that bending moments are only caused due to eccentricities at the joint and secondary effects Load introduction The first test (KJ-16) was initially begun with a swivel bearing. Because this support allows an easy horizontal shift, it was replaced by a socket support for this specimen (KJ-16). brace brace end plate end plate centre of rotation pin socket support horizontal deflection centre of rotation Figure 5-4. Different load introduction used. The socket support was used for all tests except tests KJ-3, KJ-1, KJ-11 KJ-12 and KJ-14. For these tests, no bearing could be placed due to lack of space, so that the compression brace had to be loaded directly by the jack. An additionally carried out FE analysis were performed for these specimens, which show this does not have a significant influence on results. 5.3 Measuring arrangement and measuring methods The number of measuring points is limited by the used measuring system (Spider 8), which offers 8 channels for a continuous recording of measurement. The applied load is recorded using channel. Figure 5-5 shows the positions between which the measurements of deformation are taken for the experimental investigations and the algebraic sign defines the direction of the positive local displacement measurements. Furthermore, the relative deformations calculated from the measurements are defined. 98
99 F MP 1 + MP 2 MP 3 CF + MP 4 CSW CSW1 CF+CSW Figure 5-5. Position of the measured points. MP 5 MP 6 The relative displacement CF refers to the chord face deformation. CSW refers to the in-plane deformation of the chord side-wall including any rotation of the corners, while CSW1 refers to the chord side-wall in-plane deformation excluding the rotation of the corners and, hence, gives the actual inplane deformation of the chord side-wall. For the preliminary test KJ-16, plates at 9 offset to the measurement direction are glued to the measuring points. Because it is difficult to measure at the desired locations exactly, thin pins were glued into superficially drilled holes ( 2 mm) for the tests KJ-15 and KJ-17 to KJ-23. At the top of the pins, plates are fixed, to which the LVDTs are attached. This method provides a much more exact determination of the measurements but was changed again, because the measurement error due to a rotation of the measuring points should be minimised. Finally, eyelets were screwed into tapped holes and wires attached. At the end of the wires the LVDTs had been fixed. To optimise the measurements, a steel cored twine (fishing line) was used later. For the strain measurements, a manual changeover switch was used, because it was sufficient to measure the strains at fixed load steps only. 5.4 Fabrication and geometry of test specimens For the chord and brace sections, cold formed rectangular hollow sections from Rautaruukki Metform, Finland (manufacturer A) and Voest Alpine, Austria (manufacturer B) are used. The production of the specimens was carried out by Fa. Maurer Soehne, Munich, who have much experience in welding hollow structures. To avoid end effects, the minimum brace length l brace is fabricated with a length of five times the brace width. The distance to the pinned ends of the chord from the joint is also five times the chord width. Additionally, the brace angles (both braces simultaneously) are varied between 3 and 6. In Appendix 6, Figure A6-1 and Figure A6-2, parameterised shop drawings of the joints and the braces can be found. The parameters are listed in Table A6-1 and Table A6-2 and define the dimensions of all braces, the chords and the positions of the braces on the chord of each joint. The weld design and the welding procedure specifications are covered by the shop drawings as well. The real dimensions of the delivered hollow sections were measured. The mean values of all measured dimensions are given in the Appendix 6, Table A6-3 and Table A6-4 (hollow sections produced by manufacturer A as well as manufacturer B). A check of the marginal deviations according to DIN EN 1219 [5-3] has also been carried out and the results are listed in these tables. The measurements were carried out for the width b and the height h at 5 positions over the length of each hollow section. The outer and inner corner radii r o and r i have been determined at both ends and all corners using a radius gage, so that 8 measured values for each hollow section are available in all. Finally, the thickness t has been measured at the ends and on all four side walls. On the side wall with 99
100 the seam weld, the thickness was measured on the two sides of the weld. In total, 1 measurements for every hollow section have been carried out. height h, width b thickness t inner and outer corner Radii r o and r i r o r i 5 positions over the length 5 positions at each end each corner at both ends Figure 5-6. Position of measurement. To identify every section used to fabricate a joint, all sections are labelled with an extended batch number, which is annotated on every part (chord and braces) of the joints after fabrication. Due to the large dimensions and the huge number of test specimens, all possess a 3 m thick corrosion protection, so that it is possible to store them outside. After welding, all joints had been sandblasted before painting. 5.5 Material properties The material properties of the sections have been provided by the manufacturers according to the specifications of EN B [5-4]. The characteristic values such as yield strength R p.2, ultimate strength R m and the uniform strain A 5 are determined according to EN12 [5-5] (tensile test), the toughness according to EN145 [5-6] (Charpy V test). Additionally, the chemical composition is determined. The mechanical properties of each batch can be found in Appendix 5. Because the sections of manufacturer B had been delivered without batch numbers, chemical analysis had been carried out from every part of the joints which was delivered by manufacturer B. With the detected chemical composition it was possible to reassign the batch numbers to the parts. 5.6 General observations and results from test All measured dimensions, measurements of the LVDTs, calculated relative displacements, pictures of tests and annotations are shown for every test are documented in the test reports Influence of the gap size parameter g and the width ratio on the load carrying behaviour For small gaps and low to medium -ratios, the gap area is relatively too stiff compared to the other parts around the perimeter. This results in smaller effective widths and therefore smaller punching shear loads. Therefore, Eurocode 3 [5-1] and other standards do not allow the gap to be less than given below, when using the presented punching shear formulae in these standards. b 12 g b (5-3) 1
101 For all tests with a very small gap size (g = 4.) punching shear failure can be observed. The crack runs from one transition radius of the brace to the other through the chord flange. Due to the increased stiffness of the gap region, the effective punching shear length decreases. It can be seen in Figure 5-7 that, with increase of the width ratio of the connection, buckling of the chord webs increasingly becomes the dominant failure mode. Regarding the ultimate loads, the gap size does not have a significant influence. The ultimate load is mainly influenced by the width ratio, increasing with the width ratio. Another observation of the tests is that the stiffness of the connection increases as the gap size decreases (Figure 5-7) and the width ratio increases (Figure 5-8). =,33 KJ-1 g =9,76 KJ-6 g =12, Failure modes KJ-1 PS KJ-4 PS KJ-5 PS KJ-6 PS Displacement [mm] KJ-5 g =8, KJ-4 g =4, Load [kn] =,42 KJ-2 g =9,76 Failure modes KJ-2 BCW KJ-7 PS KJ-8 BCW KJ-9 BCW -8 KJ-9 g =12, Displacement [mm] KJ-8 g =8, KJ-7 g =4, Load [kn] =,5 KJ-3 g =9,76 KJ-12 g =12, Failure modes KJ-3 BCW KJ-1 PS KJ-11 BCW KJ-12 BCW Displacement [mm] KJ-11 g =8, KJ-1 g =4, Load [kn] Figure 5-7. Influence of the gap size g for varying width ratios Failure Modes CF chord face failure PS punching shear failure BCW buckling of chord web failure 11
102 g = 4, KJ-1 =,5 KJ-7 =,42 KJ-4 =, Load [kn] g = 8, KJ-11 =,5 KJ-8 =,42 KJ-5 =, Load [kn] Failure modes KJ-4 PS KJ-7 PS KJ-1 PS -8 Displacement [mm] Failure modes KJ-5 PS KJ-8 BCW KJ-11 PCW Displacement [mm] g = 9,76 KJ-1 =,33 Failure modes KJ-1 PS KJ-2 BCW KJ-3 PCW Displacement [mm] KJ-3 =,5 KJ-2 =, Load [kn] g = 12, KJ-12 =,5 Failure modes KJ-6 PS KJ-9 BCW KJ-12 PCW Displacement [mm] KJ-9 =,42 KJ-6 =, Load [kn] Figure 5-8. Influence of the width ratio for different gap sizes. Failure Modes PS BCW punching shear failure buckling of chord web failure 12
103 5.6.2 Influence of the thickness ratio on the load carrying behaviour The following Table 5-3 show tests with a thickness ratio Table 5-3. Tests with thickness ratios < 1.. No. Thickne Chord Brace sections Gap Width Slenderness Ult. Failure ss ratio section size ratio ratio load mode b x h x t [mm] b 1.2 x h 1.2 x t 1.2 [mm] g 2 F u [kn] KJ x 1 x 4. 8 x 8 x EW KJ x 1 x 4. 8 x 8 x EW KJ x 1 x 5. 8 x 8 x BB KJ x 1 x 6. 8 x 8 x BB KJ x 15 x 4. 8 x 8 x BCW KJ x 15 x 4. 8 x 8 x BCW KJ x 1 x 4. 8 x 8 x BB KJ x 1 x 4. 8 x 8 x EW KJ x 1 x 4. 8 x 8 x 3./ EW KJ x 1 x 5. 8 x 8 x BB KJ x 1 x 6. 8 x 8 x CG Notes: EW BB BCW CG two different brace members (compression brace S46, tension Brace S355) two different brace thicknesses (compression brace t 1 = 4. mm, tension brace t 2 = 3 mm) incorrect weld execution not considered for the evaluation brace failure (effective width) buckling of brace failure buckling of chord web failure crack in the mid of the gap due welding of the chord For thickness ratios < 1., small gap sizes g and low to medium width ratios buckling of the brace (KJ-2, KJ-21, KJ-41, KJ-46) or effective width failure (KJ-15, KJ-19, KJ-32, KJ-33, KJ-34, KJ-42, KJ-45) can be observed during the tests. For effective width failure, the crack runs from one transition radius of the brace to the other through the brace width, next to the gap. As for punching shear failure mentioned before, the stiffness of the gap region is increased compared to the other parts around the perimeter. This result in a smaller effective width b eff and smaller failure loads for brace failure. As the width ratios and gap sizes both increase (KJ-22 and KJ-23), the load is transferred predominantly to the chord webs. Due to this, a change of the failure mode can be observed. For higher width ratios with higher gap sizes, buckling of the chord webs become the predominant failure mode Influence of brace inclination on the load carrying behaviour The effect of varying brace inclinations was determined from tests with different width ratios ( =.33 and.5) and gap sizes g (g = 4, 8 and 12) at brace inclinations of 3, 45 and 6. The comparison of the load displacement curves can seen in Figure 5-9 for =.33 and in Figure 5-1 for =.5. The highest ultimate load is always reached at brace inclinations of 3, the lowest at brace inclinations of 6. When considering the component perpendicular to the chord (F u sin ), it can be seen that there is only a little difference in the values for brace inclinations of 45 and 6 but in case of 3 this load component is significantly reduced (see Table 5-4). Because the load component perpendicular to the chord face is smaller for brace inclinations of 3 brace failure becomes more dominant in case of small gap sizes (reduced effective width). For higher gap sizes where effective length increases, bucking of 13
104 the chord webs becomes dominant instead of punching shear, because of the larger width ratios for higher gap sizes. Table 5-4. Comparisons of test with varying brace inclinations No. Brace angle Chord section Brace sections Gap size Ult. load Failure b x h x t b 1,2 x h 1,2 x t 1,2 g F u F u sin mode [ ] [mm] [mm] [kn] [kn] KJ EW 1 KJ x 2 x 6. 1 x 1 x PS KJ PS KJ EW 1 KJ x 2 x 6. 1 x 1 x PS KJ PS KJ EW KJ x 2 x 6. 1 x 1 x PS 1 KJ PS 4 KJ BCW 2 KJ x 2 x x 1 x PS KJ PS 2 KJ BCW 2 KJ x 2 x x 1 x BCW KJ PS 2, KJ BCW 2 KJ x 2 x x 1 x BCW 5 KJ PS 2 Notes: 1 2 EW PS BCW not identifiable by test, failure mode assumed (see evaluation of tests Appendix A3) not identifiable by test, specimen loaded with shorter jack, failure mode assumed (see evaluation of tests - Appendix A3) brace failure (effective width) punching shear failure buckling of chord web failure As seen before, the ultimate load is not influenced by the gap size significantly but the failure mode is. 14
105 6 6 =,33, g = 4, KJ-32 1,2 =3 KJ-29 1,2 =6 KJ-4 1,2 =45 4 Load [kn] =,33, g = 8, KJ-33 1,2 =3 KJ-3 1,2 =6 KJ-5 1,2 =45 4 Load [kn] Failure modes KJ-4 PS KJ-29 PS KJ-32 EW Displacement [mm] Failure modes KJ-5 PS KJ-3 PS KJ-33 EW -8 Displacement [mm] =,33, g = 12, KJ-34 1,2 =3 6 KJ-31 1,2 =6 KJ-6 1,2 =45 4 Load [kn] Failure modes KJ-6 PS KJ-31 PS KJ-34 EW Displacement [mm] Figure 5-9. Influence of the brace inclinations for =.33 and varying gap sizes g. =,5, g = 4, Failure Modes CF EW PS KJ-38 1,2 =3 chord face failure brace effective width failure punching shear failure KJ-35 1,2 =6 KJ-1 1,2 = Load [kn] =,5, g = 8, KJ-39 1,2 =3 KJ-36 1,2 =6 KJ-11 1,2 = Load [kn] Failure modes KJ-1 PS KJ-35 PS KJ-38 BCW Displacement [mm] Failure modes KJ-11 PS KJ-36 PS KJ-39 BCW -8 Displacement [mm] =,5, g = 12, KJ-4 1,2 =3 6 KJ-37 1,2 =6 KJ-12 1,2 =45 4 Load [kn] Failure modes 2 KJ-12 BCW KJ-37 PS KJ-4 BCW Displacement [mm] Figure 5-1. Influence of the brace inclinations for =.5 and varying gap sizes g. Failure Modes PS punching shear failure BCW buckling of chord web failure 15
106 5.6.4 Influence of material properties on the load carrying behaviour To determine the influence of the mechanical properties on the load carrying behaviour, the following tests are carried out. Table 5-5. Similar tests with different mechanical properties. Tests with steel grade S No. F u Corresponding tests with steel grade No. F u Chord section Brace sections Comparison b x h x t b 12 x h 12 x t 12 [kn] [kn] [mm] [mm] KJ KJ x 1 x 4. 8 x 8 x KJ KJ x 1 x 4. 8 x 8 x KJ KJ x 1 x 4. 8 x 8 x 4. - KJ KJ x 1 x 5. 8 x 8 x KJ KJ x 1 x 6. 8 x 8 x 6. - KJ KJ x 1 x 5. 8 x 8 x KJ KJ x 1 x 6. 8 x 8 x 3. - Notes: preliminary test not considered for the evaluation incorrect weld execution not considered for the evaluation two different brace members two different brace thicknesses F u 46 /F u 355 Because of incorrect welding on test specimens KJ-44 and KJ-47, the comparable tests KJ-18 and KJ- 21 cannot be used for the evaluation to check the influence of the material quality. Additionally, the preliminary test KJ-16 (and therefore test KJ-42) is not used for this comparison. Although KJ-15 and KJ-45 have different brace sections, the comparison is included here, because it is assumed that this will not have a significant influence to the load carrying behaviour. As can be seen from Figure 5-11, the mechanical properties of the material used have only a negligible influence on the load carrying behaviour. Neither the ratio of the ultimate strengths nor the ratio of the yield strengths is reached in the tests. KJ-17: KJ-43: S355 S46 4 KJ-2: KJ-43: S355 S46 KJ-46 4 KJ-43 KJ-17 2 Laod [kn] KJ-2 2 Load [kn] Failure modes KJ-17 PS KJ-43 PS Failure modes KJ-2 BB KJ-46 BB -4 Displacement [mm] Displacement [mm] Figure Comparison of joints with the same geometrical parameters and different steel grades. Failure Modes PS BB punching shear failure buckling of brace failure F F 46 u 355 u f f 46 y 355 y
107 Both tests, KJ-17 and KJ-43, failed by punching shear failure. The crack always runs through the heat affected zone of the welds. It is possible that the mechanical properties of the steel grade S46 are changed by heating caused by welding in this area. The tests KJ-2 and KJ-46 failed by local buckling of the brace. Assuming a strut for the local buckling failure, the reference slenderness can be defined as a function of the characteristic slenderness as follows: a E f y Additionally the reduction factor is dependent upon the buckling curve. For cold formed hollow sections, buckling curve C has to be used. On this basis, there will be an influence of E f y f a y a E f y 46 f y 1.14 in case of buckling of the brace. The observed ratio for the tests KJ-2 and KJ-46 is Influence of imperfections For some tests (see Table 5-6) the specimens are from the same batch and are therefore well suited for observing the influence of imperfections. Although the specimens have the same geometrical dimensions and the tests are carried out with the same testing conditions, differences of the ultimate loads can be observed. This can be attributed to geometrical imperfections of the sections, imperfections of the test specimens due to inaccurate fabrication and measurement errors, which could not totally be avoided during experimental testing. The effects of imperfections can be seen in the comparison of the load-displacement curves (Figure 5-12). Table 5-6. Comparison of tests with same geometrical dimensions. Tests with same geometry parameters Chord section Brace sections Gap Comparison size No. Material F u F u,m Failure b x h x t b 1,2 x h 1,2 x t 1,2 g F u /F u,m [kn] [kn] mode [mm] [mm] KJ-25 S x 12.2 x x 8. x 2.8/ KJ-26 S x 12.2 x x 8. x 2.8/ BCW 4. KJ-27 S x 12.2 x x 8. x 2.8/2.9.9 KJ-28 1 S355/S x 12.2 x x 8. x 2.9/ KJ-22 S x 15.2 x x 8. x 3./ BCW 9.22 KJ-23 S x 15.2 x x 8. x 3./ KJ-15 2 S355/S x 1.9 x x 8.1 x 3./ EW 4. KJ-19 S x 1.9 x x 8. x 3./3..9 KJ-41 S BB 2. x 1. x x 8. x 3./ KJ S EW x 99.9 x 4. 8:3 x 8:3 X 4./ Notes: BCW EW BB two different brace members (compression brace S355, tension brace S46) two different brace members (compression brace S46, tension brace S355) two different brace thicknesses (compression brace t = 4mm, tension brace t = 3mm) buckling of chord web failure brace failure (effective width) buckling of brace failure In Table 5-6 all relevant parameters of the specimens can be found. The comparison of the results F u is carried out in reference to the mean values F u,m of the tests with the same geometry. The braces of the 17
108 test specimens KJ-15 and KJ-45 and KJ-28 are produced from different charges, as determined by the chemical analysis. The results of these tests should be therefore be interpreted with care. The difference in ultimate loads for the comparable tests in Table 5-6 is within a range of 1% for all tests except those which failed by effective width failure of the brace in tension. It is well known that tensile failure is unpredictable due to local variations in material or geometrical properties in the weld region, so that the differences observed between KJ-15 and KJ-19 as well as KJ-41 and KJ-45 are predictable. 4 4 KJ-26 KJ-28 KJ-27 2 Load [kn] KJ-22 KJ-23 2 Load [kn] Failure modes KJ-25 BCW KJ-26 BCW KJ-27 BCW KJ-28 BCW -4 KJ-25 Displacement [mm] Failure modes KJ-22 BCW KJ-23 BCW -4 Displacement [mm] KJ-15 KJ-41 KJ-19 2 Load [kn] KJ-45 2 Load [kn] Failure modes KJ-15 EW KJ-19 EW Failure modes KJ-41 BB KJ-45 EW Displacement [mm] Displacement [mm] Figure Comparison of joints having same geometrical and material properties. -1 Failure Modes EW BCW BB brace effective width failure buckling of chord web failure local buckling of brace failure To gain information of the measurement errors produced by the measuring equipment, an independent measuring method was used. Calibrated callipers with heights of 1, 2, 3 and 4 mm were used to check the precision of the measurements. Additionally, the displacement transducers are labelled with numbers to ensure that every LVDT is used at the same measuring point for all tests. It can be seen from Figure A4-7 that only small deviations between the measured and the correct dimensions exist. Due to a linear dependency of the deviations to the measured lengths (correlation factor r = 1. for all transducers), these deviations do not have an influence on the relative deflections between 2 measuring points Annotation to some test results By the tests and the chemical analysis of the test specimens the following general observations could be made: The braces of test specimen KJ-15 are out of two different steel grades. The compression brace consist of steel grade S46, whereas the tension brace of steel grade S355. The same observation 18
109 was made for KJ-28 where the tension brace of steel grade S46 and the compression brace of S355. The test specimen KJ-45 possesses braces with two different wall thicknesses. For the compression brace a section with a thickness of 4 mm, for the tension brace one with 3 mm, was used. The chords of test KJ-44 and KJ-47 are composed of two pieces which are welded together with a angle of 45. The weld is arranged exactly in the middle of the gap. Both specimens failed by brittle fracture at the weld. 5.7 Calculation of welded connections between rectangular hollow sections according to pren The following modes of failure (Figure 5-13) could occur for welded connections between rectangular hollow sections. The modes of failure observed from the tests can be seen sin Figure Mode A Mode B Mode C Chord face plastification Mode D Chord punching shear failure Mode E Brace effective width failure Mode F Brace local buckling failure Chord shear failure Chord side wall yielding or buckling Figure Failure modes of hollow section joints. 19
.")
![In Table 5-7, the ultimate test loads, the failure modes observed and the design loads according to Eurocode 3 [5-1] calculated with measured values (in Table A3-1 calculated with nominal](/docs-images/71/65933332/images/110-1.jpg "values are presented).")
![Because buckling of the chord webs was observed as a failure mode and no rule to calculate design loads for chord web buckling exist, the design loads according to Eurocode 3 [5-1] for T- and](/docs-images/71/65933332/images/110-2.jpg "Y- Joints are used for the comparison. Furthermore punching shear had been determined using the following modified formula using a reduced effective length l e,p.")
![The design formulae given in pren1993-1-8 85-1[5-1] for K-joints can be found in Appendix 3, Table A3-3, the design formulae for buckling of the chord webs for T- and Y- joints used for the](/docs-images/71/65933332/images/110-3.jpg "evaluation is shown in Table A3-4. 5.7.")
110 Figure 5-14a. reduced punching shear failure (KJ-4). Figure 5-14b. reduced effective width failure (KJ-19). Figure 5-14c. Buckling of chord webs (KJ-25). Figure 5-14d. Buckling of compression brace (KJ-2). In Table 5-7, the ultimate test loads, the failure modes observed and the design loads according to Eurocode 3 [5-1] calculated with measured values (in Table A3-1 calculated with nominal values are presented). Because buckling of the chord webs was observed as a failure mode and no rule to calculate design loads for chord web buckling exist, the design loads according to Eurocode 3 [5-1] for T- and Y- Joints are used for the comparison. Furthermore punching shear had been determined using the following modified formula using a reduced effective length l e,p. The design formulae given in pren [5-1] for K-joints can be found in Appendix 3, Table A3-3, the design formulae for buckling of the chord webs for T- and Y- joints used for the evaluation is shown in Table A Modified analytical model for (reduced) punching shear failure Form the test results, it can be seen that the effective length for punching shear failure decreases with the gap size. Use of the formula in Eurocode 3 [5-1] overestimates the effective length and therefore the design loads. Therefore new models have to be developed for small gap sizes. Based on the observations during the tests, the following assumption for the reduced effective punching shear length l e.p.red can be made as a lower bound in case of small gap sizes: 11
111 l e,p,red b 1,2 r ( 2) a l e,p,red for b1,2 g b Figure 5-15 Reduced effective punching shear length for small gap sizes. This assumption considers the reduced effective length for small gaps, which is caused by the increased stiffness of the gap region and implies that the load is dissipated only by the transition radii and the width of the brace in the gap region. With this reduced effective length l e,p,red the design load for punching shear failure N 1,Rd,red PS can be determined to be: PS fy o N R.d t le.p.red t b1.2 r d.red 3 (5-4) 5.8 Comparison of test results with calculation results according to pren The calculated loads according to Eurocode 3 [6-1] based on nominal and measured dimensions and The calculated loads according to Eurocode 3 [5-1] based on measured dimensions and material properties can be found Table 5-7. Additionally the calculated chord side wall failure load using the formula for T- and Y-joints and the reduced punching shear load can be found in Table 5-7. Comparison of the ultimate loads obtained from the tests with calculations using measured values is given in Figure Furthermore the failure modes of the tests are given here. Loads N d,cf design resistance load for chord face failure, with measured dimensions N d,cs design resistance load for chord shear failure, with measured dimensions N d,ew design resistance load for effective width failure, with measured dimensions N d,ps design resistance load for punching shear failure assuming a reduced effective punching shear length for small gaps, with measured dimensions N d,bcw design resistance load for buckling of chord web failure calculated with formulae for T- and Y-joints, with measured dimensions N 1,Rd,nom governing value of design resistance from the above 5 values Failure Modes CF chord face failure CS chord shear failure EW brace effective width failure PS punching shear failure BCW buckling of chord web failure BB local buckling of brace failure 111
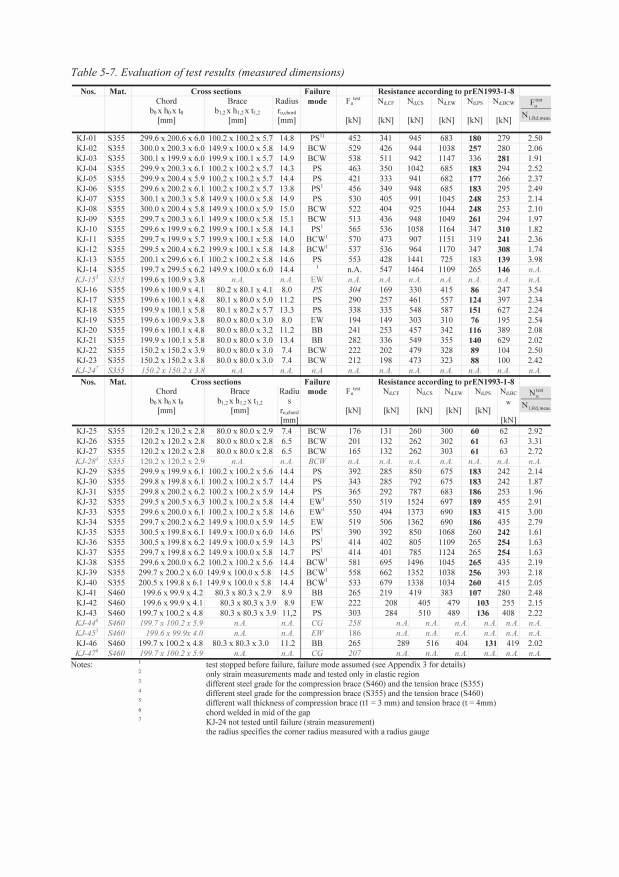
112 112
113 5 4 1 Reduced punching shear 2 Buckling of chord webs 3 Effective width 4 Buckling of brace measured values (without buckling of chord webs) measured values (with buckling of chord webs) F u test /N1.rd.meas Specimen No. 47 Figure Comparison of design resistance calculated with measured dimensions and material properties with and without considering buckling of the chord webs. The following observations can be made from Figure 5-15: Loads calculated with measured values using the formulae given in Eurocode 3 [5-1] and extended for buckling of chord webs (using the formulae for Y- and T-joints) and using a modified punching shear formula give margins of safety higher than 1.25 for all tests. For high width ratios ( =.5), buckling of the chord webs is the predominant failure mode (KJ- 3 and KJ-1 to KJ-12). For small gaps and middle to small width ratios ( =.33 and =,42) reduced punching shear failure is the predominant failure mode. Note that K-joint is given by = (b 1,2 +h 1,2 )/(2h ) so that for example rectangular hollow sections with b 1,2 = 2, h 1,2 = 1 mm (brace) and b = 3, h = 2 mm (chord) the value is.5, although b 1,2 /b =.75. Regarding the tests series with the same width ratios (KJ-1, KJ-4 to KJ-6 with =.33; KJ-2, KJ-7 to KJ-9 with =.42 and KJ-3, KJ-1 to KJ-12 with =.5) it can be seen that increasing width ratios give decreasing margins of safety whereas varying gap sizes do not significantly influence the margin of safety. Increasing brace inclinations and width ratios give decreasing margins of safety (KJ-29 to KJ-4 and KJ-1, KJ-2 and KJ-4 to KJ-9). From these tests it can also be seen that the gap size does not influence the margin of safety significantly. 5.9 Conclusions In the framework of this research project 47, tests on K-joints with gap and with slenderness as well as gap sizes outside the range given in Eurocode 3 [5-1] are carried out at the University of Karlsruhe. The ultimate load and the load deformation behaviour had been determined. The results given here are based on the test results only. To develop analytical models which predict the design loads of such joints more accurately than the existing ones, a numerical parameter study using Finite Element analysis needs to be carried out. For high slenderness 2 and high width ratios buckling of the chord webs could be observed from the tests in case of gap sizes permissible in Eurocode 3 [5-1]. Because this failure mode has not to be considered for K-joints, the formula for T- and Y-joints for chord web failure is used for the design load 113
114 prediction. For very small gap sizes, down to the minimum requirements for welding, either punching shear failure or brace effective width failure can be observed. For both failure modes, the influence of a reduced effective length could be observed in the tests. Another failure mode observed in the tests is the buckling of the compression brace, which appears if the width ratio < 1.. The following conclusions can therefore be drawn for K-joints with slender chord members (35 2 5) and gap sizes below the lower bound given in Eurocode 3 [5-1]: The design resistance for K-joints can be determined by using the formulae according to pren but the punching shear resistance should be calculated using a reduced effective length, if the gap size is below the lower bound given in Eurocode 3 [5-1]. This reduced effective punching shear length can be calculated using the proposal given in this report. Additionally, buckling of the chord webs should be checked. The formula for T- and Y-joints given in Eurocode 3 [5-1] can be used here. The thickness ratio should be restricted to = 1. for b /t > 35 and small gap sizes, in order to avoid brace failure. The existing models for brace failure (buckling of brace and effective width failure) should be modified to include the slenderness range and the reduced gap size. Only few reliable results of tests for steel grade S46 exist. Although all results obtained by the tests give margins of safety above 1.25, it is proposed to limit the slenderness and the gap size to the values given in Eurocode 3 [5-1] until additional investigations are available. To develop more precise proposals for chord web buckling failure (for example a reduction factor as given for X-joints already), reduced punching shear failure, reduced effective width failure and local buckling of the brace failure, additional FE analyses have to be carried out. 5.1 Numerical investigations In the framework of a dissertation, finite elements analysis based on the experimental investigations presented in this report, are carried out at Karlsruhe University. The results of this experimental work and the numerical investigations will be used to modify the existing design rules to include slender chord sections and small gap sizes. Some results are already published in [5-7]. 114
115 6 Effect of welding in cold formed areas 6.1 Introduction and aims In the following the main results, conclusions and design recommendations found in the scope of Working Package 4 (WP4) are presented. According to DIN 1714, Part 1, Edition 1988 (6-1), ageing is a change of the properties of a material at or close to room temperature by movement of interstitial dissolved elements. The literature distinguishes between natural ageing and artificial ageing (increased temperature and reduced influencing time). The ageing of unalloyed steel requires freely moveable nitrogen and carbon atoms in the crystal structure. Depending on how these atoms lose their mobility, the process is called quench-age hardening or strain ageing, respectively. In relation to welding in cold-formed areas, strain ageing is relevant. Essentially, the process of strain ageing is based on an influence of a larger number of displacements in the crystal structure caused by cold-forming. Nitrogen and carbon atoms are deposited with a time and temperature dependant diffusion into braced lattice regions, which can also be affected by the heat input during welding. If the concentration of nitrogen and carbon atoms is sufficient, these depositions cause a yield hindrance. This is called ageing and embrittlement of steel (see Ruge [6-2 and 6-3]). In addition to the preceding cold-forming, strain ageing causes an increase in the yield strength, tensile strength and hardness, together with a decrease of strain, the reduction of area and the Charpy V notch impact energy (Houdremont [6-4]). Through the addition of, for example, aluminium in steel manufacturing, Nitrogen can be converted to aluminium nitrate, whereby a far-reaching resistance to ageing of the steel can be achieved. In the last few decades such restrictions have been formulated not only in DIN standards and Eurocode 3, but also in AD Merkblätter (codes of practice for the fabrication and testing of pressure vessels), Technische Regeln Druckbehälter TRD (Technical rules for pressure vessels/ fabrication), VGB codes of practice for the fabrication and the supervision of high performance steam boilers, in the rules of the Germanischer Lloyd for shipbuilding/ -hull structures and in the code of practice for railway bridges and other building structures of the Deutsche Bahn AG (DS84). The comparison of these restrictions shows that for the same issue of dangerous strain ageing, the resulting restrictions are very different. So, for example in AD Merkblätter the main criterions are the cast analysis and the wall thickness. In dependence of both a heat treatment after welding has to be carried out. Regarding the regulations of the Deutsche Bahn AG (DS 84) the influence of fully killed steel is not taken into account and for wall thickness t > 8 mm a post weld heat treatment has to be carried out for the relevant cases. The same conditions are given in a National Application Document for steel bridges (DIN Fachbericht 13) based on Eurocode 3. Preferably, the sensitivity to ageing of steel is assessed by the Charpy V notch impact energy temperature curve. In the course of the present research programme, only the influence of strain ageing adjacent to the weld seam is to be investigated. Notch effects and geometrical influences such as single-layer welding are to be excluded or minimised in order to prevent any dominating influence of such conditions on the test process. A multi-layer weld would e.g. cause a normalising effect that would cover the ageing. On this basis, the bead-on-plate weld has been removed afterwards, so that only the influence of the thermal effect of the weld bead in the cold-formed area of the specimen the strain ageing caused by welding remains as an influencing parameter. The bead-on-plate weld is only regarded as an expedient for the generation of the ageing area typical for a weld seam. 115
116 The present research programme investigates the shift of the transition temperature caused by welding (ageing effects) using Charpy V notch test (CVN tests) and cold-formed structural hollow sections. For the hollow sections, the condition removed weld seam is mainly to be checked. A real weld would not lead to a stricter condition for the determination of the ageing effect. sampling layer in the bent area ground weld area bent area sampling layer in the bent area, artificially aged sampling layer in the flat area Figure 6-1. Positions of sampling layers. For the evaluation of brittle fracture, the notch was prepared in the zone reheated by welding (see Figure 6-1). It was to be investigated, whether this reheating (ageing) influences the brittle fracture temperature. An extensive material analysis was carried out, in which transition temperatures at 27 J of the following material conditions were to be determined: base material (sampling location in flat area) base material (sampling location in curved area) base material (sampling location in curved area, artificially aged) For each material condition, about 18 tests are carried out to obtain sufficient data for statistical analysis. Welding in cold-formed areas is not only an open question for statically loaded sections (brittle fracture) but also for dynamically loaded structures (fatigue resistance). Especially for structural joints made of hollow sections with large width-ratios b 1 /b, it is often necessary to weld in the areas close to the edges. A lot of these structures are subjected to dynamic loading. Because there is nearly no information given about the influence of the weld in cold-formed areas on the fatigue resistance of modern steels, welding in this areas is not acceptable. In the scope of this research project, the fatigue behaviour of welded (notched) and non-welded (unnotched) test specimens made of different steel grades and wall thicknesses are compared directly with each other to determine, whether a weld notch influences the fatigue behaviour in cold-formed regions of hollow sections and if so, to what extent. 116
117 It is important to point out that the intention of all tests was to find out, whether there is a difference in the fatigue behaviour of artificial aged specimens and non-aged specimens. It was not the intention to get an absolutely correct fatigue curve for square hollow sections under unusual loading conditions as they have been used during the tests. F, R=+,1 2 mm ground weld area 12 mm case a: case b: welded and grinded area in the bent region test specimen without notches Figure 6-2. Test set-up for 4-point-bending fatigue tests. The fatigue tests were carried out as 4-point-bending-tests, both on welded and un-welded specimens for comparison (see Figure 6-2). The weld seam was removed before the tests by grinding. For all the tests, CVN and fatigue tests, the specimens have been prepared from the same sections. Also, the weld notches were prepared and documented in the same manner. With this work, detailed fundamental information is made available about the basics of the material and the weld, as well as the fatigue behaviour of the cold-formed material investigated under notched and un-notched conditions. Finally, conclusions will be made on the influence of welding in the bent area of cold-formed hollow sections on fatigue behaviour. Detailed information about all results are given in Document 4341/WP4/46 Version 2: WP4 Welding Procedures Final Technical Report [6-5]. 6.2 Test specimens Hollow sections For the investigations, the following steel grades have been chosen: S275J2H as per EN 1219 (1997) (6-6) with the following restrictions: Content of Al.2 %, S.12 %, P.25 % S355J2H as per EN 1219 (1997) (6-6) with the following restrictions: Content of Al.2 %, S.8 %, P.25 % 117
118 S46MLH as per EN 1219 (1997) (6-6) with the following restrictions: Content of Al.2 %, S.8 %, P.25 % The wall thicknesses of the hollow sections investigated were: 5 mm, 8 mm, 1 mm, 12 mm and 12.5 mm. From the above mentioned 15 possible steel grade to wall thickness combinations, 3 material batches were investigated in the course of this research programme combined mainly with 5, 8 and 1 mm wall thickness. The test specimens chosen were cold-formed structural hollow sections (CFSHS). Depending on availability, the dimensions of the specimens tested had two different sizes (1 x 1, 15 x 15). The main interest concentrates on dimension 1 x 1 mm with different wall thickness as given in Table 6-1. Table 6-1. Dimensions of test specimens. b x h x t [mm] b x h x t [mm] 1 x 1 x 5 15 x 15 x 5 1 x 1 x 8 15 x 15 x 8 1 x 1 x 1 15 x 15 x 1-15 x 15 x 12.5 For comparison, some reference tests with stress relieved sections have been carried out also. The geometrical data for all specimens have been measured. In detail, the height h, the width b, and at the four corners the wall thickness t as well as the inner and outer corner radii have been recorded. In addition, using the mean values of the measured dimensions, the non-dimensional parameters 2 = b/t, r o /t m and r i /t m have been determined Mechanical-technological data For all sections delivered the main geometrical data have been measured. In detail, the following sizes have been determined: width b, height h, wall thickness t at all four sides of the sections, inner corner radii r i at all corners and outer corner radii r o at all corners. Based on the means of the measured dimensions (denoted by index m) the main geometrical parameters were calculated, which are 2 = b m /t m, outer corner radii related to wall thickness r o,m /t m and inner corner radii related to wall thickness r i,m /t m. All results are presented in Table 6-2. In addition to that, the minimum ratios r/t according pren , Table 4.2 (6-7), are given. In some cases the measured ratio r i,m /t m ranges outside the minimum range. Those sections are highlighted in this table. The determination of the mechanical-technological data has been carried out by the producers within the scope of the usual quality control. In addition to that, the contraction at fracture Z was determined at Karlsruhe University for three different profiles and wall thicknesses. The results for the flat areas, the corner areas without ageing and the corner areas with ageing are given together with all the other data in the Final Technical Report to WP4 [6-1]. 118
119 Table 6-2. Geometrical data of the sections investigated. specimen b m t m r o,m r i,m [mm] [mm] [mm] [mm] 2 r o,m /t m r i,m /t m min. r/t A ,95 5,3 12, 8, 29,8 2,38 1,59 1, A221 15,47 7,97 21, 13,38 18,89 2,64 1,68 1,5 A241 15,53 12,68 37,75 25, 11,87 2,98 1,97 3, A12 1,64 5,2 12, 7,5 2,5 2,39 1,49 1, A22 1,45 8,9 21,88 12,63 12,42 2,71 1,56 1,5 A32 99,79 1,12 32,5 23, 9,86 3,21 2,27 2, B ,88 4,72 11,13 6,38 31,75 2,36 1,35 1, B121 15,4 7,7 2,88 12, 19,5 2,71 1,56 1,5 B ,85 4,75 11, 6,25 31,55 2,32 1,32 1, B ,94 7,76 19,88 11,88 19,32 2,56 1,53 1,5 B261 15,12 9,91 25,5 14,88 15,15 2,57 1,5 1,5 B311 15,1 4,85 1, 6,13 3,96 2,6 1,26 1, B321 15,48 7,83 19,75 12,63 19,23 2,52 1,61 1,5 B11 99,94 4,61 1, 5, 21,7 2,17 1,9 1, B12 99,95 4,64 11, 6,25 21,56 2,37 1,35 1, B13 99,94 4,82 1,63 4,88 2,75 2,21 1,1 1, B21 99,82 7,65 2, 11,75 13,6 2,62 1,54 1,5 B22 99,95 7,73 22, 1, 12,93 2,85 1,29 1,5 B23 1,7 7,81 18, 12, 12,82 2,31 1,54 1,5 B32 1,39 9,93 24,63 12, 1,11 2,48 1,21 1,5 D ,1 4,93 9,75 5,25 3,65 1,98 1,7 1, D211N 15,77 4,88 9,88 5, 3,93 2,3 1,3 1, D212 15,52 4,98 9,63 7, 3,24 1,93 1,41 1, D221 15,78 8,5 18, 1,88 18,72 2,24 1,35 1,5 D221N 15,59 7,97 18,25 1, 18,91 2,29 1,26 1,5 D222 15,18 8,6 19,63 1,13 18,64 2,44 1,26 1,5 D ,97 12,14 29, 15,5 12,36 2,39 1,28 3, D232 15,21 12,27 29,25 15,38 12,24 2,38 1,25 3, Chemical analysis A complete chemical analysis of the following elements has been carried out and recorded: Carbon, Manganese, Silicium, Sulphur, Phosphorous, Aluminium, Nickel, Vanadium, Titanium, Niobium, Boron, Copper, Chromium, Molybdenium, Tungsten, Cobalt and Nitrogen Welding For all test specimens the MAG weld procedure was chosen. The gas applied was Argon with 18% carbon dioxide as shielding gas (M21 according to EN 44 (6-8)). As electrodes, both Thyssen UNION K56 (G4Si1 according to EN 44 (6-8)) and Griduct S-V 4 (G3Si1 according to EN 44) have been used. Both wire electrodes match the corresponding steel grades. The yield strength of the weld metal corresponds approximately with the yield strength of the base material. The welding was carried out as bead-to-plate weld over the bent corner, perpendicular to the longitudinal direction, without preparing a groove. The heat input was as high as possible (about 1 kj/cm) to cause ageing effects. Welding specifications for all test specimens prepared are given in Table 6-3 and in Table
120 Table 6-3. Welding procedures for sizes 1 x 1 x t. test series dimensions [mm] steel grade welding current [A] welding voltage [V] welding rod feed rate [m/min] welding speed [cm/min] wire diameter [mm] B11 N 1x1x5 S B21 N 1x1x8 S B12 N 1x1x5 S B22 N 1x1x8 S B32 N 1x1x1 S B13 N 1x1x5 S B23 N 1x1x8 S A12 N 1x1x5 S A22 N 1x1x8 S A32 N 1x1x1 S gas: Argon with 18% CO 2 (M21) wire: Thyssen UNION K56, G4Si1 (acc. EN 44) Table 6-4. Welding procedures for sizes 15 x 15 x t. test series dimensions [mm] steel grade welding current [A] welding voltage [V] welding rod feed rate [m/min ] welding speed [cm/min] wire diamete r [mm] D211 N 15x15x5 S , D221 N 15x15x8 S , B111 N 15x15x8 S , B121 N 15x15x8 S , A211 N 15x15x5 S , B211 N 15x15x5 S , A221 N 15x15x8 S , B221 N 15x15x8 S , A241 N 15x15x12.5 S , B261 N 15x15x1 S , B311 N 15x15x5 S , B321 N 15x15x8 S , D212 N 15x15x5 S , D222 N 15x15x8 S , D231 N 15x15x12 S , D232 N 15x15x12 S , gas: Argon with 18% CO 2 (M21) wire: Griduct S-V 4, G3Si1 (acc. EN 44) 12
. Figure 6-4.")

![The single steps of the preparation of the micro sections, the positions of the micro sections and the designation are given in the Final Technical Report to WP4 [6-1].](/docs-images/71/65933332/images/121-2.jpg "In total, 8 specimens have been prepared and etched.")
121 To differentiate between un-notched and welded (notched) specimens, an additional N was added to the designation numbers of the notched specimens. Examples for macro sections are shown in Figures 6-3 to 6-5. As the macro sections show, the heat affected zone is very small for the planned CVN tests. Figure 6-3. SHS 15x15x5 (t=5 mm). Figure 6-4. SHS 15x15x8 (t=8 mm). Figure 6-5. SHS 15x15x12 (t=12 mm) Metallography To localise the heat affected zone (HAZ), macro sections in the welded corners were made for all specimens prepared for the impact tests. To get more information of the condition of the corner area, micro sections have been prepared of cracked specimens after the fatigue tests as well as of un-tested specimens. The single steps of the preparation of the micro sections, the positions of the micro sections and the designation are given in the Final Technical Report to WP4 [6-1]. In total, 8 specimens have been prepared and etched. In detail, micro sections of all specimens listed in Table 6-5 have been made at the outer corner radii as well as at the inner corner radii to find out whether there are special crack initial points at the corners. As in chapter 6.5 will be described no indication for typical crack initial points was found. 121

122 Table 6-5. List of micro sections prepared. specimen size steel grade fatigue test D211N-8 15 x 15 x 5 S355J2H tested D x 15 x 5 S355J2H tested B x 15 x 5 S355J2H tested B x 15 x 5 S355J2H tested A x 15 x 5 S355J2H un-tested B x 15 x 5 S275J2H un-tested D x 15 x 5 S355J2H un-tested B23 15 x 15 x 8 S46MLH un-tested 6.3 Charpy V notch impact (CVN) tests In agreement with project partners, the work was concentrated on the most common profile sizes, which means profiles with wall thickness of 8 and 1 mm. This also includes different grades of transformation. According to Table 6-2 the ratio for the outer radius r o,m /t m ranges between 2.6 (specimen B311) and 3.21 (specimen A32). The ratio for the inner radius r i,m /t m ranges between 1.21 (specimen B32) and 2.27 (specimen A32). The steel grades of the selected specimens were S355J2H and S46MLH. For positioning the notch exactly in the HAZ macro sections of all specimens have been prepared. In Figure 6-6 the exact position of the notch is shown. The base of the notch is crossing the end of the HAZ in the middle of the test specimens. This position was chosen in accordance with wide experiences with specimens taken from un-bent areas. top view side view Figure 6-6. Position of the notch crossing the HAZ in the middle of the specimen. The steps of preparing the Charpy V test specimens are well documented. Big care was taken to eliminate mix-ups. The specimens have been marked with numbers, different colours and were also sorted into different baskets. Table 6-6 gives an overview, which profiles were prepared for the CVN tests. 122
123 Table 6-6. CVN tested specimens. specimen size steel grade A22 1 x 1 x 8 S355J2H B23 1 x 1 x 8 S46MLH A32 1 x 1 x 1 S355J2H B32 1 x 1 x 1 S355J2H A x 15 x 8 S355J2H B x 15 x 8 S275J2H B x 15 x 1 S355J2H B x 15 x 8 S46MLH According to Figure 6-1 and to EN 145 [6-9] the specimens were worked out of the plane areas, the bent areas and the bent aged areas of the hollow sections. The test specimens from the bent areas are taken as near as possible to the surface: Notch position S (normal to the surface). In total, about 4 CVN tests have been carried out for eight specimens to have a sufficient statistical reliability. The range of temperature was between room temperature and 8 C, depending on the results found. Using the test results from CVN tests, the temperature transition curves are drawn up for the Charpy V notch impact energy. Charpy-V-tests Dimensions profile S355J2H b x h x t [mm] 1x1x1 l A32 Dimensions specimen l x b x h [mm] h 55x1x8 b Results related to notch area A = 1. cm 2 Plane area 1 Bent area 2 Bent area aged 3 Test No. Temp. [ C] KV [J] Test No. Temp. [ C] KV [J] Test No. Temp. [ C] KV [J] KV [J] Temp.[ C] KV [J] Temp.[ C] KV [J] Temp.[ C] Figure 6-7. CVN tests data sheet. 123
124 All data are given in data sheets on which the numerical and graphical results for each section can be compared directly to each other (see Figure 6-7). For this reason all results have been related to a notch area of A = 1. cm². Also, the results for the tests of specimens prepared of the plane area, the bent area and the bent and aged area are listed in parallel on the same page. For each position the 27 J transition curve is plotted. The results can be summarised as follows: Plane area The notch impact energy KV in the upper shelf is higher than 18 J 2 J for all cases. The highest transition temperature where the material changes from ductile to brittle fracture ranges between 3 C and 4 C, in two cases no transition could be found in the investigated temperature range down to 8 C. Bent area Compared to the behaviour of the specimens prepared out of the plane area, only minor differences can be found. Generally, the same transition curves for both specimens were found. Bent area aged Compared to the both cases above the behaviour of the specimens made out of the bent aged area is a little bit different. The notch impact energy KV in the upper shelf is higher than 2 J/cm² for all cases. In six of eight cases no decrease of the notch impact energy KV was found. The temperature ranges between room temperature and 8 C. In one case (specimen A32) the 27 J transition temperature was found between 7 C and 8 C. In another case (specimen B261) the transition between upper and lower shelf ranges between C and 4 C. Regarding all tests carried out, the minimum for the lower shelf was found at 6 C with 26,7 J/cm². For all other cases, a similar or better ductile behaviour was found than for the plane or for the bent area without ageing. It is assumed that the welding in the bent area causes some kind of normalising effect. Comparing both steel grades (S355J3H and S46MLH) no remarkable differences concerning the notch impact energy have been found. Influence of HAZ As in Figure 6-6 clearly can be seen all notches have been positioned in a manner that the notch is located exactly at the toe of the weld and the beginning of the heat affected zone (HAZ). Later on and due to the results of the Charpy V tests the influence of the position of the notch and with this the influence of the HAZ was investigated. For two specimens, B261 (t = 1 mm, S355J2H) and B321 (t = 8 mm, S46MLH), the distance of the notches from the toe of the weld was varied between 1 and 5 mm. For specimen B261 the temperature for all tests was kept constant at 2 C. The reason for choosing this temperature was, that at this temperature a change in the notch impact energy was found in the previous tests. For specimen B321 the testing temperature was kept constant at 5 C. As the transition curves show, a wide scatter of the notch impact energy can be found nearby the toe of the weld. Compared with the results given in the data sheets for specimen B261 and specimen B321 a reasonable agreement with the results given there for a distance d = 1 mm was found. In this distance (d = 1 mm) the notches of all specimens tested before have been positioned. Comparing the results in a distance d = 4 mm to the toe of the weld, the impression can be received that the notch impact energy is lower than in the tests done before at the same temperature. Table 6-7 summarises this effect. With consideration of the wide scatter found in the transition of the HAZ to the un-notched area these results prove that the position of the notches as shown in Figure 6-6 was alright. 124
125 Table 6-7. Comparison of notch impact energy in different distances d from the weld toe. specimen size Steel grade mean KV [J] mean KV [J] at d = 1 mm at d = 4 mm B x 15 x 1 S355J2H B x 15 x 8 S46MLH Comparison with results found by others In a recent publication by Packer (6-1) the measured Charpy V notch toughness for cold-formed hollow sections produced in different parts of the world is compared. The specimens have been prepared from the flat areas as well as from the exterior and interior corners. The influence of welding was not considered in this paper. The hollow sections tested have been produced by companies from North America, South America, Japan and Europe. The cold-formed sections coming from Europe had been delivered by the same producers as the sections investigated in the scope of this programme. In addition to that, hot-rolled sections have been tested for reference. The highest Charpy V notch toughness was found for the hot-rolled specimens, as it was expected. The results for the cold-formed sections are comparable to the results for non-aged specimens found in this project. Whereas the Charpy V transition curves found for profiles made for example in North America are not meeting the requirements for steel products in Europe. Thus, the consideration of the influence of welding in cold-formed areas is lapsed for these sections. The main reasons for the differences in the Charpy V notch toughness for sections investigated in the present ECSC project and other sections made in Europe and in other parts of the world are mainly seen in the differences of the chemical compositions of the steels. 6.4 Fatigue tests The evaluation is done using the nominal stress (Woehler) method. For each test series, a minimum of 3 fatigue tests was carried out, normally 6 tests have been performed. The statistical evaluation is done according to EN using computer software developed for this purpose at University of Karlsruhe. The probability of survival is taken into account with 95 % at a confidence level of 75 %. For comparison, notched and un-notched hollow sections made of the same charge have been investigated and compared with each other. As for the CVN tests, all artificially aged (welded) specimens have been prepared without grooves. Finally, a total of 171 specimen have been investigated, using three machines in parallel (see Figure 6-8 and Figure 6-9). Fatigue curves have been prepared for all series with sufficient results. The detailed results of all tests are given in data sheets, one sheet per series. In these data sheets, basic information about the test series is given, such as nominal dimensions, steel grades and welding procedure specifications (WPS) according to Table 6-3 and Table 6-4. Also, the results of the fatigue tests are listed in a table on this data sheet, where stress range S R, stress ratio R, numbers of failure N f, failure mode (see Figure 6-1), as well as remarks (if any) are given. The S R -N f diagram (Woehler diagram) is presented on the lower half of this data sheet. As far as available and in the scope of Working Package 1.1 [6-12], R p.2 for the flat and for the corner area of the sections are given. All data sheets are given in Appendix 5 of the Final Technical Report to WP4 [6-1]. 125


126 Figure 6-8. On the left: Test specimen during a test in the 2 kn Schenk machine. On the right: Test specimen during a test in the 2 kn Losenhausen machine. Figure 6-9. Test specimen ready for testing in the 6 kn Schenk machine. The results of the fatigue tests show different types and locations of failure, which are schematically described in Figure 6-1. Due to the ovalization effects of the hollow sections under bending and as the FE investigations have shown, the stress levels in areas H1 and H2 are nearly the same for un-notched and for artificially aged specimens (see Document 4341/WP4/45 [6-11]). This explains the different locations of the cracks. 126
BS EN Hollow bars for machining Technical delivery conditions Non alloy and alloy steels
 BS EN 10294 1. Hollow bars for machining Technical delivery conditions Non alloy and alloy steels 1 Scope This part of EN 10294 specifies the technical delivery conditions for seamless steel hollow bars
Experiments on Stainless Steel Hollow Sections Part 2: Member Behaviour of Columns and Beams
 Gardner, L. and Nethercot, D. A. (2004). Experiments on stainless steel hollow sections Part 2: Member behaviour of columns and beams. Journal of Constructional Steel Research. 60(9), 1319-1332. Experiments
DNVGL-CP-0347 Edition May 2016
 CLASS PROGRAMME Approval of manufacturers DNVGL-CP-0347 Edition May 2016 The content of this service document is the subject of intellectual property rights reserved by ("DNV GL"). The user accepts that
PLASTIC DESIGN OF STAINLESS STEEL STRUCTURES
 SDSS Rio 2010 STABILITY AND DUCTILITY OF STEEL STRUCTURES E. Batista, P. Vellasco, L. de Lima (Eds.) Rio de Janeiro, Brazil, September 8-10, 2010 PLASTIC DESIGN OF STAINLESS STEEL STRUCTURES Marios Theofanous*
BUREAU OF INDIAN STANDARDS Draft Indian Standard
 For Comments Only BUREAU OF INDIAN STANDARDS Draft Indian Standard STEEL PLATES FOR PRESSURE VESSEL FOR INTERMEDIATE AND HIGH TEMPERATURE SERVICE INCLUDING BOILERS (Third Revision of IS 2002) ICS 77.140.30
Weldable fine-grained structural steel, thermomechanically rolled
 355 Weldable fine-grained structural steel, thermomechanically rolled Material data sheet, edition April 2016 1 DI-MC 355 is a thermomechanically rolled, fine-grained structural steel with minimum yield
DIN EN : (E)
") DIN EN 1999-1-1:2014-03 (E) Eurocode 9: Design of aluminium structures - Part 1-1: General structural rules Contents Page Foreword to EN 1999-1-1:2007... 7!Foreword to EN 1999-1-1:2007/A1:2009... 7 #Foreword
DIN EN 1999-1-1:2014-03 (E) Eurocode 9: Design of aluminium structures - Part 1-1: General structural rules Contents Page Foreword to EN 1999-1-1:2007... 7!Foreword to EN 1999-1-1:2007/A1:2009... 7 #Foreword
BS EN :2004 EN :2004 (E)
") Contents List 1. General 1.1 Scope 1.1.1 Scope of Eurocode 2 1.1.2 Scope of Part 1-1 of Eurocode 2 1.2 Normative references 1.2.1 General reference standards 1.2.2 Other reference standards 1.3 Assumptions
Contents List 1. General 1.1 Scope 1.1.1 Scope of Eurocode 2 1.1.2 Scope of Part 1-1 of Eurocode 2 1.2 Normative references 1.2.1 General reference standards 1.2.2 Other reference standards 1.3 Assumptions
Weldable fine-grained structural steel, thermomechanically rolled
 460 Weldable fine-grained structural steel, thermomechanically rolled Material data sheet, edition April 2016 1 DI-MC 460 is a thermomechanically rolled, fine-grained structural steel with minimum yield
(a) Pin-Pin P cr = (b) Fixed-Fixed P cr = (d) Fixed-Pin P cr =
 Pin-Pin P cr = (b) Fixed-Fixed P cr = (d) Fixed-Pin P cr =") 1. The most critical consideration in the design of rolled steel columns carrying axial loads is the (a) Percent elongation at yield and the net cross-sectional area (b) Critical bending strength and axial
1. The most critical consideration in the design of rolled steel columns carrying axial loads is the (a) Percent elongation at yield and the net cross-sectional area (b) Critical bending strength and axial
Properties of Reinforcing Steels
 Properties of Reinforcing Steels 1.0 Introduction Part 2 of this Guide describes the most common process routes for the manufacture of reinforcing steels in use in the UK. This part now considers the various
under Buckling Behavior
 EXPERIMENTAL STUDY ON HOT ROLLED SQUARE HOLLOW SECTIONS UNDER BUCKLING Experimental Study on Hot Rolled Square Hollow Sections BEHAVIOUR Karthick raja.s a, Sundararooban.S.R b, Rangaraj.S c a,b,c - Final
High strength fine grained structural steel. Quenched and tempered. Product description. 890 a product brand of Dillinger 1/6
 890 High strength fine grained structural steel Quenched and tempered Material data sheet, edition April 2016 1 DILLIMAX 890 is a high strength quenched and tempered, fine grained structural steel with
High strength fine grained structural steel. Quenched and tempered. Product description. 965 a product brand of Dillinger 1/6
 965 High strength fine grained structural steel Quenched and tempered Material data sheet, edition April 2016 1 DILLIMAX 965 is a high strength quenched and tempered, fine grained structural steel with
Steel. Relia Quality Wear Resistant Plates PROPERTIES
 is a range of high hardness, conventional low-alloyed martensitic steels, which obtain their hardness through intense water quenching during plate manufacturing. steel plates offer outstanding resistance
Weldable fine grained structural steel, thermomechanically rolled
 460 Weldable fine grained structural steel, thermomechanically rolled Material data sheet, edition September 2018 1 DI-MC 460 is a thermomechanically rolled, fine grained structural steel with minimum
RELIABLE STEEL DISTRIBUTORS
 . BS EN 10025 3 Hot rolled products of structural steels Technical delivery conditions for normalized/normalized rolled weldable fine grain structural steels 1 Scope Part 3 of this document, in addition
TMK HYDRA ART INSIDE SKIVED AND ROLLER BURNISHED COLD FINISHED SEAMLESS STEEL TUBES and PISTON RODS TUBES FOR HYDRAULIC CYLINDERS
 TMK HYDRA ART INSIDE SKIVED AND ROLLER BURNISHED COLD FINISHED SEAMLESS STEEL TUBES and PISTON RODS TUBES FOR HYDRAULIC CYLINDERS TMK is one of the world s leading producers of tubular products for the
Materials & Processes in Manufacturing
 Materials & Processes in Manufacturing ME 151 Chapter 18 Hot Working Processes 1 Introduction Forming of materials their recrystallization temperature Higher temperatures weaken the metal making it more
Simple Complex Simple Complex
 Section 2.6 of the book. Other international standards for cold-formed steel structures which are in limit states format are the British Standard (Ref. 1.18), the Chinese Standard (Ref. 1.19) and the Eurocode
EAM :2003/05 Revision 01 21/10/2016
 European Approval for Materials Data Sheet EAM-0879-04 This data sheet has been raised in accordance with the requirements of Article 15 of the Pressure Equipment Directive 2014/68/EU. The material described
The right choice of steel according to the Eurocode
 The right choice of steel according to the Eurocode Oliver Hechler 1, Georges Axmann & Boris Donnay 2 Keywords: steel, production, steel grade, material properties, ductility, toughness, weldability. Abstract:
PORTAL FRAMES 1.0 INTRODUCTION
 36 PORTAL FRAMES 1.0 INTRODUCTION The basic structural form of portal frames was developed during the Second World War, driven by the need to achieve the low - cost building envelope. Now they are the
COLUMNS 1- Definition: The Egyptian code defines columns as : 2- Types of concrete columns
 COLUMNS 1- Definition: Columns are vertical compression members which carry primarily axial compression load; the axial load may be associated with bending moments in one or two directions, as shown in
CIRCULAR TUBE COLUMNS IN HIGH STRENGTH STEEL Economical solutions for building frames
 EUROSTEEL 014, September 10-1, 014, Naples, Italy CIRCULAR TUBE COLUMNS IN HIGH STRENGTH STEEL Economical solutions for building frames Van-Long Hoang a, Jean-Pierre Jaspart a, Jean-François Demonceau
Seismic performance of New Steel Concrete Composite Beam-Columns
 Seismic performance of New Steel Concrete Composite Beam-Columns Toshiaki FUJIMOTO, Hiroshi KOMATSU, Tomoyuki SAKURADA & Noritaka MOROHASHI College of Industrial Technology, Nihon University, Japan SUMMARY:
Chapter 2 The Structural Hot-Spot Stress Approach to Fatigue Analysis
 Chapter 2 The Structural Hot-Spot Stress Approach to Fatigue Analysis 2.1 Field of Application The structural hot-spot stress approach applies to welded joints for which: the fluctuating principal stress
Relia. Industeel. Relia : Quality Wear Resistant Plates PROPERTIES STANDARDS TECHNICAL CHARACTERISTICS
 Industeel Relia Relia: Quality Wear Resistant Plates Relia is a range of high hardness, conventional low-alloyed martensitic steels, which obtain their hardness through intense water quenching during plate
Mechanical behavior of crystalline materials- Comprehensive Behaviour
 Mechanical behavior of crystalline materials- Comprehensive Behaviour In the previous lecture we have considered the behavior of engineering materials under uniaxial tensile loading. In this lecture we
Rolling processes. Fig. (5-1)
") Page1 Rolling processes 5-1 introduction: Rolling is the process of reducing the thickness or changing the cross section of a long workpiece by compressive forces applied through a set of rolls, as shown
Page1 Rolling processes 5-1 introduction: Rolling is the process of reducing the thickness or changing the cross section of a long workpiece by compressive forces applied through a set of rolls, as shown
UHS Ultra High-strength Seamless, Hot Rolled Hollow Sections from ISMT
 UHS Ultra High-strength Seamless, Hot Rolled Hollow Sections from ISMT UHS Ultra High strength, Seamless, Hot Rolled Hollow Sections from ISMT (conforming to EN 10210) Widen your possibilities Modern architectural
BS EN Welded steel tubes for pressure purposes Technical delivery conditions Non alloy steel tubes with specified room temperature properties
 BS EN 10217 1. Welded steel tubes for pressure purposes Technical delivery conditions Non alloy steel tubes with specified room temperature properties 1 SCOPE This Part of EN 10217 specifies the technical
TABLE OF CONTENTS FINITE ELEMENT MODELING OF CONCRETE FILLED DOUBLE SKIN
 TABLE OF CONTENTS SECTION 1 INTRODUCTION... 1 1.1 Introduction... 1 1.2 Objectives and Scope of Work... 2 1.2.1 Experimental Phase... 2 1.2.2 Analytical Phase... 3 1.3 Outline of the Report... 4 SECTION
MACHINES DESIGN SSC-JE STAFF SELECTION COMMISSION MECHANICAL ENGINEERING STUDY MATERIAL MACHINES DESIGN
 1 SSC-JE STAFF SELECTION COMMISSION MECHANICAL ENGINEERING STUDY MATERIAL C O N T E N T 2 1. MACHINE DESIGN 03-21 2. FLEXIBLE MECHANICAL ELEMENTS. 22-34 3. JOURNAL BEARINGS... 35-65 4. CLUTCH AND BRAKES.
HOT ROLLED STEEL FLAT PRODUCTS FOR STRUCTURAL FORMING AND FLANGING PURPOSES SPECIFICATION (Third Revision of IS 5986)
") For Comments Only Draft Indian Standard Doc: MTD 4(4939) HOT ROLLED STEEL FLAT PRODUCTS FOR STRUCTURAL FORMING AND FLANGING PURPOSES SPECIFICATION (Third Revision of IS 5986) ICS 77.140.50 Not to be reproduced
For Comments Only Draft Indian Standard Doc: MTD 4(4939) HOT ROLLED STEEL FLAT PRODUCTS FOR STRUCTURAL FORMING AND FLANGING PURPOSES SPECIFICATION (Third Revision of IS 5986) ICS 77.140.50 Not to be reproduced
The designs, depending upon the methods used, may be classified as follows:
 Definition Machine Design is the creation of new and better machines and improving the existing ones. A new or better machine is one which is more economical in the overall cost of production and operation.
10-COLUMNS: 10.1 Introduction.
 1 10-COLUMNS: 10.1 Introduction. Columns are vertical compression members of a structural frame intended to support the loadcarrying beams. They transmit loads from the upper floors to the lower levels
ME 207 Material Science I
 ME 207 Material Science I Chapter 4 Properties in Bending and Shear Dr. İbrahim H. Yılmaz http://web.adanabtu.edu.tr/iyilmaz Automotive Engineering Adana Science and Technology University Introduction
7. SPECIFIC RULES FOR STEEL CONCRETE COMPOSITE BUILDINGS
 Page 130 7. SPECIFIC RULES FOR STEEL CONCRETE COMPOSITE BUILDINGS 7.1 General 7.1.1 Scope (1) P For the design of composite steel concrete buildings, Eurocode 4 applies. The following rules are additional
ME 4563 ME 4563 ME Introduction to Manufacturing Processes. College of Engineering Arkansas State University.
 Introduction to Manufacturing Processes College of Engineering Arkansas State University 1 Bulk Deformation 2 1 Rolling 3 What is Rolling? A process of reducing the thickness (or changing the cross-section
IMPACT. Chemical composition For the chemical composition of the ladle analysis the following limits are applicable (in %):
:") IMPACT Wear resistant steel Material data sheet, edition April 2016 1 DILLIDUR IMPACT is a wear resistant steel with a nominal hardness of 340 HBW in delivery condition. DILLIDUR IMPACT is not a constructional
IMPACT Wear resistant steel Material data sheet, edition April 2016 1 DILLIDUR IMPACT is a wear resistant steel with a nominal hardness of 340 HBW in delivery condition. DILLIDUR IMPACT is not a constructional
Experimental and numerical validation of the technical solution of a brace with pinned connections for seismic-resistant multi-story structures
 Experimental and numerical validation of the technical solution of a brace with pinned connections for seismic-resistant multi-story structures Ramona Gabor, Cristian Vulcu, Aurel Stratan, Dan Dubina Politehnica
Cyclic testing and numerical modelling of carbon steel and stainless steel tubular bracing members
 Revised Manuscript Click here to view linked References Cyclic testing and numerical modelling of carbon steel and stainless steel tubular bracing members K.H. Nip, L. Gardner and A.Y. Elghazouli Imperial
3. MECHANICAL PROPERTIES OF STRUCTURAL MATERIALS
 3. MECHANICAL PROPERTIES OF STRUCTURAL MATERIALS Igor Kokcharov 3.1 TENSION TEST The tension test is the most widely used mechanical test. Principal mechanical properties are obtained from the test. There
BEHAVIOUR OF COLD-FORMED Z-SHAPED STEEL PURLIN IN FIRE
 BEHAVIOUR OF COLD-FORMED Z-SHAPED STEEL PURLIN IN FIRE ABSTRACT Wei Lu *, Pentti Mäkeläinen *, Jyri Outinen ** * Department of Civil and Structural Engineering Aalto University, Espoo, Finland Wei.Lu@tkk.fi,
Content. perform. Brief profile. Product information for high-strength thermomechanically hot-rolled strip and cut-to-length plate
 Steel perform Product information for high-strength thermomechanically hot-rolled strip and cut-to-length plate Issue: January 22, 2019, version 0 / WB 660 Brief profile Outstanding surface quality Bending
EAM :2003/05 Revision 01 21/10/2016
 European Approval for Materials Data Sheet EAM-0879-03 This data sheet has been raised in accordance with the requirements of Article 15 of the Pressure Equipment Directive 2014/68/EU. The material described
30ChGSA Included in 13 standards (CIS Countries)
") Standards GOST 10702-78 GOST 11268-76 GOST 12132-66 GOST 21729-76 GOST 23270-89 GOST 4543-71 GOST 8731-74 GOST 8733-87 GOST R 54159-10 TU 14-1-1213-75 TU 14-1-1409-75 TU 14-1-4118-76 TU 14-4-385-73 Steel
Standards GOST 10702-78 GOST 11268-76 GOST 12132-66 GOST 21729-76 GOST 23270-89 GOST 4543-71 GOST 8731-74 GOST 8733-87 GOST R 54159-10 TU 14-1-1213-75 TU 14-1-1409-75 TU 14-1-4118-76 TU 14-4-385-73 Steel
THE MECHANICAL PROPERTIES OF STAINLESS STEEL
 THE MECHANICAL PROPERTIES OF STAINLESS STEEL Stainless steel is primarily utilised on account of its corrosion resistance. However, the scope of excellent mechanical properties the within the family of
Chemical composition For the ladle analysis, the following limiting values in % are applicable: C Si Mn P S
 500 Wear resistant steel Material data sheet, edition April 2016 1 DILLIDUR 500 is a wear resistant steel with a nominal hardness of 500 HBW in delivery condition ex works. DILLIDUR 500 is preferentially
BUCKLING OF STEEL AND COMPOSITE STEEL AND CONCRETE COLUMNS IN CASE OF FIRE
 SDSS Rio 2010 STABILITY AND DUCTILITY OF STEEL STRUCTURES E. Batista, P. Vellasco, L. de Lima (Eds.) Rio de Janeiro, Brazil, September 8-10, 2010 BUCKLING OF STEEL AND COMPOSITE STEEL AND CONCRETE COLUMNS
CHAPTER 4 PUNCHING SHEAR BEHAVIOUR OF RECYCLED AGGREGATE CONCRETE TWO WAY SLABS
 103 CHAPTER 4 4.1 GENERAL PUNCHING SHEAR BEHAVIOUR OF RECYCLED AGGREGATE CONCRETE TWO WAY SLABS The problem of punching shear in reinforced concrete slabs under a concentrated load or around a column has
Recommendations for additional fire protection of structural elements
 ANNEX 6 Recommendations for additional fire protection of structural elements 1 Scope This Annex contains a series of recommendations applicable to structural concrete structures which, for general fire
Module 3 Selection of Manufacturing Processes. IIT Bombay
 Module 3 Selection of Manufacturing Processes Lecture 3 Design for Bulk Deformation Processes Instructional objectives By the end of this lecture, the students are expected to learn the working principle
True Stress and True Strain
 True Stress and True Strain For engineering stress ( ) and engineering strain ( ), the original (gauge) dimensions of specimen are employed. However, length and cross-sectional area change in plastic region.
BEAMS, PURLINS AND BRACING. 5.1 General The design of beams for strength is usually governed by one of the following limit states:
 CHAPTER 5 BEAMS, PURLINS AND BRACING 5.1 General The design of beams for strength is usuall governed b one of the following limit states: (a) (b) (c) (d) (e) ielding of the most heavil loaded cross section
CARBON STEEL BARS HOT ROLLED
 CARBON STEEL BARS HOT ROLLED Grade Description...3-2 Rounds...3-3 thru 3-4 Strip...3-5 Flats (A-36)...3-6 thru 3-8 (M1044)...3-9 Squares...3-9 Reinforcing Bars...3-10 Reinforcing Mesh...3-10 TOLERANCES...3-11
Compression Members. Columns I. Summary: Objectives: References: Contents:
 Compression Members Columns I Summary: Structural members subjected to axial compression are known as columns or struts. Stocky columns may not be affected by overall buckling. Stocky columns may fail
Residual Stress Pattern of Stainless Steel SHS
 Residual Stress Pattern of Stainless Steel SHS M. Jandera & J. Machacek Czech Technical University in Prague, Czech Republic ABSTRACT: The investigation is focused on cold rolled square hollow sections
Steel structures I INTRODUCTION Steel structures Structural elements Structural design Design methods Euro code Chapter 2 LIMIT STATE DESIGN Limit
 Steel structures I INTRODUCTION Steel structures Structural elements Structural design Design methods Euro code Chapter 2 LIMIT STATE DESIGN Limit state design principles Limit states for steel design
Structural Steel Plate and Strip to EN 10025
 Data sheet: A3.7 Structural Steel Plate and Strip to EN 10025 General description ArcelorMittal South Africa produces and markets hot rolled structural steel plate and coil to EN 10025 in the following
`Limit State of Collapse in Compression Design of an Axially Loaded Short Column
 `Limit State of Collapse in Compression Design of an Axially Loaded Short Column Cl.39, p-70, IS:456-2000 Members in compression are called columns and struts. The term column is reserved for members which
Residual Stress Influence on Material Properties and Column Behaviour of Stainless Steel SHS. M. Jandera 1, J. Machacek 2
 Residual Stress Influence on Material Properties and Column Behaviour of Stainless Steel SHS M. Jandera 1, J. Machacek 2 Faculty of Civil Engineering, Czech Technical University in Prague Abstract The
Fundamental Course in Mechanical Processing of Materials. Exercises
 Fundamental Course in Mechanical Processing of Materials Exercises 2017 3.2 Consider a material point subject to a plane stress state represented by the following stress tensor, Determine the principal
7 LOCAL BUCKLING OF STEEL CLASS 4 SECTION BEAMS
 Jan Hricák, jan.hricak@fsv.cvut.cz WG3 - Michal Jandera, michal.jandera@fsv.cvut.cz WG2 František Wald, wald@fsv.cvut.cz 7 LOCAL BUCKLING OF STEEL CLASS 4 SECTION BEAMS Summary A significant progress in
Performance of Concrete Filled Steel Tubular Columns
 American Journal of Civil Engineering and Architecture, 217, Vol. 5, No. 2, 35-39 Available online at http:pubs.sciepub.comajcea521 Science and Education Publishing DOI:1.12691ajcea-5-2-1 Performance of
DIN WELDABLE NORMALIZED FINE GRAIN STRUCTURAL STEELS
 DIN 17102 WELDABLE NORMALIZED FINE GRAIN STRUCTURAL STEELS 1. Field of application 1.1 This standard applies hot rolled products in the form of flats (plate, strip, wide flats), sections and bars of weldable
Hull and machinery steel forgings
 (1978) (Rev.1 1980) (Rev.2 July 2002) (Rev.3 May 2004) Hull and machinery steel forgings.1 Scope.1.1 These requirements are applicable to steel forgings intended for hull and machinery applications such
MANUFACTURING TECHNOLOGY
 MANUFACTURING TECHNOLOGY UNIT II Hot & Cold Working Forging & Rolling Mechanical Working of Metals In this method no machining process is carried out, but it is used to achieve optimum mechanical properties
COLLAPSE OF A STEEL STRUCTURE AS A RESULT OF LOCAL BUCKLING
 SDSS Rio 010 STABILITY AND DUCTILITY OF STEEL STRUCTURES E. Batista, P. Vellasco, L. de Lima (Eds.) Rio de Janeiro, Brazil, September 8-10, 010 COLLAPSE OF A STEEL STRUCTURE AS A RESULT OF LOCAL BUCKLING
Section 906. STRUCTURAL STEEL
 906.01 Section 906. STRUCTURAL STEEL 906.01. General Requirements. Finished rolled shapes must be free from imperfections that affect strength and durability in accordance with ASTM A 6. Rolled shapes
CHAPTER 3 CODAL PROVISIONS AND DESIGN METHODS
 22 CHAPTER 3 CODAL PROVISIONS AND DESIGN METHODS 3.1 PREAMBLE The axial capacities of concrete-filled columns are predicted based on the provisions given in Eurocode4-1994 [10], AISC-2005[11], AISC- LRFD-1999
TESTS TO EXAMINE THE COMPACT WEB SLENDERNESS OF COLD-FORMED RHS by Tim Wilkinson and Gregory J. Hancock
 TESTS TO EXAMINE THE COMPACT WEB SLENDERNESS OF COLD-FORMED RHS by 1 2 Tim Wilkinson and Gregory J. Hancock Abstract: This paper describes a series of bending tests to examine the influence of web slenderness
A.M. (Nol) Gresnigt; S.H.J. (Sjors) van Es Delft University of Technology, The Netherlands
 Gresnigt; S.H.J. (Sjors) van Es Delft University of Technology, The Netherlands") A.M. (Nol) Gresnigt; S.H.J. (Sjors) van Es Delft University of Technology, The Netherlands a.m.gresnigt@tudelft.nl; s.h.j.vanes@tudelft.nl A European research project (RFCS) has started to provide economic
A.M. (Nol) Gresnigt; S.H.J. (Sjors) van Es Delft University of Technology, The Netherlands a.m.gresnigt@tudelft.nl; s.h.j.vanes@tudelft.nl A European research project (RFCS) has started to provide economic
CHAPTER 7 ANALYTICAL PROGRAMME USING ABAQUS
 87 CHAPTER 7 ANALYTICAL PROGRAMME USING ABAQUS 7.1 GENERAL With the advances in modern computing techniques, finite element analysis has become a practical and powerful tool for engineering analysis and
Rational application of hot finished rectangular hollow sections in steel structures
 Rational application of hot finished rectangular hollow sections in steel structures Krzysztof Kuchta 1,*, and Izabela Tylek 1 1 Cracow University of Technology, Faculty of Civil Engineering, ul. Warszawska
fifteen steel construction: materials & beams ARCHITECTURAL STRUCTURES: FORM, BEHAVIOR, AND DESIGN DR. ANNE NICHOLS SUMMER 2016 lecture
 ARCHITECTURAL STRUCTURES: FORM, BEHAVIOR, AND DESIGN DR. ANNE NICHOLS SUMMER 2016 lecture fifteen steel construction: materials & beams Steel Beams 1 Steel Beam Design American Institute of Steel Construction
Properties in Shear. Figure 7c. Figure 7b. Figure 7a
 Properties in Shear Shear stress plays important role in failure of ductile materials as they resist to normal stress by undergoing large plastic deformations, but actually fail by rupturing under shear
Forta FDX 27 ASTM FDX 27 / UNS S82031
 Forta FDX 27 ASTM FDX 27 / UNS S82031 General characteristics Ferritic-austenitic stainless steels also referred to as duplex stainless steels, combine many of the beneficial properties of ferritic and
CHAPTER 2. Steel and Iron Materials
 CHAPTER 2 Steel and Iron Materials BRS Rules, II -Part 1 Metallic Materials Chapter 2, Table of Contents Table of Contents Section 1 1. 2. 3. 4. 5. 6. 7. 8. 9. 10. Section 2 1. 2. 3. 4. 5. Steel Plates,
Steel Properties. History of Steel
 History of Steel Steel Properties Cast Iron Cast iron preceded wrought iron. It is brittle, has high carbon content with low tensile strength. It has excellent casting properties. It was mainly used to
COLD FORMING HOT-ROLLED WIDE FLANGE BEAMS INTO ARCHES Preliminary finite element simulations
 EUROSTEEL 8, 3-5 September 8, Graz, Austria COLD FORMING HOT-ROLLED WIDE FLANGE BEAMS INTO ARCHES Preliminary finite element simulations R.C. Spoorenberg, H.H. Snijder, J.C.D. Hoenderkamp, M.C.M. Bakker
Cast Steel Propellers W27. (May 2000) (Rev.1 May 2004)
 (Rev.1 May 2004)") (May 2000) (Rev.1 May 2004) Cast Steel Propellers 1. Scope 1.1 These unified requirements are applicable to the manufacture of cast steel propellers, blades and bosses. 1.2 Where the use of alternative
(May 2000) (Rev.1 May 2004) Cast Steel Propellers 1. Scope 1.1 These unified requirements are applicable to the manufacture of cast steel propellers, blades and bosses. 1.2 Where the use of alternative
ASTM A420-Standard Specification for Piping Fittings of Wrought Carbon Steel and Alloy Steel for Low-Temperature Service
 ASTM A420-Standard Specification for Piping Fittings of Wrought Carbon Steel and Alloy Steel for Low-Temperature Service 1. Scope 1.1 This specification 2 covers wrought carbon steel and alloy steel fittings
Question Paper Code : 11410
 Reg. No. : Question Paper Code : 11410 B.E./B.Tech. DEGREE EXAMINATION, APRIL/MAY 2011 Fourth Semester Mechanical Engineering ME 2254 STRENGTH OF MATERIALS (Common to Automobile Engineering and Production
10.5 ECCENTRICALLY LOADED COLUMNS: AXIAL LOAD AND BENDING.
 13 10.5 ECCENTRICALLY LOADED COLUMNS: AXIAL LOAD AND BENDING. Members that are axially, i.e., concentrically, compressed occur rarely, if ever, in buildings and other structures. Components such as columns
Casting. Forming. Sheet metal processing. Powder- and Ceramics Processing. Plastics processing. Cutting. Joining.
 Traditional Manufacturing Processes Casting Forming Sheet metal processing Powder- and Ceramics Processing Plastics processing Cutting Joining Surface treatment FUNDAMENTALS OF METAL FORMING Overview of
Control Lines & Flatpacks Control Line
 CONTROL LINE MANUFACTURING This range includes control lines (hydraulic tubing) designed for use in harsh environments such as those created by chemical injection or well monitoring and other applications
Standard Specification for Seamless and Welded Ferritic and Martensitic Stainless Steel Tubing for General Service
 SA-268/SA-268M ASME BPVC.II.A-2015 Standard Specification for Seamless and Welded Ferritic and Martensitic Stainless Steel Tubing for General Service 1. Scope 1.1 This specification covers a number of
D. Y. Abebe 1, J. W. Kim 2, and J. H. Choi 3
 Steel Innovations Conference 213 Christchurch, New Zealand 21-22 February 213 HYSTERESIS CHARACTERSTICS OF CIRCULAR PIPE STEEL DAMPER USING LYP225 D. Y. Abebe 1, J. W. Kim 2, and J. H. Choi 3 ABSTRACT
Sandvik SAF 2205 (Billets)
") Datasheet updated 2013 11 28 14:13:21 (supersedes all previous editions) Sandvik SAF 2205 (Billets) Sandvik SAF 2205 is a duplex (austenitic ferritic) stainless steel characterized by: High resistance
Datasheet updated 2013 11 28 14:13:21 (supersedes all previous editions) Sandvik SAF 2205 (Billets) Sandvik SAF 2205 is a duplex (austenitic ferritic) stainless steel characterized by: High resistance
Catalogue of European standards in the aluminium and aluminium alloys field
 Catalogue of European standards in the aluminium and aluminium alloys field Under revision New publications during last two years (2017-2018) September 2018 David KRUPKA AFNOR Normalisation Industrial
Effects of Width-to-Thickness Ratio of RHS Column on the Elasto-Plastic Behavior of Composite Beam
 Memoirs of the Graduate Schools of Engineering and System Informatics Kobe University No. 6, pp. 1 6, 2014. doi:10.5047/gseku.e.2014.001 Effects of Width-to-Thickness Ratio of RHS Column on the Elasto-Plastic
SPECIFICATIONS FOR THE CONSTRUCTION OF NEW PASSENGER EQUIPMENT CARS PREFACE
 SPECIFICATIONS FOR THE CONSTRUCTION OF NEW PASSENGER EQUIPMENT CARS Standard ADOPTED 1939; ADVANCED TO STANDARD, 1945. PREFACE The specifications have been prepared on the basis that they will be used
Lateral Force-Resisting Capacities of Reduced Web-Section Beams: FEM Simulations
 Lateral Force-Resisting Capacities of Reduced Web-Section Beams: FEM Simulations *Seungpil Kim 1), Myoungsu Shin 2), and Mark Aschheim 3) 1), 2) School of Urban and Environmental Engineering, UNIST, Ulsan
RFS-CT HISTWIN High-Strength Steel Tower for Wind Turbine
 RFS-CT-2006-00031 - HISTWIN High-Strength Steel Tower for Wind Turbine WP1.6 DESIGN OF STIFFENING RINGS BACKGROUND DOCUMENT Contractors AUTH, GLWIND Authors C. Baniotopoulos, I. Lavasas, G. Nikolaides,
STABILITY AND DUCTILITY OF CASTELLATED COMPOSITE BEAMS SUBJECTED TO HOGGING BENDING
 SDSS Rio 2010 STABILITY AND DUCTILITY OF STEEL STRUCTURES E. Batista, P. Vellasco, L. de Lima (Eds.) Rio de Janeiro, Brazil, September 8-10, 2010 STABILITY AND DUCTILITY OF CASTELLATED COMPOSITE BEAMS
National Physical Laboratory Hampton Road Teddington Middlesex United Kingdom TW11 0LW
 NPL REPORT DEPC MPE 007 Methodology for determining the resistance of welded corrosion resistant alloys to stress corrosion using the four-point bend method A Turnbull and W Nimmo NOT RESTRICTED NOVEMBER
Compression characteristics of spheroidal graphite cast iron pipe members
 High Performance and Optimum Design of Structures and Materials 455 Compression characteristics of spheroidal graphite cast iron pipe members T. Yamaguchi 1 & Y. Kimura 2 1 HINODE Ltd, Japan 2 New Industry