OPTIMISATION OF HDDR PROCESSING PARAMETERS OF SINTERED NDFEB MAGNETS
|
|
|
- Katrina Horton
- 6 years ago
- Views:
Transcription
1 OPTIMISATION OF HDDR PROCESSING PARAMETERS OF SINTERED NDFEB MAGNETS by Richard Stuart Sheridan A thesis submitted to the University of Birmingham for the degree of DOCTOR OF PHILOSOPHY School of Metallurgy and Materials College of Engineering and Physical Sciences University of Birmingham September 2013
2 University of Birmingham Research Archive e-theses repository This unpublished thesis/dissertation is copyright of the author and/or third parties. The intellectual property rights of the author or third parties in respect of this work are as defined by The Copyright Designs and Patents Act 1988 or as modified by any successor legislation. Any use made of information contained in this thesis/dissertation must be in accordance with that legislation and must be properly acknowledged. Further distribution or reproduction in any format is prohibited without the permission of the copyright holder.
3 Synopsis In recent years rare earth metals have hit the headlines due to supply restrictions of neodymium (Nd) and dysprosium (Dy) from the main supplier China. Many authors have addressed the so-called rare earth crisis by reducing rare earth usage, especially dysprosium content in rare earth magnets. Other research institutes have investigated the possibility of recycling scrap NdFeB-type magnets. The work in this thesis is aimed at investigating the possibility of recycling sintered NdFeB-type magnets using a combination of hydrogen decrepitation (HD) and the HDDR process (Hydrogenation Disproportionation Desorption and Recombination). Uncoated blocks of scrap sintered NdFeB were exposed to hydrogen at room temperature to break them down into a powder. The powder was then heated under vacuum and exposed to hydrogen at temperatures exceeding 800 ºC to initiate disproportionation. The pressure in the system was subsequently reduced to initiate recombination of sub-micron Nd 2 Fe 14 B grains surrounded by a fine network of Nd-rich grain boundary phase, before quickly cooling to prevent grain growth. The resulting powders were then tested on a vibrating sample magnetometer (VSM) to measure the magnetic properties and their microstructures analysed using various scanning electron microscopes (SEMs). The development of microstructure was analysed throughout the process, which identified a rod-like disproportionated structure resulting in good anisotropy in the recombined powder. However, oxidation at grain boundaries and triple points prevented complete disproportionation of triple points, leaving large pools of Nd-oxide in the final microstructure. It was found that the microstructure and magnetic properties are greatly affected by processing temperature, disproportionation pressure and recombination reaction i
4 time. The best magnetic properties were produced using 20 g of sintered Nd 13.4 Dy 0.7 Fe 78.6 Al 0.7 Nb 0.4 B 6.2, in-situ hydrogen decrepitation followed by HDDR with a reaction temperature of 880 ºC, disproportionation pressure of 1500 mbar, recombination under vacuum and then quick cooling. The resultant powder were tested using a VSM and was found to exhibit a remanence of 1.08 T, coercivity of 840 ka m -1 and a maximum energy product of 178 kj m -3. Sample batches up to 100 g could be HDDR processed with only small amounts of variation of magnetic properties. 400 g sample batches, however, resulted in large variations due to the effect of the endothermic recombination reaction altering the reaction kinetics, leading to incomplete recombination. It was also shown that by increasing the disproportionation pressure, samples of mixed composition input feeds can be processed simultaneously, however, there was also a large variation of magnetic properties. Production of bonded magnets from the resultant powder samples has given evidence that the HD and HDDR processes can be combined successfully as a method of recycling scrap NdFeB-type sintered magnets. However, the HDDR process parameters required vary depending on the composition or compositions of the input feed. ii
5 This thesis is dedicated the memory of Dr. Andrew John Williams to whom I will be eternally grateful for providing me with the inspiration to work on magnetic materials. iii
6 Acknowledgements Firstly I would like to thank Dr. Allan Walton. After the unexpected passing of Andy Williams, the Magnetic Materials Group was left in shock. With the group leader sadly deceased there were concerns about the future of the research group and on an individual note, the future of my PhD. Allan came to the rescue, helping us all deal with such a big loss and reassure us that everything would be OK. Not only has he helped me with the direction and completion of my PhD, he went out of his way and spent a lot of his own personal time trying to find me a project to provide me with funding whilst I finished my PhD over the past year. Allan has also recommended me for positions that will improve my career and allowed me to gain valuable experience by representing our research group at a Rare Earth Mission in Japan. For all of these reasons and many more I am very grateful. I would also like to thank Professor Rex Harris, who despite occasionally getting my name wrong, has always provided excellent discussions whether it was related to work or just out of general interest. His experience and seemingly endless knowledge were of great help, especially when writing and submitting journal and conference papers. I gratefully acknowledge the funding sources that made my thesis possible. Funding was provided by EPSRC for the first three years. Six months of further study were funded by Waste and Resources Action Programme. I would also like to acknowledge the UK Magnetics Society, the Armourers and Brasiers and the Midlands Energy Graduate School for your contributions to allow me to demonstrate my work at the Rare Earth Permanent Magnets and their applications conference in Japan, September Thanks also go to all members of the Magnetic Materials Group. Alex Bevan and Andy Bradshaw were instrumental when building and fixing piece of equipment, the latter of which I am especially grateful for your help with. Vicky Mann, Malik Degri, Jonathan Meakin, Matthew Farr and honourary member Lydia Pickering, thank you for all of your help, interesting discussions, general iv
7 friendship and support and keeping me as sane as possible throughout the entirety of my postgraduate study - especially in the final stages of thesis writing. I hope I have not been too much of a burden on you all and that I can return the favour in time. Thanks go to all of my housemates who have put up with me and provided me with excellent methods of procrastination throughout the years. I am very lucky to have lived with Oli Gilks, Tim Roome and Joe Cohen in particular throughout these difficult years of study and I can honestly say that without you all I would have completed this thesis much sooner, but I would have had a much worse quality of social life. Thanks also go to the wonderful Lucy Le Chat for being a very loving and caring girlfriend during the last 6½ years. You have made me very happy, supported me and kept me going during some difficult times over the last few years and most recently provided me with a place to live. Lastly I would like to thank my family for their love and support throughout my 7 years at university, both during my undergraduate and my postgraduate degrees. I have always enjoyed coming home to get away from the stress of work and you guys always keep me calm and make me feel loved. Even during long periods of time where I was unable to come home, just speaking to Mum, Dad, Sarah and Kayleigh kept my spirits up and assured me along the way. Without all of your love, support and encouragement, this experience would have been much more difficult. Richard Stuart Sheridan University of Birmingham September 2013 v
8 Table of Contents Chapter 1 - Introduction History of Magnetism Magnet Market and Applications... 7 Permanent Magnet Production... 7 Permanent Magnet Applications... 9 Rare-Earth Magnet Resources The Magnetic Triangle Scopes and Aims of the Project Chapter 2 Principles of Magnetism Origin of Magnetism Magnetic Behaviour Diamagnetism Paramagnetism Ferromagnetism Antiferromagnetism Ferrimagnetism Intrinsic Properties Saturation Magnetisation Anisotropy Magnetic Domains Hysteresis Loops Remanence Coercivity Maximum Energy Product Coercivity Mechanisms Nucleation Domain Wall Pinning Single Domain Particle vi
9 Chapter 3 Literature Review Neodymium Iron Boron Magnets Production of NdFeB Book mould casting and strip casting Hydrogen Decrepitation Sintered NdFeB Melt Spinning of NdFeB Hydrogenation Disproportionation Desorption and Recombination of NdFeB Recycling rare earth magnets Hydrogen Processing Pyrometallurgy Hydrometallurgy Sintering Recycling using HDDR Chapter 4 Materials and Methods Material Selection Production of HDDR Material Initial Sample Preparation Hydrogen Decrepitation (HD) Hydrogenation Disproportionation Desorption Recombination (HDDR) Production of Bonded Magnets Characterisation Techniques Permeameter Vibrating Sample Magnetometer (VSM) MagScan Microscopy Sample Preparation Optical Microscopy Scanning Electron Microscopy Density Measurements vii
10 Chapter 5 Starting Materials Chapter 6 Development of Microstructure Sintered NdFeB Hydrogen Decrepitation Heating and Degassing Part-Disproportionated Structure Fully Disproportionated Structure Part Recombined Fully Recombined Structure Overall Microstructural Transformation Chapter 7 Equilibrium Point Identification & Recombination Chapter 8 Effect of HDDR Processing Temperature Chapter 9 Reproducibility & Large Batches Variation of magnetic properties within a batch Increasing Batch Size Chapter 10 Mixed Input Feeds Chapter 11 Bonded Magnets Binding Agents Isotropic NdFeB Bonded Magnets Anisotropic NdFeB Bonded Magnets viii
11 Chapter 12 - Conclusions and Future Work Development of Microstructure Equilibrium Point & Recombination Effect of HDDR Treatment Temperature Reproducibility and large batches Mixed Input Feeds Bonded magnets Future Work Appendix Publications References Presentations and Figures Bibliography ix
12 List of Abbreviations at% B (BH) max B r c-hddr d-hddr DSC Fe 2 B G H H 2 H c HD HDD HDDR HR-SEM ICP J ka m -1 kj m -3 M MGOe M s - Atomic Percent - Magnetic Induction - Maximum Energy Product - Remanence - Conventional Hydrogenation Disproportionation Desorption Recombination - Dynamic Hydrogenation Disproportionation Desorption Recombination - Differential Scanning Calorimetry - Ferro-boron - Gauss - Applied Field - Hydrogen - Coercivity - Hydrogen Decrepitation - Hard Disk Drive - Hydrogenation Disproportionation Desorption Recombination - High Resolution Scanning Electron Microscope - Ion-Coupled Plasma - Polarisation - kilo Amps per metre - kilo Joules per metre cubed - Magnetisation - Mega Gauss Oersted - Saturation Magnetisation Nd 2 O 3 - Neodymium Oxide x
13 NdFeB NdH NdH 2 Oe ppm PTFE RE s-dr SEI SEM SmCo T T c TEM TM v-hd χ VCM VSM wt% - Neodymium Iron Boron - Neodymium Hydride - Neodymium Dihydride - Oersted - Parts Per Million - Poly-tetra-fluro-ethylene - Rare Earth - Slow Desorption Recombination - Secondary Electron Imaging - Scanning Electron Microscope - Samarium Cobalt - Tesla - Curie Temperature - Transition Electron Microscope - Transition Metal - Vacuum Hydrogenation Disproportionation - Magnetic Susceptibility - Voice Coil Motor - Vibrating Sample Magnetometer - Weight Percent xi
14 Chapter 1 Introduction Chapter 1 INTRODUCTION 1.1. History of Magnetism Western scientists and historians are generally of the belief that the Greeks were the first to report the magnetic properties exhibited by the magnetic ore FeO-Fe 2 O 3 known as Lodestone or Magnetite (also referred to as leading stone or compass stone). Lucretius Carus (1 st Century B.C.) was quoted as saying The magnet s name the observing Grecians drew from the Magnetick region where it grew, whereas Pliny s account in De Magnete by William Gilbert (1600) was that the magnet stone was named after its discoverer, the Shepherd Magnes, the nails of whose shoes and the tip of whose staff stuck fast in a magnetick field while he pastured his flocks. Other reports believe that magnetism was first discovered in China around 4000 BC in the same form of magnetite, which was then described as a ferrous oxide stone that had the ability to attract iron. It was also said that meteoric iron was discovered and utilised in the period B.C. as a primitive compass consisting of a spoon-shaped magnetite object with a smooth bottom, resting on a polished surface, the handle of which would always come to rest pointing south, an example of this can be seen in figure below. A similar device employed a floating fish with a head made of magnetised iron which would also point south. In old Chinese encyclopaedias there is information suggesting that magnetic needles were used on ships in 400 B.C. for orientation. 1


15 Chapter 1 Introduction Although the origin for the discovery of magnetism is widely disputed, it is evident that there were many locations worldwide where lodestones were used. Lodestones were also found in Arabia, Norway, Germany and many other places. Some of the lodestones were very weak, however some were very powerful and highly sought after, these were mainly found in Norway and were dusky blue in colour. The main comparisons between lodestones were whether they were hard or soft, heavy or light, porous or solid and strong or weak, however there were no defined units of measurement at this time. Figure A typical lodestone compass consisting of a spoon-shaped lodestone on a polished surface. Image from: accessed 05/08/2012 Humanity s understanding of magnetism was furthered by the work of William Gilbert for his work in De Magnete (~1600) which led to him being widely accepted as the father of magnetism. Gilbert pioneered the first fundamental studies of magnetism and introduced the idea of the existence of magnetic forces, magnetic field lines and magnetic poles. It was Gilbert who made the link between the distribution of magnetic field from a 2
16 Chapter 1 Introduction spherical magnet and that of the Earth and therefore concluded that the Earth is essentially a giant magnet itself. Further work led to the discovery of the Curie Temperature, by heating lodestone to a point at which it lost its magnetisation. The next major reported advancement in the behaviour of magnets was over two centuries later when Hans Christian Ørsted discovered that there was a relationship between electrical current and magnetism. As with many great discoveries this relationship was found by accident when an electrical current passing through a wire affected the behaviour of a nearby compass needle. This discovery prompted a boom in research into the relationship between magnetism and electricity by historical figures such as Andre-Marie Ampere, Carl Friedrich Gauss and Michael Faraday. As new magnetic materials were discovered and developed during the 20 th century their magnetic properties improved rapidly and by the turn of the 21 st century the useful amount of work which could be performed by these materials (maximum energy product) had increased by a factor of 400. The first man-made magnetic material was that of steel. Several magnetic steels were developed, including steel containing iron, carbon, tungsten and chromium named KS steel developed in the year 1917 by Kotaro Honda. These KS steel magnets had a low maximum energy product (<10 kj/m 3 ). In the 1930s a new magnet was discovered in the form of an iron-based alloy containing aluminium, nickel and copper [Mishima et al. (1932)] and was aptly named Alnico. In their early days Alnico magnets were able to produce a maximum energy product of around 40 kj/m 3, however later developments in the 1950s led to the production of anisotropic columnar Alnico with maximum energy products closer to 88 kj/m 3 [Lutejin et al. (1956)]. Along with the columnar Alnico, a very important material was 3
17 Chapter 1 Introduction developed when ferrite magnets were produced, again in the 1950s. Although they had a lower maximum energy product than the columnar Alnico magnets, ferrites were very cheap to produce as they contained iron oxides (typically strontium hexaferrites, SrO.6Fe 2 O 3 ) as their main component and can be processed in air, which resulted in them being used in many cost-driven applications. Ferrites are still very widely used. In 1966 the first Rare-Earth (RE) Transition Metal (TM) magnets were discovered based upon an alloy of yttrium and cobalt, YCo 5. Within just a few years the yttrium was replaced with samarium to produce SmCo 5 type magnets with the ability to produce a maximum energy product of around 160 kj m -3 [Strnat et al. (1967)]. Further work on samarium cobalt with additions such as iron, copper and zirconium gave birth to a new compound based on Sm 2 Co 17 in the 1970s with an increased maximum energy product in the region of 240 kj m -3 as reported by Tawara & Strnat (1976). These SmCo-type magnets are well known for having high Curie temperatures and excellent resistance to demagnetisation, making them ideal for use in high temperature applications such as aero engines. SmCo-type magnets became very expensive to produce in the 1980s due to a sharp increase in the price of cobalt. This acted as a driver to produce non-cobalt-containing magnetic materials. The next generation of rare-earth magnets was based upon neodymium iron boron (NdFeB) magnets which exhibit higher (BH) max than any other magnets produced with a maximum energy product of 300 kj m -3. Continued work on NdFeB has led to further improvements in magnetic performance with (BH) max now being reported in excess of 400 kj m -3. NdFeB magnets are limited in their usable temperature range due to the fact that they have a low Curie temperature, however it has been demonstrated that additions of other rare-earth materials such as dysprosium can increase the coercivity leading to improved thermal stability. In the last 5 years there has been considerable concern over the supply and 4
18 Chapter 1 Introduction demand of rare-earth metals including neodymium and dysprosium which has caused price hikes as previously observed for cobalt in SmCo type magnets. This has led to research into minimising the rare earth content of magnets and into alternative non-rare earth magnets. More recent studies on samarium-based magnets occurred in the 1990s with the development of Sm 2 Fe 17 N 3 magnets capable of producing a similar maximum energy product to Sm 2 Co 17 but with better resistance to corrosion and the ability to be used at higher temperatures. Coey & Sun (1990) heated Sm 2 Fe 17 up to temperatures between ⁰C alloys under 1 bar ammonia or 1 bar nitrogen to form these Sm-Fe-N alloys. These magnets exhibit excellent anisotropy and Curie temperatures over 150 ⁰C but they cannot be formed into sintered magnets. These magnets are generally metal bonded rather than polymer bonded due to the low thermal stability of polymers. It has been reported by Otani et al. (1991) and Suzuki & Miura (1992) that the best metal for bonding Sm-Fe-N magnets is Zn where up to 5 wt% can be added. The Zn has been shown to substitute for Fe in the surface layers of the fully processed magnet, causing an increase in coercivity. This evolution of permanent magnets is graphically represented in figure 1.1.2, comparing the maximum energy product of each material. It can be observed that the (BH) max of the magnetic materials has increased with time, with major increases occurring with the introduction of SmCo-type magnetic materials and NdFeB-based sintered magnets. 5
19 Chapter 1 Introduction Figure Improvements of permanent magnets throughout the 20 th century comparing development of maximum energy product of each type of magnet with advancing time [Hadjipanayis (2012)] 6
20 Chapter 1 Introduction 1.2. Magnet Market and Applications Permanent Magnet Production The production capacity for different types of permanent magnet and the locations where those materials have been produced has changed dramatically over the past 30 years. Figure below shows the quoted worldwide production of all permanent magnets in 2007 by Sugimoto (2010). It can be seen from this table that China produced over 63% of all permanent magnets in that year whereas the second and third placed producers, Europe and Japan only produced around 8%. The majority of magnets, by quantity, are sintered ferrites. China produced 95% of these and a significant percentage of all other magnets, including rare-earth based materials. Since 2007 China have increased this share and it is predicted to maintain this level in the near future. Figure Worldwide production of permanent magnets in 2007 (ton/year) [Sugimoto (2010)] There are wide ranging figures for the worldwide market for NdFeB. For example Sagawa (2010) quoted the overall output of sintered NdFeB as around 60,000 tons (figure 1.2.2), whereas Sugimoto quoted the market for both bonded and sintered NdFeB in 2007 as 33,080 tons. Sagawa forecasts that between there will be an annual increase in 7

21 Chapter 1 Introduction demand of around 10%, with 100,00 tons of sintered NdFeB being produced in 2015 and 160,000 tons in Figure Estimated worldwide demand for sintered NdFeB over the period [Sagawa (2010)] Hatch (2012) suggested figures for worldwide rare earth oxide production solely for use in permanent magnet manufacture, which are shown in table 1.1. Hatch estimated an output of 21,000 tons in 2011, and forecasts an increase of 15,000 tons per year by 2016 to 36,000 tons, which represents an annual increase of just over 10% on a linear scale or an overall increase of ~71% in 5 years. This agrees with the rate of increase of permanent magnet production estimated by Sagawa (2010). Table 1.1. Estimated global demand of rare earth oxides for use in permanent magnets from 2011 with forecast growth in 2016 [Hatch (2012)]. China Japan & SE Asia USA Other Total 2011 estimated 16,500 3, , forecast 28,000 4,500 2,000 1,500 36,000 8
22 Chapter 1 Introduction Permanent Magnet Applications Permanent magnets have a very wide range of applications and have become a large part of everyday life; so much so that almost everywhere you look there will be an item or device containing a magnet of some description. The type of permanent magnet used for any given application is carefully selected depending on the device it is being used in and the most important driving force, i.e. cost, magnetic strength, corrosion resistance, temperature of application etc. The main applications for permanent magnets today are shown in Table 1.2 with a breakdown of the rare-earth permanent magnet market for 2012 shown in figure Table 1.2. List of major applications of permanent magnets and the magnet type associated with that application. Aerospace Automotive Electronics Applications Frictionless bearings, Navigation, Engine motors, Generators, Actuators Actuators, Motors, Speedometer, Anti-lock Breaking System (ABS), Electric windows Hard Disc Drives, Loudspeakers, Magnetic recording media, Personal Computers (PC) Magnets SmCo-type Ferrites, NdFeB, Alnico NdFeB, Ferrites Household Fridge magnets, Refrigerators, Ferrites, Medicine Magnetic Resonance Imaging (MRI), Motors & Generators Telecommunications Pacemakers, Hearing aids, Magnet therapy, Dentures, Surgical tools DC motors for tools, Stepping motors, Magnetic bearings, Loudspeakers, Microphones, Switches and relays, Mobile phones NdFeB, SmCo-type SmCo-type, NdFeB, Ferrites AlNiCo, NdFeB. Ferrites 9
![Chapter 1 Introduction Figure 1.2.3. Rare-Earth permanent magnet market share in 2012 [Shaw & Constantinides presentation (2012)] It can be observed from figure 1.2.3 that the largest use of rare-earth magnets is in motors and generators, which has recently overtaken the hard disk drive (HDD) market.](/docs-images/72/66468248/images/23-0.jpg "This shift has occurred due to recent improvement in magnetic performance and their increased use in clean technologies such as hybrid and electric motor vehicles as well as in large scale offshore")
23 Chapter 1 Introduction Figure Rare-Earth permanent magnet market share in 2012 [Shaw & Constantinides presentation (2012)] It can be observed from figure that the largest use of rare-earth magnets is in motors and generators, which has recently overtaken the hard disk drive (HDD) market. This shift has occurred due to recent improvement in magnetic performance and their increased use in clean technologies such as hybrid and electric motor vehicles as well as in large scale offshore wind turbines (requires between tonne of NdFeB per megawatt). Du and Graedel (2011) found that audio systems, such as loudspeakers contribute around a quarter of rare earth permanent magnet production, which is not in keeping with figure 1.2.3, however their findings were based on analysing the 2007 market and studying electronics scrap. 10
24 Chapter 1 Introduction Rare-Earth Magnet Resources In recent years there have been increasing problems with the supply of rare-earths. Hatch (2012) discussed the shift in production over the last century, stating that up until the 1940s, rare earth oxides were predominantly produced in India and Brazil until Australia, Malaysia and South Africa became involved in the industry. Soon after this, the Mountain Pass bastnaesite mine in California started production and became the largest producer of rare-earths in the world. In the 1980s China began to produce rare earth oxides from ionadsorption clays and mineral ore deposits and this region has become increasingly dominant. Today China produces over 95% of the world supply of rare earth oxides. The Chinese Ministry of Commerce have imposed quotas and taxes on exports of rare earth oxides, metals and alloys since In July 2010 this quota was cut by 40% compared to the previous year, leading to supply problems for non-chinese producers and users, which resulted in volatile prices for rare earth metals. The rare earth metals are also roughly double the price if purchased outside of China. Figure below shows how rare earth prices have changed over the last few years. For example Nd metal rose from ~40 $ kg -1 to ~460 $ kg -1 between July 2010 to July 2011, and Dy rose from ~350 $ kg -1 to ~3200 $ kg -1 over the same period. These prices have since reduced, as shown in figure


25 Chapter 1 Introduction Figure Price changes of Nd metal and Dy metal between April 2009 and April 2012 (data from Figure Current prices of Nd metal and Dy metal between March and September 2013 (data from accessed 02/09/2013) In 2012 the American Physical Society (APS) and the Materials Research Society (MRS) together created a list of the critical materials for clean energy technologies which were at risk of supply issues. Simultaneously the US Department of Energy created a similar list and on both lists the rare-earth elements appeared at the top. The same materials featured on an EU Critical Materials list, also published in This has further highlighted the importance of these materials for the advancement of clean energy, giving extra support to the argument for recycling rare-earth magnets. Figure below shows the elements included in 12

26 Chapter 1 Introduction the critical materials lists in the form of the periodic table of elements, where the coloured elements are on the APS and MRS list, and the elements with thick black borders are on the US Department of Energy list. Figure Adapted periodic table of the elements highlighting the elements on the list of critical materials for clean energy technologies devised by APS and MRS. Image taken from accessed 15/01/2014 Although China has dominated the rare earth market in recent years, there are many other deposits around the world and rare earths are therefore not as rare as their name suggests. Many previously closed or not fully explored deposits are now undergoing feasibility studies and coming back on-line. Some of the largest known deposits are shown below in figure

27 Chapter 1 Introduction Figure Global locations of known rare-earth deposits (Hatch 2012) 14
28 Chapter 1 Introduction To overcome any potential resource issues there are many possible solutions. It would be possible to change the application to remove or reduce the amount of rare-earth magnetic material used; this could include changing the design of products or using alternative magnetic materials such as ferrites. However, this is likely to result in a drop in efficiency of these devices. More rare-earth metals could be extracted from new sources shown in figure to create a supply less dependent on China. Another option could be to recycle NdFeB magnets contained in scrap electrical equipment. This could provide a constant supply of rareearth material that will have many advantages over primary mined sources of material. For example NdFeB magnet scrap will only contain 3 or 4 rare earth elements (Nd, Dy, Pr, Tb), they will not contain radioactive thorium which can be found in rare earth ores and it could be cheap and clean to extract in comparison to mined sources of material. In order for recycling to be a viable option then efficient and cost-effective recycling processes need to be developed for these materials. The main sources of electrical scrap containing NdFeB-type magnets today include hard disk drives and loudspeakers. If the magnets could be harvested from these products then this could act as a feedstock for producing new magnets using a number of different routes. However today less than 1% of rare earths are recycled [Binnemans et al., (2013)]. 15

29 Chapter 1 Introduction The Magnetic Triangle The magnetic triangle, shown in figure describes the three important stages of producing an ideal magnet for a given application. The three stages link together and have a great effect on the extrinsic properties of a magnet, e.g. remanence and coercivity. To produce the ideal magnet it is imperative to get the processing right, the processing greatly affects the microstructure of the final magnet, the microstructure then determines the magnetic properties of the magnet. Figure The magnetic triangle used to describe the three important characteristics when producing a magnet for a given application. 16
30 Chapter 1 Introduction 1.3 Scopes and Aims of the Project The aim of this project is to investigate a possible method of recycling NdFeB-based magnets using a combination of HD (Hydrogen Decrepitation) and HDDR (Hydrogenation Disproportionation Desorption Recombination) to produce high energy product, anisotropic powders suitable for use in bonded magnets. Previous work at the University of Birmingham has utilised hydrogen as a tool for breaking down NdFeB magnets into a powder using the HD process and compacting and sintering the powder to produce new magnets [Zakotnik et al. (2004), Zakotnik et al. (2006), Zakotnik et al. (2008), Zakotnik et al. (2009) and Walton et al. (2012)]. In this project the HD processed powder is further processed using a high temperature hydrogen processing route called HDDR. The starting magnets are scrap sintered NdFeB alloys of known composition which will be processed using different HDDR treatment conditions. The variables will include for example processing temperature and pressure. The main aim of this project is to optimise the processing conditions for HDDR treatment in order to produce the highest energy product anisotropic material suitable for bonded magnets. The results and findings from these investigations will be applied to a range of compositions and mixed input feeds to demonstrate the use of these processes for recycling of mixed composition, real, scrap sintered NdFeB. 17
31 Chapter 2 Principles of Magnetism Chapter 2 PRINCIPLES OF MAGNETISM 2.1 Origin of Ferromagnetism A magnetic field is produced when an electrical charge is in motion; this can be achieved either by: Passing an electrical current through a copper coil (electromagnetism) or Spinning electrons orbiting a nucleus within a given material When passing an electrical current through a copper coil it has been shown that a magnetic field will be produced within the coil which will be maintained until the electrical current is removed. Therefore, it can be said that a magnetic field can only exist in the presence of moving electrical charge. An atom consists of a nucleus surrounded by completely full and partially filled electronic shells, the electrons within these shells orbit the nucleus of the atom as observed in figure In a magnetic material the moving electrical charge is in the form of spin from the electrons orbiting in partially filled electronic shells and the orbital motion itself. The filled electronic shells do not contribute to the magnetic field produced as all electrons are paired up and cancel each other out, resulting in a net zero spin. Magnetism is only exhibited in materials with the optimal set of conditions and electronic configuration which requires unpaired electrons to generate a net spin within each atom. 18
32 Chapter 2 Principles of Magnetism Figure The spin of an electron as it orbits its nucleus within a material. Image from Accessed 15/01/2014. The net spin of each atom is termed the magnetic moment and it is the sum of these magnetic moments that creates the magnetic field that is exhibited by the material as a whole. If a material does contain unpaired electrons that exhibit magnetic moments, that material may still not produce a magnetic field as each of the magnetic moments will be randomly oriented, effectively cancelling each other out. It is only in specific cases where these magnetic moments line up spontaneously (or by placing the material in a magnetic field) that a total net magnetic field can be produced by the material. The magnetic field or induction of a material, B, incorporates the magnetisation of the material in terms of orbital motion and electron spins, M and the flow of charge from an external magnetising force, H in the following equation: [Equation 2.1.] where µ 0 is the permeability of free space = 4π x 10-7 N A -2 The magnetisation of a material is dependent on the magnetic field acting upon it with relation to its magnetic susceptibility, χ. Magnetic susceptibility is a dimensionless intrinsic 19
33 Chapter 2 Principles of Magnetism property that indicates the magnetisation of a material in response to an applied magnetic field. This relationship can be show as: M = χ H [Equation 2.2.] All materials respond to an applied magnetic field to a degree although very sensitive equipment is required to measure this reaction in some materials, the result of these interactions allow us to categorise every material into one of five main groups, depending on their magnetic behaviour. 20

34 Chapter 2 Principles of Magnetism 2.2 Magnetic Behaviour There are five major categories of magnetic behaviour into which any material can be placed: Diamagnetism Paramagnetism Ferromagnetism Antiferromagnetism Ferrimagnetism The following periodic table of elements in figure is colour coded to show the type of magnetic behaviour exhibited by each element at room temperature (21 ºC): Figure Colour coded periodic table of elements showing the characteristic magnetic behaviour of each element. Accessed 14/02/2013 As observed from figure 2.2.1, the most common types of magnetism at room temperature are paramagnetism and diamagnetism whereas there are only three ferromagnetic elements and only two antiferromagnetic elements. Only ferrites can exhibit ferrimagnetism, all of which are compounds, hence why none of the elements in the table appear as 21
35 Chapter 2 Principles of Magnetism ferrimagnetic. These types of magnetic behaviour are described below and summarised in schematic form in figure Diamagnetism Diamagnetism is a behaviour that opposes any applied magnetic field and is present in all materials; however, its effects are very weak and can easily be masked by other magnetic behaviours. This behaviour follows Lenz s Law which states that the external applied magnetic field affects the orbits of the electrons and hence the spins will change and realign to oppose the external field, effectively displaying negative magnetic susceptibility. For this reason, diamagnets are not permanent magnets as this behaviour relies on the application of an external field, and diamagnetism is therefore a transient state. For diamagnets, typical susceptibility, χ 10-5 Paramagnetism Unlike diamagnetism, paramagnetism is only present in materials where the atoms have a permanent magnet dipole moment due to the existence of unpaired electrons. Where no external field is present, these magnetic dipoles orient themselves randomly within the material, in effect cancelling each other out to produce zero net magnetic field. When placed in an external magnetic field, these dipoles will align along the direction of the applied field; however, there is little to no interaction between neighbouring dipoles and so thermal agitation of the atoms easily disrupts the ordering, leading to weak magnetisation. The 22
36 Chapter 2 Principles of Magnetism temperature dependence of magnetic susceptibility of paramagnets can be classified by the Curie law: χ = [Equation 2.3.] where C is the Curie constant of the material and T is the temperature in Kelvin. For paramagnets, typical susceptibility, χ 10-4 Ferromagnetism Like paramagnetism, ferromagnets have partially filled electronic shells containing unpaired electrons that form magnetic dipoles. Unlike paramagnetism, in ferromagnets there is a strong interaction between neighbouring dipoles that causes them to align themselves in a parallel formation to reduce the overall energy state in the material allowing the alignment to remain after an external field has been removed. Ferromagnets can however, lose this alignment when heated to a temperature specific to each material known as the Curie temperature (T c ) where the thermal energy is high enough to disrupt the strong alignment in the magnet, leading to misaligned magnetic moments and zero net magnetisation and the material effectively becomes paramagnetic. The material would then need to be placed in an external magnetic field at a temperature below T c again to realign the magnetic dipoles and recreate a permanent magnet. At zero Kelvin the ferromagnet dipoles will align perfectly and hence the magnetic field reaches saturation, this magnetisation will decrease with increasing temperature until reaching 23
37 Chapter 2 Principles of Magnetism T c. Figure shows the effect of temperature on the saturation magnetisation of a ferromagnet from zero Kelvin up to the Curie temperature. M s T c 0 T Figure Variation of saturation magnetisation of a ferromagnet with temperature There is an exchange force between neighbouring atoms which was proposed by Heisenberg in 1927, this exchange force allows electrons to swap or exchange places with electrons on neighbouring atoms. These electrons maintain alignment information about dipole moment direction, which can be either positive (ferromagnetic) or negative (antiferromagnetic). The exchange forces reduce with increasing distance, leading to ferromagnetism being sensitive to inter-atomic distance and the diameter of the unfilled electron subshell. Figure shows the Bethe-Slater curve, which plots the ratio of atomic radius to the radius of the 3d subshell against the exchange integral for ferromagnetic and antiferromagnetic materials. It can be observed that Co has the highest exchange integral, closely followed by Fe and then Ni which are all ferromagnetic, whereas Mn and Cr exhibit a negative exchange integral and are therefore antiferromagnetic. 24
] Ferromagnetism exhibits the strongest magnetic force out of all five behaviour types and can be physically felt when holding a ferromagnet in each hand and")
38 Chapter 2 Principles of Magnetism Figure Bethe-Slater curve describing the exchange integral against the ratio of the atomic radius to the ratio of the 3d subshell. [Walton Undergraduate Lecture (2013)] Ferromagnetism exhibits the strongest magnetic force out of all five behaviour types and can be physically felt when holding a ferromagnet in each hand and holding them close to each other. The temperature dependence of the susceptibility of a ferromagnet can be described using the Curie-Weiss law in the form of χ = [Equation 2.4.] For ferromagnets, typical susceptibility, χ 50 to 10 5 Antiferromagnetism Antiferromagnets contain magnetic dipoles that align with their neighbours; however, they have a tendency to point in the opposite direction to their neighbour. For example, the dipoles will all align vertically within the material but if one dipole is pointing up, the next is pointing down, then up, then down etc. throughout the entire lattice. Due to the anti-alignment 25
39 Chapter 2 Principles of Magnetism of the magnetic dipoles pointing in opposite directions, antiferromagnets exhibit zero net magnetic field. When heated to a specific temperature called the Néel Temperature (T N ), antiferromagnets will lose their order and become paramagnetic. These magnet types appear on the negative part of the Bethe-Slater curve as previously demonstrated with Mn and Cr. Antiferromagnetic materials follow a modified Curie-Weiss law in the form of χ = T > T N [Equation 2.5.] For antiferromagnets, typical susceptibility, χ 10-5 to 10-3 Ferrimagnetism Ferrimagnetism is only present in certain compounds with complex crystal structures. Like ferromagnets, ferrimagnets also retain their magnetisation when removed from an external magnetic field and become paramagnetic above the Curie Temperature. Their magnetic dipole structure is similar to antiferromagnets where they have opposing direction within the same alignment; however, the magnetic moments in one direction is larger than in the opposite direction, resulting in a net magnetisation. For ferromagnets, typical susceptibility, χ 50 to

40 Chapter 2 Principles of Magnetism Figure Table showing the magnetic behaviour of magnetic domains in permanent magnets and the relationship between magnetisation and applied magnetic field. Adapted from Materials-Background/Magnetic-Materials-Background-4-Classification-of-Magnetic- Materials.pdf Accessed 15/01/
41 Chapter 2 Principles of Magnetism 2.3 Intrinsic Properties As well as magnetic properties that are controlled by microstructure, there are also properties of magnetic materials that are solely influenced by the material itself and hence are not affected by the processing route used to manufacture the magnet or the resultant microstructure. Saturation Magnetisation The saturation magnetisation, or M s, of a magnet is the maximum amount of field that can be exerted by a magnet on its surroundings. This is greatly affected by the alignment of the magnetic moments within the magnet, the crystal structure of the magnet and the presence of non-magnetic elements within the system. Any misalignment of magnetic moments will cause a reduction in overall magnetic saturation, as will an increase in non-magnetic elements being present within the material. Anisotropy Anisotropy is observed when the properties of a material differ depending on the direction of testing. Magnetocrystalline Anisotropy The magnetic properties of the material are affected by the orientation that the magnetic dipoles are aligned in, i.e. magnetic moment can be higher in one crystallographic direction than another. This anisotropy gives rise to easy and hard directions of 28
.")

42 Chapter 2 Principles of Magnetism magnetisation, where magnetic moments line up preferentially along a certain axis (easy direction) when placed in a magnetic field, however, it is possible to align them in a nonpreferred orientation in an applied field, although it takes a larger amount of energy to do so (hard direction). Samples that exhibit uniaxial anisotropy are very hard to demagnetise as it takes a large amount of energy to rotate the direction of magnetisation, however, some anisotropic magnets have multiple easy directions that can exist, such as along a preferred crystallographic plane. These magnets are easier to demagnetise. Magnets with high magnetocrystalline anisotropy have one or more preferred directions of magnetisation which require low fields to align in these directions, this makes it very difficult to magnetise it in any other (hard) directions. Therefore, it is energy intensive to demagnetise as it requires high fields in a demagnetising direction to change the direction of magnetisation in the domains. The magnetisation behaviour and crystallographic easy and hard directions of magnetisation are shown in figure Magnets that exhibit this mechanism usually have very high coercivity, such as rare earth magnets. Figure Magnetisation behaviour in easy and hard directions of magnetisation. Image from 29
43 Chapter 2 Principles of Magnetism Shape Anisotropy Shape anisotropy exists when magnetic particles are not perfectly spherical, causing a difference of magnetic properties in each direction depending on the morphology in the particles. For example Alnico magnets have elongated particles that exhibit higher magnetisation along the length of the particle; however, they exhibit very low coercivity as the particle morphology does not contribute to the resistance to demagnetisation of the material. 30

44 Chapter 2 Principles of Magnetism 2.4 Magnetic Domains Magnetic domains are small, spontaneously formed regions of uniform magnetisation that exist within a magnetic material below the Curie Temperature. The formation of these domains reduces the energy of the internal system by reducing the magnetostatic energy field produced by the material. A single region of directional magnetisation would create a demagnetising field outside itself which stores a large amount of magnetostatic energy. If this region splits into two regions aligned antiparallel the external demagnetising field would be reduced, storing lower magnetostatic energy. Further division and rotation of these domains could form a closed loop with zero demagnetising field produced, as shown below in figure 2.4.1, which is very important especially in soft magnets. Figure Schematic representation of the division of magnetisation into domains in a magnetic material to reduce internal system energy. Image from Materials-Background/Magnetic-Materials-Background-6-Domains.pdf The theory of magnetic domains was proposed by Pierre-Ernest Weiss in 1906 in order to explain the spontaneous alignment of magnetic moments within a ferromagnet. In this theory it was determined that the direction of each domain was random although the magnetic moments can show a tendency to align in specific crystallographic directions, which 31

45 Chapter 2 Principles of Magnetism became known as the easy directions of magnetisation. Although each domain exhibits uniform magnetic directionality, the individual domains themselves are separated by domain walls allowing them to point in different directions. The direction of magnetisation changes uniformly through the domain wall from one domain to its neighbour. This interaction is shown schematically in figure Figure Schematic to show the change of magnetisation direction through a domain wall between neighbouring domains. Image from Accessed 15/01/
46 Chapter 2 Principles of Magnetism 2.5 Hysteresis Loops The magnetisation exhibited by a hard or permanent magnet varies depending on the magnetic field applied to it and the direction in which the field is applied. The relationship between applied field and magnetisation in terms of polarisation (red loop) and induction (blue loop) produced is shown in the ferromagnetic hysteresis loop in figure The magnetic properties traditionally quoted are calculated from both hysteresis curves, however, the loop most commonly used and recognised is the polarisation hysteresis loop. In the hysteresis loop the origin is the point at which the material is in a demagnetised state and the ( i H c ) magnetic domains are randomly oriented, exhibiting zero net magnetisation. ((BH) max ) (B r, J r ) ( b H c ) (M s ) Figure Typical ferromagnetic hysteresis loop showing the relationship between applied field and magnetisation exhibited by a permanent magnet. Image from Accessed 15/01/
47 Chapter 2 Principles of Magnetism A magnetic field is then applied to the sample until saturation is complete in terms of both polarisation and induction which fully magnetises the sample, in this state the domains are all aligned in the direction of the applied field. The applied field is then reduced to zero and the hysteresis loop reaches the boundary between the first and second quadrant, this point is the y-intercept, also known as the remanence. The direction of magnetisation is then flipped to the opposite direction and increased to saturation. During this change in field the magnetic domains are rotated by the applied field, at a set value of applied field the domains are randomly oriented to the point where the sample exhibits zero magnetisation and the hysteresis loop will intercept the x-axis, also known as the intrinsic coercivity of the sample. This second quadrant is known as the demagnetisation quadrant, and is the part of the loop where the remanence, coercivity and maximum energy product can all be calculated. The field is continually increased until the magnetisation is saturated in the reverse direction where all the domains will be aligned in the applied field direction. This process is then repeated to complete the hysteresis loop and the applied field is reduced back to zero. The shape of the hysteresis loop, specifically the magnetisation stage and the demagnetisation quadrant differs depending on the material being tested and the direction of the applied field (i.e. easy or hard direction of magnetisation). Applying a magnetic field to a ferromagnetic material in the easy direction of magnetisation aligns the moments almost immediately to reach saturation magnetisation, whereas applying a field in the hard direction requires much larger fields to rotate the magnetic moments in the desired direction, as previously shown in figure The magnetisation stage can also be affected by the coercivity mechanism, which will be discussed later. For a perfectly square hysteresis loop: 34
48 Chapter 2 Principles of Magnetism The shape of the demagnetisation quadrant can also be affected by the direction of magnetisation. In the easy direction the polarisation exhibited remains constant until the applied field reaches the coercivity at which point the magnetic moments flip 180º, this produces a square loop as seen previously in figure (red loop). A square loop in the easy direction is the desired loop shape for a hard magnet as the magnet will produce the same magnetisation on its surroundings until a known applied field is present, so it is very predictable, a rounded or curved loop could be unpredictable when the product is in service. In the hard direction the demagnetisation loop can be seen as a shallow sloped line as different domains and moments will require different applied field to rotate the moments, so there is no squareness to the loop. Remanence The remanence of a magnet, also referred to as B r or J r is a measure of the magnetic polarisation that a magnet can exhibit without the presence of an external magnetic field. This can be measured by reading off the y-intercept from the hysteresis loop as the loop passes from the first quadrant to the second quadrant. The S.I. unit of B r is Tesla, T, however, it can also be expressed in Gauss, G, using the cgs emu system, where the conversion factor is 1 T = G. Coercivity The intrinsic coercivity of a magnet, also known as i H c, is a measure of the magnet s resistance to demagnetisation, i.e. it is the amount of external magnetic field required to reduce the polarisation of a permanent magnet to zero from saturation. This can be measured by reading off the x-intercept from the hysteresis loop as the loop passes from the second 35
49 Chapter 2 Principles of Magnetism quadrant into the third quadrant. The S.I. unit of H c is kiloamps per metre, kam -1, however, it can also be expressed in Oersteds, Oe, where the conversion factor is 1 kam -1 = 12.6 Oe. Maximum Energy Product The maximum energy product, also known as the (BH) max is a measure of the maximum amount of energy that can be supplied by a magnet of a finite size to an external magnetic circuit, i.e. the amount of useful work that can be done. This is the principle characteristic used for comparing magnets with one another, with the higher the maximum energy product, the more useful work a magnet can do and therefore the better the magnet is. This can be measured by creating the largest square possible in the demagnetisation quadrant of the magnetic induction hysteresis loop as shown in figure Figure a) Magnetisation hysteresis loop and b) Induction hysteresis loop showing the square used to calculate (BH) max. Image from Accessed 02/08/2013. The S.I. unit of (BH) max is kilojoules per metre cubed, kj m -3, however, it can also be quoted in megagauss Oersteds, MGOe using the cgs emu system, where the conversion factor is 1 kj/m 3 = MGOe. The unit conversions were taken from accessed 14/02/
50 Chapter 2 Principles of Magnetism 2.6 Coercivity Mechanisms Depending on the type and composition of the magnet, the mechanism in which coercivity is produced can vary vastly. Each type of mechanism has differing effects on the maximum potential value of coercivity for the magnet. There are three main types of coercivity mechanism, which are described below. One magnet however, does not necessarily have one mechanism that controls the coercivity; hence a mixture of mechanisms can be applied depending on the sample s microstructure. In some cases it is possible to identify the main coercivity mechanism in place for each magnet by the initial magnetisation curve in the hysteresis loop as the magnetic domains will react differently under varying applied magnetic fields in order to align in the direction of the applied field. This can be observed schematically in figure Nucleation Nucleation control mechanism of coercivity utilises the ability of a magnetic material to prevent the nucleation of reverse domains when a demagnetising field is applied. These reverse domains can nucleate at triple points and defects in the magnet microstructure and have their magnetisation facing antiparallel to the direction of the domain onto which it has nucleated, effectively diluting the overall magnetisation in the initial direction. These reverse domains can then grow at their will and engulf the initial domain, leading to demagnetisation of the material. Materials such as sintered NdFeB contain a Nd-rich grain boundary phase which smoothes triple points and prevents the nucleation of reverse domains. The initial magnetisation of magnets with this type of coercivity mechanism is rapid as there is no hindrance to domain growth. 37
51 Chapter 2 Principles of Magnetism Domain Wall Pinning Domain wall pinning utilises the ability of defects such as dislocations to prevent the movement of domain walls and also prevent the growth of any reverse domains that nucleate with the application of a demagnetising field. The hindrance to domain growth and movement prevents the reverse domains from engulfing the original magnetic domains to prevent demagnetisation. The initial magnetisation of domain wall pinning type materials is very slow as it requires a high field to overcome the pinning of domain walls. The initial magnetisation quadrant of the hysteresis loops for nucleation controlled and pinning controlled coercivity mechanisms can be observed below in figure Figure First quadrant magnetisation curves for magnetic materials exhibiting nucleation-type and pinning-type coercivity mechanisms. [Walton Undergraduate Lecture (2013)] Single Domain Particle There is a compromise between reduction of internal system energy by division of large domains and the increase in system energy related to the introduction of domain walls. 38
52 Chapter 2 Principles of Magnetism As particle size decreases there is a critical size below which it becomes energetically unfavourable for the introduction of a domain wall caused by domain division. For the single domain particle mechanism of coercivity to be applicable the particle size must be less than this critical size. The critical size is dependent on the specific material, for example 0.3 µm for NdFeB. In this mechanism the individual domains resist the demagnetising fields from flipping or rotating the domains in the direction of the applied field, each domain will have to rotate or flip to demagnetise the material. In the initial magnetisation it is very slow as high energy is required to flip and rotate the domains. Table 2.1. Table of Units Quantity Symbol S.I. Units Cgs. Units Conversion (cgs/s.i.) Magnetic Flux F Weber (Wb) Maxwell (Mx) 10-8 Magnetic Induction B Tesla (T) Gauss (G) 10-4 Magnetic Field H Amps/metre (A m -1 ) Oersted (Oe) 10 3 / 4π Magnetic Moment m Wb m Wb m 4π x10-10 Magnetisation M A m -1 G 10 3 Polarisation J T G 4π x10-4 Energy Product (BH) max kj m -3 MG Oe 100 / 4π 39

![(1984)] who were responsible for the production of NdFeB in the form of fully dense sintered magnets, and General Motors [Croat et al.](/docs-images/72/66468248/images/53-1.jpg "(1984)] who produced the material by melt-spinning, which led to nanocrystalline ribbons suitable for bonded magnets and hot-pressed")
53 Chapter 3 Literature Review Chapter 3 LITERATURE REVIEW 3.1 Neodymium Iron Boron Magnets NdFeB-type magnets were simultaneously discovered in 1984 by Sumitomo Special Metals [Sagawa et al. (1984)] who were responsible for the production of NdFeB in the form of fully dense sintered magnets, and General Motors [Croat et al. (1984)] who produced the material by melt-spinning, which led to nanocrystalline ribbons suitable for bonded magnets and hot-pressed magnets. Figure The tetragonal crystal structure of Nd 2 Fe 14 B [Herbst et al. (1984)] 40
54 Chapter 3 Literature Review Commercially available Neodymium Iron Boron (NdFeB) type magnets of Neomax composition (Nd 15 Fe 77 B 8 ) are rare-earth permanent magnets containing three different phases: the hard magnetic Nd 2 Fe 14 B phase (matrix phase), a Nd-rich grain boundary phase that smoothes the surface of the matrix grains and aids with liquid-phase sintering, and finally, a NdFe 4 B 4 boride phase which pins grain boundaries and grain junctions [Schneider et al. (1986)]. The tetragonal structure of the Nd 2 Fe 14 B phase exhibits excellent magnetocrystalline anisotropy, leading to the potential for high coercivity and hence strongly resisting demagnetisation. The crystal structure of Nd 2 Fe 14 B is shown in figure
55 Chapter 3 Literature Review 3.2 Production of NdFeB There are many production routes that can be used to produce NdFeB magnets, depending on the required microstructure, magnetic properties and intended application of the magnet. The main processing routes for producing the final magnet include sintering, hydrogenation disproportionation desorption and recombination (HDDR) and melt spinning. Both sintered and HDDR processed NdFeB magnets are traditionally made from a cast NdFeB alloy. Book mould casting and strip casting There are two methods for producing cast NdFeB material; book mould and strip cast, both of which are performed under an inert atmosphere to prevent oxidation of the melt during the casting process. Book mould casting involves melting of the individual constituent elements or alloys such as neodymium and ferro-boron in a furnace, pouring into a mould and cooling to form an ingot. This method has the disadvantage that free-iron is precipitated on casting [Bernardi (1998)], which affects the crushability of the ingot and hence reduces the ease of processing. It also produces relatively coarse grained material (~300 µm). This freeiron containing ingot can however undergo a standard homogenisation treatment at temperatures around 1000 ºC for many hours or cyclical homogenisation at higher temperatures for shorter time periods to remove the free iron [Zhang et al. (1995)]. However a Nd-rich composition is required to react with the iron during homogenisation. The free iron forms during solidification due to a peritectic reaction which can be clearly observed in the isopleth in figure The microstructure of book mould NdFeB can be observed in figure 3.2.2a below. 42
] Alternatively the elements and alloys can be melted in an induction furnace and poured through a series of ceramic tundishes onto a water cooled copper wheel which cools the")
56 Chapter 3 Literature Review Figure Nd-Fe-B isopleth showing the formation of free-iron upon solidification during the casting process. [Jinghua et al (1987)] Alternatively the elements and alloys can be melted in an induction furnace and poured through a series of ceramic tundishes onto a water cooled copper wheel which cools the material at 10 4 K s -1 in a process called strip casting. During strip casting the NdFeB solidifies into flakes containing homogenous fine columnar grained Nd 2 Fe 14 B separated by a Nd-rich grain boundary phase. This process suppresses the formation of free iron as it does not have time to form which means that a costly homogenisation treatment is not required [Bernardi et al. (1998)]. On subsequent hydrogen processing the fine grained strip cast material breaks down into a finer powder than book mould material. The strip cast microstructure can be observed below in figure 3.2.2b. 43
. Pei et al. (2002) compared the sintering process with regards to using conventional cast and strip cast starting materials.")
57 Chapter 3 Literature Review Figure Backscattered SEM images of a) book mould cast NdFeB and b) strip cast NdFeB. Image from Pei et al. (2002). Pei et al. (2002) compared the sintering process with regards to using conventional cast and strip cast starting materials. It was found that the strip cast powder had a small mean particle size (~3μm) and homogenised microstructure with a high density of 7.56 g cm -3, and improved coercivity, remanence and maximum energy product compared to that of the magnet formed from conventional cast NdFeB. 44
58 Chapter 3 Literature Review Hydrogen Decrepitation Hydrogen decrepitation (HD) is a process that was initially designed and patented by Harris et al. (1979) as a means of breaking down SmCo 5 and Sm 2 (Co,Fe,Cu,Zr) 17 alloys. The HD process was modified by Harris et al. (1985) to decrepitate the newly developed NdFeBtype alloys. During the HD process NdFeB alloys are typically exposed to H 2 at 1 bar pressure at room temperature. In this reaction the hydrogen is absorbed preferentially by the Nd-rich grain boundary phase forming neodymium hydride (NdH 2.7 ) [Moosa & Nutting (1988)] and then absorbed into the matrix phase forming a Nd 2 Fe 14 B-hydride [Williams et al. (1991), Book and Harris (1995)]. The hydrogenation process results in a 5% volume expansion, resulting in intergranular and transgranular cracking which causes the brittle material to break into pieces, which is accompanied by a characteristic popping sound [Saje et al. (1992), Yartys et al. (1996)]. This expansion takes place throughout the whole magnet, forcing it to decrepitate and to form a hydrogenated alloy powder. McGuiness et al. (1994) studied the effect of the HD process on isotropic and anisotropic sintered magnets which showed that anisotropic magnets absorb preferentially from their poles, hence decrepitation works its way from the ends of the magnets to the middle, whereas isotropic magnets absorb hydrogen from all surfaces towards the middle of the bulk. The hydrided samples contain neodymium hydride in the form of ~neodymium trihydride (NdH 2.7 ), which is unstable in air and reacts to form neodymium hydroxide. It is possible to desorb hydrogen from neodymium trihydride by heating above 250 ºC to form neodymium dihydride, which increases the stability of the sample in air [Nakagawa & Onitsuka (1990), Verdier et al. (1994)]. The desorption behaviour of the hydrogen in the above reactions was further investigated by Yartys et al. (1997) where it was shown that upon 45
59 Partial Pressure (arbitary units) Chapter 3 Literature Review heating, the neodymium trihydride decomposed to neodymium dihydride at ºC and was completed at 450 ºC. The second desorption reaction of neodymium dihydride to neodymium started at 550 ºC, peaked at 720 ºC and finished at 800 ºC. A desorption trace of HD-treated Nd 15.5 Fe 77.5 B 7 is shown below in figure It can be observed that the initial peak associated with the desorption of hydrogen from the Nd 2 Fe 14 B matrix phase and the decomposition of neodymium trihydride to neodymium dihydride is a two stage process as there is a shoulder at ~200 ºC [Williams et al. (1991)]. The second, narrow peak demonstrates complete desorption of hydrogen from NdH 2 to Nd. Nd 2 Fe 14 B 3000 Nd Fe B Nd H 3 to NdH 2 NdH 2 to Nd Temperature ( C) Figure Desorption trace for an Nd 15.5 Fe 77.5 B 7 alloy with three distinct desorption characteristics [Williams et al (1991)]. The hydrogen decrepitation process can be performed on NdFeB-type magnets at room temperature providing there is a Nd-rich grain boundary phase as in Nd 16 Fe 76 B 8 alloys. However single-phase stoichiometric Nd 2 Fe 14 B can be decrepitated at pressures of 50 atm (~50 bar) [Oesterreicher and Oesterreicher (1984)] or at elevated temperatures ~160⁰C [Harris et al. (1987)]. Above 150 ºC the hydrogen simultaneously absorbs into the Nd-rich phase and 46
60 Chapter 3 Literature Review the Nd 2 Fe 14 B phase which increases the rate of reaction. The resulting powder must be handled in an inert atmosphere e.g. under argon, due to its high reactivity with oxygen. After HD processing the intrinsic coercivity is reduced, therefore it needs to undergo further processing, such as sintering or HDDR to regain its magnetic properties, although it is still capable of c-axis alignment [Harris & McGuiness (1991)]. Wiesinger et al. (1987) suggest that the (BH) max is significantly reduced by the presence of hydrogen in the material and so a heat treatment is required to remove the hydrogen and to regain the magnetic properties. Rupp et al. (1988) proposed The hydrided powders should be milled, aligned and sintered under vacuum in order to completely desorb the hydrogen from the material, which has been clarified by Williams et al. (1991). It was found by Moosa et al. (1990) that the HD process differed from the conventional technique for magnet manufacture by separating the Nd-rich phase from the matrix phase, whereas the conventional method simply crushes the as-cast alloy in a hydraulic mill under cyclohexane leaving Nd-rich particles within the matrix phase and yields lower magnetic properties. The incubation or initiation period for the HD process to occur (time taken for hydrogen to penetrate the thin oxide layer on the sample surface) is strongly affected by process temperature as well the time the sample has been exposed to atmospheric conditions [Saje et al. (1992)]. 47


61 Chapter 3 Literature Review Sintered NdFeB To produce a sintered NdFeB magnet from a cast ingot there are many important steps that need to be followed, which can be seen in the schematic in figure The first step is to expose the cast ingot to hydrogen to initiate the hydrogen decrepitation reaction described previously. The particle size of HD powder however is too large for use in sintered magnets in its current form so it is jet milled to produce a fine powder by firing the particles at each other using jets of nitrogen gas in a sealed vessel. This milled powder is then aligned and pressed in the presence of a magnetic field to produce green compacts with a density of around 60% of the finished product. Figure Schematic showing the steps required to produce a sintered magnet. Image from Accessed 18/01/2014 This green compact is then transferred inertly into a vacuum furnace and sintered at temperatures around ºC for one hour [McGuiness et al. (1986)]. The time and 48

62 Chapter 3 Literature Review temperature of sintering are crucial in determining the microstructure and hence magnetic properties of the final product. The microstructure of a typical sintered NdFeB-type magnet is shown below in figure 3.2.5, where it is possible to observe an Nd 2 Fe 14 B grain structure with Nd-rich phase at grain boundaries and triple points along with small angular regions of Nd 1 Fe 4 B 4. The temperature must be high enough to allow liquid phase sintering by melting of the Nd-rich phase which in turn increases density. The hold time will affect grain growth during the sintering process. The Nd-rich phase undergoes a transformation from a double h.c.p structure in the green compact to an f.c.c. phase in the sintered magnet due to oxygen entering the system and changing it from a ternary to a quarternary system. The f.c.c. phase absorbs the oxygen, which then acts as a sintering aid at high temperatures by forming a second liquid phase [Weizhong et al. (1988)]. Davies et al. (2001) showed that by increasing the processing temperature the density of the sintered magnet increases, with 98% of the theoretical density being achieved when sintered at 1100 ºC. Figure Backscattered SEM micrograph of a typical NdFeB-type sintered microstructure with Nd 2 Fe 14 B grains surrounded by Nd-rich grain boundary phase and small angular regions of Nd 1 Fe 4 B. [Zakotnik et al. (2008)]. 49
63 Chapter 3 Literature Review A small grain size (<10 µm) will encourage growth of a finer network of Nd-rich grain boundary phase which will prevent the movement of domain walls, hence increasing coercivity. For this reason the hold time must be as short as possible, however it needs to be long enough to allow the Nd-rich phase to surround the grains and reach full density. McGuiness & Harris (1988) and then McGuinness et al. (1989) found that sintering between 980 ºC-1040 ºC produced high coercivity magnets, however higher temperatures resulted in excessive grain growth and hence lower coercivity values. Sintering can be followed by an annealing heat treatment stage that can be used to increase the quantity of the hard magnetic Nd 2 Fe 14 B phase by reacting excess iron with the Nd-rich phase and contained borides by holding at temperatures of ºC for one hour under vacuum or a helium atmosphere [Holc et al. (1990)], thus improving the magnetic properties of the sample. More recently, Kim et al. (2012) trialled the use of cyclic sintering in an attempt to increase the magnetic properties of sintered Nd 13 Dy 2 Fe 79 B 6 alloys. The authors presented the effect of thermal expansion that occurs during cyclically sintering where the samples were heated and cooled from 950 ºC to 1050 ºC cyclic forming a Nd-rich phase at triple points that contained Nd 2 O 3 and grain boundaries consisting of an amorphous Nd-rich phase. It was found that the Nd 2 O 3 contributed to an increase in coercivity and the amorphous Nd-rich phase gives high coercivity and increases thermal stability, thus, cyclic sintering is an effective route for processing NdFeB. The NdFeB magnets with the highest magnetic properties are fully dense anisotropic sintered NdFeB, boasting coercivity values >2000 kam -1, remanence values >1.4 T and maximum energy products >450 kjm -3 [Sugimoto (2011)]. 50

64 Chapter 3 Literature Review Corrosion of sintered NdFeB After sintering is complete the magnets are sliced and ground to the desired shape and size as the sintering process is not a net-shape manufacturing process. This form of NdFeB is highly susceptible to corrosion, hence the magnets require a coating such as electroplated nickel, a triple layer nickel-copper-nickel or an epoxy resin-based coating. The most common coating is a single layer of electroplated nickel, which is used extensively on magnets used in electronics. Figure shows how a sintered magnet can corrode when left in open air for a prolonged period of time, emphasising the need for a protective coating. There are two commonly used protective coatings for NdFeB magnets in electronic materials, these are electroplated nickel and a triple layered nickel-copper-nickel, the cross-sections of which are shown in figure Once coated, the magnets are pulse magnetised in the preferred direction of magnetisation using a high (> 6 T) field and tested for final magnetic properties. Figure Corroded uncoated NdFeB magnet exposed to air for prolonged period of time 51
 electroplated nickel coating and b)")
65 Chapter 3 Literature Review Figure Cross section images of of NdFeB with a) electroplated nickel coating and b) nickel-copper-nickel triple layered coating. [Walton (2012)] 52
.")
66 Chapter 3 Literature Review Curie temperature and additions The applications for NdFeB magnets are limited by a relatively low Curie temperature (320 ºC) in comparison to SmCo magnets (800 ºC). The effect of increasing temperature on the remanence and coercivity of sintered magnets was studied using a field mapping system and a heat stage by Williams et al. (2002). It was found that as the temperature was increased, the coercivity decreased, however the rate of decrease was higher at the centre of the samples than around the edges, which could be due to inhomogeneities within the sample. This is shown in figure below, where at 90 ºC the z component of magnetic field is much lower in the centre of the magnet than at the edges, and at 150 ºC shows very little magnetisation throughout the whole sample. Figure Effect of temperature on the magnetisation exhibited by NdFeB magnets after treatment at a) 90 ºC and b) 150 ºC using a field mapping system. [Williams et al. (2002)] 53
67 Chapter 3 Literature Review The Curie temperature, T c, can be improved by substituting some of the Fe with Co which has a higher T c and substituting some of the Nd with Dy increases the coercivity of the magnet by increasing the anisotropy energy of the sample [Tenaud et al. (1991)]. There are two major downsides to using Dy however, one of which is that the magnetic moment of Dy couples antiparallel to that of Fe in NdFeB alloys, leading to a reduction of remanence and maximum energy product. Secondly Dy is a very expensive metal which is much lower in abundance than Nd and is at much higher risk of supply due to the so-called rare-earth crisis. To reduce the dependence on Dy, hence lowering costs, cheaper alloying additions have been investigated for use in sintered NdFeB. Kim (1988) investigated the effect of using Dy and Al simultaneously to improve the magnetic properties. In this paper the author found that using equal atomic amounts of Dy and Al provides superior magnetic properties compared to samples containing similar amounts of only Dy or Al. These Dy and Al containing alloys had a much higher coercivity than the single addition samples and the reduction of remanence associated with these additions was markedly less resulting in excellent hysteresis loop squareness. Beseničar et al. (1992) studied the influence of ZrO 2 as a potential replacement for Dy by adding 1 wt% ZrO 2 in place of 1 wt% Dy. The ZrO 2 formed a lamellar structure within the existing microstructure which prevented grain growth and subsequently increased the coercivity of the sample, even with a lower Dy content. 54

68 Chapter 3 Literature Review Melt Spinning of NdFeB Melt-spinning of NdFeB alloys was originally adopted by Croat et al. (1984). In this process cast alloy ingots or individual constituents are melted in an induction furnace before being fired at a water-cooled copper wheel using high argon pressure to produce a very fine ribbon [Liebermann & Graham (1976)] as shown schematically in figure Figure Schematic showing the melt spinning process used to produce fine isotropic NdFeB powder. Image from: Accessed 02/08/2013 This ribbon is then milled into isotropic powder for use in the production of bonded or hot pressed and die-upset magnets, the microstructure of which is shown in figure , where the grain size is around 50 nm in diameter. These ribbons are isotropic due to the incredibly rapid solidification not allowing for time for the grain to grow in a particular direction or orientation. This process differs from the strip cast method which is a similar design in that the melt is pressurised through a specially designed nozzle using high pressure argon and the cooling rate is much higher (10 6 K s -1 ) by using a greatly increased wheel speed 55
![Chapter 3 Literature Review [Liebermann & Graham (1976)]. The nozzle is designed to produce a ribbon of a specific thickness and also aids the pressurising of the melt.](/docs-images/72/66468248/images/69-0.jpg "The desired wheel speed for melt spinning is an order of magnitude faster than that of strip casting (2-3 ms -1 ), where wheel speeds of 20-30 ms -1 are not uncommon.")
69 Chapter 3 Literature Review [Liebermann & Graham (1976)]. The nozzle is designed to produce a ribbon of a specific thickness and also aids the pressurising of the melt. The desired wheel speed for melt spinning is an order of magnitude faster than that of strip casting (2-3 ms -1 ), where wheel speeds of ms -1 are not uncommon. With these rapid cooling rates it is possible to make amorphous or nanocrystalline microstructures, the latter of which uses the single grain domain mechanism of coercivity. Figure TEM micrograph of 50 nm Nd 2 Fe 14 B grains in a melt spun ribbon. [Hua et al. (1988)] Early work by Hua et al. (1988) using wheels speeds of approximately 24 ms -1 on Nd 13.5 Fe B 4.76 alloys suggested that by using high resolution electron microscopy it could be seen that the resultant ribbon consisted solely of near-perfect Nd 2 Fe 14 B with no intergranular phases. Ahmad et al. (1996) however used a constant wheel speed of 20 ms -1 to investigate the effect of neodymium content on the magnetic properties of NdFeB powders 56
70 Chapter 3 Literature Review produced using the melt spinning technique. It was discovered that as the Nd content increased from at% there was a significant increase in coercivity with a corresponding decrease in remanence, as the Nd content increased from at% the increase in coercivity and reduction of remanence were much less significant. These changes in magnetic properties are attributed to the increasing volume fraction of paramagnetic Nd-rich phase around the Nd 2 Fe 14 B matrix phase, which is well known to increase intrinsic coercivity of NdFeB magnets and is shown in figure below. Figure Variation of magnetic properties associated with increasing Nd content in melt spun NdFeB ribbons with a wheel speed of 20 m s -1. [Ahmad et al. (1996)] 57
71 Chapter 3 Literature Review Hydrogenation Disproportionation Desorption and Recombination of NdFeB Hydrogenation Disproportionation Desorption and Recombination is a process that utilises the ability of NdFeB to absorb and desorb hydrogen readily at elevated temperatures, which was discovered by Takeshita and Nakayama (1989). The main aim of HDDR is to create a fine microstructured, highly coercive powder for use in the production of bonded magnets, the current major manufacturer of which is Aichi Steel, Japan. HDDR can be described by the reversible reaction shown in equation 1 below, followed by figure , the schematic of the HDDR reaction as originally proposed by Takeshita and Nakayama (1989). The left hand side of the schematic represents the hydrogenation and disproportionation part of the reaction, and the right hand side representing the desorption and recombination part of the reaction. Where x approaches 1.0 at elevated temperatures [Equation 1] 58
72 Chapter 3 Literature Review Figure Schematic to show the original HDDR reaction as proposed by Takeshita and Nakayama (1989). The HDDR process is typically used to convert the coarse grained structure of a cast ingot into a fine grained structure as shown below in the HDDR schematic, figure This shows the step by step alteration of the structure of the material throughout the reaction; starting with the cast ingot containing multiple Nd 2 Fe 14 B grains (~300 µm in size) separated by an Nd-rich grain boundary phase. Hydrogenation of the Nd-rich phase is followed by hydrogenation of the matrix phase which leads to disproportionation. The Nd 2 Fe 14 B then dissociates into NdH 2 and Fe 2 B in an α-fe matrix. Reversing the reaction leads to recombination of fine Nd 2 Fe 14 B grains separated by redistributed NdH 2 from the grain boundary phase. The hydrogen is then desorbed from the grain boundary phase, leading to a microstructure consisting of matrix phase grains ~0.3 µm surrounded by a fine network of Nd-rich phase. There have been many amendments to the HDDR process since its discovery, which will be discussed in more detail throughout the sections below. 59

73 Chapter 3 Literature Review Figure Schematic showing the change in microstructure of the NdFeB magnet during each of the stages of the HDDR process from cast ingot to recombined powder. [Harris et al. (1995)] Figure SEM micrograph of NdFeB HDDR processed at 850 ºC. [Kawashita et al. (2003)] 60

74 Chapter 3 Literature Review Disproportionation Reaction During the disproportionation reaction, the sample is exposed to hydrogen gas at atmospheric pressure at room temperature and heated to temperatures between ºC and typically held for up to 3 hours. At this temperature the Nd 2 Fe 14 B breaks down and forms a mixture of neodymium hydride, iron and ferroboron. A high resolution SEM micrograph of which is shown in figure It was shown that the neodymium from the grain boundaries in the cast material reacts with the matrix phase during the disproportionation stage; evidence of this is labelled as D in the micrograph [Gutfleisch et al. (1994)]. Figure The fully disproportionated mixture consisting of A) neodymium hydride, B) Fe 2 B and C) α-fe. Also visible are D) white lines of NdH 2 extending from E) Nd-rich grain boundary phase. [Gutfleisch et al. (1994)] The process of hydrogen absorption during disproportionation was investigated by Cadogan and Coey (1985) by exposing cast Nd 15 Fe 77 B 8 samples to hydrogen through a range of pressures and temperatures. It was shown that hydrogen is absorbed by the Nd-rich and Nd 2 Fe 14 B phases to cause decrepitation between ⁰C, followed by degassing and a 61
. Gutfleisch et al.")
75 Chapter 3 Literature Review further hydrogen absorption associated with disproportionation above 720 ºC. The system was then opened to vacuum during cooling and it was shown that hydrogen desorption occurs around 650 ºC and below 300 ºC, which was later confirmed by Bulyk et al. (2004). Gutfleisch et al. (1994) and then Book and Harris (1995) showed in cast Nd 16 Fe 76 B 8 alloys that the hydrogen absorbs initially along the grain boundaries and then into the Nd 2 Fe 14 B bulk, which suggests that the grain boundaries act as hydrogen diffusion pathways during disproportionation. The disproportionation stage of the reaction dissociates the Nd 2 Fe 14 B into its constituents to leave the particle as a mixture of neodymium-hydride rods and ferro-boride embedded in an α-fe matrix [Gutfleisch et al. (1995)]. The material is held in this state for a specified period until full disproportionation is complete [Gutfleisch et al. (2000), Gutfleisch et al. (2002)]. The fully disproportionated structure is shown in a high resolution image, figure , where the white NdH 2 rods are clearly visible in a matrix of grey α-fe along with finely dispersed black Fe 2 B regions. Figure High Resolution SEM image of the disproportionated structure clearly showing A) NdH 2 rods, B) α-fe matrix and C) Fe 2 B. [Gutfleisch et al. (2000)]. 62

76 Chapter 3 Literature Review There are two methods of disproportionation for HDDR processing, the conventional HDDR route (c-hddr) and the vacuum HDDR route (v-hddr) which are shown in figure below. The c-hddr route starts with the sample under a partial pressure of hydrogen and is then heated to temperatures up to 990⁰C to encourage the disproportionation reaction, whereas the v-hddr route heats the sample under vacuum to the desired processing temperature and then hydrogen is introduced to encourage disproportionation. It can be observed from figure that the disproportionated microstructure differs between the two disproportionation routes, where the c-hd results in spherical NdH 2 embedded in α-fe, and the v-hd route results in course and fine lamellae. Figure Schematic showing the difference between c-hd and v-hd disproportionation routes for use in the HDDR process. [Sugimoto et al. (1999)] 63
77 Chapter 3 Literature Review Recombination The desorption recombination stage then recombines the constituents to form the ultrafine Nd 2 Fe 14 B grains with an approximate size of 0.3μm diameter in two main steps. Firstly the NdH ~2.2 desorbs to form Nd as the pressure in the system is reduced, the Nd then recombines with the iron and ferro-boron to form the thermodynamically stable Nd 2 Fe 14 B phase. These two recombination steps were identified by Gutfleisch et al. (1993) using electrical resistivity measurements as shown in figure below, where the first reaction results in a drop in resistivity (f) and the second, the recombination of the constituents vastly increases the resistivity of the sample. Once recombination is complete, the furnace tube is quenched in air which prevents excessive grain growth of the Nd 2 Fe 14 B to maintain the fine grain structure. The coarse grains in the original structure are large and contain multiple magnetic domains; however the fine grains are thought to be single domain due to their submicron size [Ragg et al. (1997)]. It is the vast change in microstructure that is accredited to the increased magnetic properties from the cast magnet block to the fine HDDR powder. 64
78 Chapter 3 Literature Review Figure Change in electrical resistivity associated with every step during the HDDR reaction. The recombination stage showing two clear reactions, f and g. [Gutfleisch et al. (1993)] Sugimoto et al. (1999) described two separate desorption recombination reactions. The first being a conventional recombination reaction (c-dr) where the hydrogen pressure was maintained until recombination was complete before evacuation of the reaction vessel. The second type is a slow desorption recombination (s-dr) reaction. In the s-dr reaction the sample is flushed with argon before evacuation which causes much slower evacuation rates than the c-dr reaction. When running this s-dr recombination process with the vacuum hydrogenation disproportionation (v-hd) greatly enhanced remanence was achieved at a recombination time of 20 minutes at 950 ºC. The remanence was 1.4 T, which shows the s- DR process produces highly anisotropic NdFeB powder; however the coercivity was sacrificed. A schematic showing the effect of recombination reaction on the orientation of recombined Nd 2 Fe 14 B grains is shown in figure It can be observed that the s-dr 65
79 Chapter 3 Literature Review reaction results in oriented hard magnetic grains, allowing for anisotropic magnetic properties whereas c-dr results in misorientation of these grains, leading to reduced magnetic properties. Figure Schematic to show the effect of the two different types of recombination reaction on the orientation of the recombined hard magnetic Nd 2 Fe 14 B grains [Sugimoto et al. (1999)]. 66

80 Chapter 3 Literature Review Isotropic / Anisotropic HDDR Initial work on HDDR processing of NdFeB led to isotropic powder for use in bonded magnets. The HDDR reaction has been studied in vast detail to improve the understanding of the kinetics of the process, leading to specific changes to the process that encourage the development of anisotropy. The actual source of anisotropy in HDDR processing for NdFeB magnets has however long been debated, early work proposed that a combination of the α-fe and NdH 2 rods were responsible for nucleating the tetragonal Nd 2 Fe 14 B hard magnetic grains. This is in stark contrast to work on the anisotropy of NdFeB during HDDR by Choi et al. (1995) & Tomida et al. (1996) who determined that fine regions (~50 nm) of Nd 2 Fe 14 B fail to decompose during disproportionation and it is these areas that retain the tetragonal form and hence nucleate new tetragonal Nd 2 Fe 14 B grains upon recombination, shown schematically in figure Figure Schematic showing the undecomposed Nd 2 Fe 14 B retaining the anisotropy during the HDDR process [Choi et al. (1995)] 67
 in figure 3.2.21. This phenomenon has been termed the texture memory effect (TME). Gutfleisch et al.")
81 Chapter 3 Literature Review The most recent suggestion is that the ferro-boron phase retains the tetragonal structure of the Nd 2 Fe 14 B phase and act as nucleation sites for the new Nd 2 Fe 14 B nuclei to be formed as shown schematically by Honkura et al. (2005) in figure This phenomenon has been termed the texture memory effect (TME). Gutfleisch et al. (2002) produced TEM samples of fully disproportionated material allowing for clear identification of each phase present, this is shown in figure It can be observed that there is clear alignment in the Fe 2 B regions, which is thought to provide the texture described above. The inducement of anisotropy within HDDR treated NdFeB has allowed for higher remanence in aligned resin bonded magnets, increasing potential range of applications for these materials. Figure Schematic showing the ability of the Fe 2 B to retain the tetragonal texture during disproportionation and recombination [Honkura et al. (2005)] 68
] Gutfleisch et al.")
82 Chapter 3 Literature Review Figure Bright field (left) and dark field (right) TEM images showing alignment of Fe 2 B grains within the disproportionated mixture in an Nd 12.5 Fe bal Ga 0.3 Nb 0.3 B 6.3 alloy. [Gutfleisch et al. (2002)] Gutfleisch et al. (1999) performed the conventional HDDR reaction on two ternary NdFeB alloys and an NdFeCoGaB alloy, producing isotropic powders in the two ternary alloys and anisotropic powder for the sample containing Co and Ga. It was found by x-ray diffraction (XRD) that the a coexistence of the disproportionated structure and nano-scale Nd 2 (Fe,Co,Ga) 14 B grains was not possible and that the rod-like structure of the disproportionated phase resulted in highly anisotropic material. The authors modified the HDDR process by heating in vacuum to 900 ºC then introducing 0.8 bar hydrogen for 30 minutes to encourage solid-disproportionation as in the v-hddr processing route before reducing the pressure to 0.1 bar and held for 30 minutes to encourage recombination. These processing conditions produced anisotropic powder from both ternary alloys with good magnetic properties, whereas the NdFeCoGaB alloy had reduced coercivity compared to the c-hddr processing route. Further examination of the disproportionation stage for all materials and processes in this work concluded that a rod-like disproportionated structure of NdH 2 is vital for the inducement of magnetic anisotropy. 69

83 Chapter 3 Literature Review HDDR Processing Parameters To achieve optimal magnetic properties requires careful control over the processing conditions and parameters. The main variables are temperature, pressure and time, which can be observed in the standard HDDR processing schematic, as shown in figure Figure A typical HDDR schematic, showing the main variables as temperature, time and pressure Many workers have investigated the variation of magnetic properties with each of the variables in all stages of the process in order to optimise the performance of the final product. Rybalka et al. (2003) determined that although hydrogen pressure is important for the conventional HDDR reaction, the kinetic controlling factor is the processing temperature. Kwon and Kim (2006) discovered that there was a trade-off between certain properties, such as anisotropic alignment and coercivity as a result of processing conditions. They found that low disproportionation pressure produced a low coercivity due to possible nondisproportionated regions; however these particles still had high anisotropy, whereas a high 70
 where samples treated with a hydrogen pressure of 0.")
84 Chapter 3 Literature Review disproportionation pressure gave improved coercivity but poor alignment. This was later shown using electron backscatter diffraction (EBSD) techniques by Güth et al. (2011) where samples treated with a hydrogen pressure of 0.3 bar showed low angular deviation from the normal plane with good anisotropic magnetic properties, whereas samples treated with a hydrogen pressure of 1.0 bar exhibited large angular deviation, hence very poor anisotropy, as shown in figure Figure EBSD mapping of {001}, {100} and {111} pole figures showing local texture in HDDR processed NdFeB powder particles at various pressures: (a) biaxial texture at a hydrogen pressure of 0.3 bar; (b) weak biaxial texture at a hydrogen pressure of 0.5 bar; (c) no texture at a hydrogen pressure of 1.0 bar. The colour scale is in multiples of uniform (pole) density (m.u.d.). [Guth et al. (2011)]. Didus et al. (2003) studied the effects of pressure and temperature on the c-hddr reaction as shown in figure This work showed that increasing processing temperature sped up the disproportionation reaction from 360 minutes at 670 ºC to 90 minutes at 750 ºC. Varying processing pressure produced differing levels of disproportionation completion such 71
85 Chapter 3 Literature Review that holding at 1 bar for 360 minutes at 670 ºC achieved 62 % transformation, whereas increasing the pressure to 3 bar allowed full transformation within 320 minutes. Gao et al. (1997) investigated the recombination pressure during c-hddr and determined that lower recombination pressures increase the coercivity of the sample however they reduce the anisotropy to a point where the sample is almost isotropic, and higher recombination pressures give good anisotropy but poor coercivity. Figure Isothermal kinetic diagrams to show levels of completion of the disproportionation stage in NdFeB at different processing temperatures: a) 670 ºC, b) 710 ºC and c) 750 ºC. [Didus et al. (2003)] 72
86 Chapter 3 Literature Review Effect of Starting Microstructure The starting microstructure of the alloy can have a large effect on the processing conditions required for HDDR processing of NdFeB alloys, for example Liu et al. (2009b) applied the s-dr reaction during the HDDR process to produce anisotropic powder directly from strip-cast flakes without a homogenisation step. In this work the authors optimised the microstructure of the strip cast flakes by adjusting the wheel speed from 2 ms -1, to 3ms -1 and then 4ms -1. A wheel speed of 2 ms -1 produced a microstructure containing α-fe as the cooling rate is too slow and resulted in uneven distribution of the Nd-rich phase, the 4 ms -1 wheel speed led to long narrow grains of Nd 2 Fe 14 B and Nd-rich lamella, whereas the 3 ms -1 wheel speed produced the optimum grain structure of uniform parallel Nd 2 Fe 14 B grains separated by evenly distributed Nd-rich phase. The HDDR process with s-dr recombination at 0.3 bar was then applied to this cast material which produced samples with 1.3 T remanence, kam -1 coercivity and 259 kjm - 3 maximum energy product, which is lower than that of homogenised strip cast starting material as shown by Morimoto et al. (2004) but higher than those previously reported by Morimoto et al. (2003) on as-cast material of the same composition. This showed that processing time, costs and energy can be reduced by avoiding the homogenisation step and still produce anisotropic powder with very respectable magnetic properties. Continued work in this area by Liu et al. (2011) showed that disproportionation time should be minimised as longer hold times reduce the degree of crystallographic alignment in the resulting sample and hence lead to reduced remanence by transforming the disproportionated structure from a lamella to a columnar microstructure, which agrees with the work by Han et al. (2004). 73
87 Chapter 3 Literature Review Effect of Nd Content Kawashita et al. (2003) investigated the role of the Nd-rich grain boundary phase throughout the HDDR process from non-homogenised as-cast alloys containing α-fe. The authors used two compositions, one containing 12.6 at% Nd and the other containing just 11.0 at% Nd. The HDDR process in this work utilised c-hd followed by the s-dr process and the 12.6 at% Nd sample was successfully processed to produce anisotropic powder with high coercivity, whereas the 11.0 at% Nd sample exhibited extremely low coercivity and did not display significant magnet properties. The hysteresis loops for this material are shown in figure In the latter sample the fully processed microstructure showed a lack of Nd-rich phase at grain boundaries and triple points as well as the presence of α-fe which is detrimental to the magnetic properties. Further analysis suggested that the mechanism for coercivity in HDDR processed material is the nucleation type where the Nd-rich regions at grain boundaries play a large role in the manifestation of coercivity. Figure Hysteresis loops parallel to and perpendicular to the easy direction of magnetisation for a sample with a Nd content of 11.0 at% (left) and a sample with Nd content of 12.6 at% (right). [Kawashita et al. (2003)]. 74
 explored the importance of the homogeneity of the cast ingot with respect to anisotropy and magnetic properties of HDDR treated magnet powders.")
88 Chapter 3 Literature Review The following year Kawashita et al. (2004) explored the importance of the homogeneity of the cast ingot with respect to anisotropy and magnetic properties of HDDR treated magnet powders. The authors found that when cast alloys were HDDR processed then the resulting material was nearly all homogenous with small regions of α-fe and Nd-rich phases. The samples produced from annealed starting material displayed a finer microstructure in the disproportionated phase with rounded pools of NdH 2 compared to the angular regions observed in the disproportionated as-cast material (non-annealed), as shown in figure Increased levels of homogeneity in the starting material yielded higher coercivity powders after HDDR processing although lower anisotropy was achieved. Figure Starting and disproportionated microstructures from as-cast and annealed alloys. A finer microstructure is visible in the disproportionated microstructure made from annealed alloy. [Kawashita et al. (2004)]. 75
89 Chapter 3 Literature Review The effect of additions on the HDDR process Some authors have investigated the effect of different alloying additions on the HDDR processing of cast NdFeB alloys and the resulting microstructure and magnetic properties. The additions in this section are all used to change the magnetic properties of samples produced by the HDDR reaction. The additions will however require different processing pressures or temperatures to encourage completion of disproportionation and recombination and/or induce anisotropy within the finished sample. Early work by Nakayama & Takeshita (1993) suggested that anisotropy could be achieved by partial substitution of Fe with Co combined with additions of Ga, Zr, Nb, Hf and Ta. Nakamura et al. (1994) found that additions of Co, Ga and Zr induced anisotropy in HDDR treated powders, however the increasing Co content was shown to speed up the recombination reaction leading to excessive grain growth which is not desirable in HDDR processed magnets. Further work by the same authors [Nakamura et al. (1995)] and Sugimoto et al. (1997) confirmed the effect of Co and also showed that Ga also speeds up the recombination reaction by lowering the optimum process temperature. Gao et al. (1999) identified that small additions of Ga can induce strong magnetic anisotropy within HDDR powders. Mishima et al. (2001) used the dynamic HDDR (d-hddr) process to interpret that addition of Ga enhances the coercivity of the resulting powder and Nb additions improve the remanence. Combined addition of Ga and Nb in NdFeB significantly improved the maximum energy product of the sample. Gutfleisch et al. (2003) also used the d-hddr process to eliminate the need for Co to induce anisotropy and proposed that Nb is useful as an addition to stabilise the boron phase during disproportionation and Ga is beneficial during the initiation of recombination. Rodriguez Torres et al. (2002) confirmed initial results by 76
90 Chapter 3 Literature Review Nakayama & Takeshita (1993) that Hf additions can also be used to induce anisotropy with the best results in terms of anisotropy, coercivity and remanence occurring at 850 ºC. Sugimoto et al. (1997) used resistivity measurements to determine the effects of Co, Ga and Zr additions on the kinetics of the HDDR phenomena. It was found that the addition of Co leads to a delay in the onset of disproportionation along with longer completion time of the reaction, which is enhanced further by Ga. The Co and Ga also have large effects on the recombination reaction, increasing the activation energy and hence rate of reaction. Kwon & Kim (2006) also sought to discover the effect of alloying additions on hydrogen pressure by HDDR treating Nd 12.6 Fe 81.4 B 6 and Nd 12.6 Fe 68.7 B 6 Co 11.0 Ga 0.1 Zr 0.1 alloys using a range of hydrogen pressures. It was found that the ternary alloy was very sensitive to hydrogen pressure in terms of producing alignment within the powder; however the isotropic magnetic properties produced were similar at a range of processing pressures. The six component alloy however was less sensitive to hydrogen pressure in terms of producing anisotropic powder, but the coercivity of the powders varied greatly with hydrogen pressure. Jurczyk (1995) produced anisotropic HDDR powders using additions of Zr, with the conclusion that samples with at least 0.3 at% (i.e. Nd 16 Fe 75.7 Zr 0.3 B 8 ) are anisotropic with an intrinsic coercivity of 971 kam -1. Additions of Co to this alloy resulted in an increase in the remanence, however it reduced the coercivity. The hysteresis loops of the NdFeCoZrB alloy are shown in figure where clear anisotropy can be identified between the perpendicular and parallel directions, plus the effect of adding Co to the sample. 77
91 Chapter 3 Literature Review Figure Hysteresis loops of NdFeCoZrB alloy parallel and perpendicular to the easy direction of magnetisation and also no orientation (left). Demagnetisation loops of a) NdFeCoZrB alloy, b) NdFeB alloy, and c) NdFeZrB alloy (right). [Jurczyk (1995)]. Gao et al. (1997) also investigated the effects of Co and Zr as additions to cast NdFeB alloys, where 0.1 at% Zr additions were shown to form a Zr-rich minor phase that does not disproportionate and results in isotropic material. However by adding Co simultaneously this was shown to suppress the effects of the Zr-rich phase and encouraged anisotropic behaviour in the resulting magnet. McGuiness et al. (1994) determined that Zr extended the temperature at which high coercivity material can be produced during recombination and that it could be used to prevent excessive grain growth during the same reaction, Sugimoto et al. (2002) showed this to be very similar in the case of Ga additions. McGuiness et al. (2001) found that <0.1 at% Zr gave the optimum benefits to processing and also found that substituting up to 75% of the Nd with Pr caused an increase in coercivity to greater than 1000 ka m -1. Bollero et al. (2001) also investigated the use of Zr along with Dy in the conventional HDDR processing of NdFeB and agreed that the grain growth was retarded by the Zr additions and the coercivity was increased by the presence of Dy, which also increased the initiation temperature of disproportionation. The Zr was found to form a lamellar ZrB 2 phase which can be clearly 78
 in the study of sintered magnets. Figure 3.2.29.")
92 Chapter 3 Literature Review observed using TEM, as shown in figure These results were similar to those found by Beseničar et al. (1992) in the study of sintered magnets. Figure TEM micrograph of a) NdFeB and b) NdDyFeBZr powders recombined at 820 ºC, displaying features of A) α-fe precipitates, B) RE 2 Fe 14 B phase, C) RE-rich phase and D) ZrB 2 lamellar phase [Bollero et al. (2001)]. Zr however, was found to increase the temperature required to complete disproportionation. Ahmed et al. (1996) investigated the effect of niobium additions on the disproportionation of near-stoichiometric NdFeB alloys. It was found that a Nb 26 Fe 32 B 42 phase precipitates throughout the disproportionated microstructure, as shown in figure , and a Nd 2 Fe 17 phase was produced which was consistent with work performed by Rodwald and Wall (1989). 79
 Nd 2 Fe 14 B phase, B) Nb 26 Fe 32 B 42 phase, C) Nd-hydride, D) α-fe or Fe 2 B, E) fine")
93 Chapter 3 Literature Review Figure High resolution image of the solid disproportionated microstructure of a NdFeBNb alloy containing A) Nd 2 Fe 14 B phase, B) Nb 26 Fe 32 B 42 phase, C) Nd-hydride, D) α-fe or Fe 2 B, E) fine disproportionated mix. [Ahmed et al. (1996)]. Matsuura et al. (1999) used X-ray absorption fine structure (XAFS) and X-ray diffraction (XRD) techniques to determine site occupancy of Zr and Ga throughout the HDDR process. It was found that Zr forms a ZrB 2 phase during homogenisation of the cast starting material and remains in this state throughout the HDDR process. This ZrB 2 phase was previously shown by Matzinger et al. (1996) to be platelet-like in form, which eliminates free iron dendrites and remains unchanged throughout the HDDR process. The Ga however occupies itself in the an Fe(c) site before recombination, α-fe region during disproportionation, before redistribution into the Nd 2 Fe 14 B and Nd-rich phases during recombination, however further work by Matsuura et al. (2006) showed that Ga actually relocates to an Fe(4c) site straight after reduction of the hydrogen pressure in the recombination stage. Sepehri-Amin et al. (2010a) showed by SEM, TEM and 3 dimensional 80
94 Chapter 3 Literature Review atom probe (3DAP) analysis that Ga additions alter the structure in the grain boundary phase from crystalline to amorphous, which increases the pinning force of this phase and subsequently increases coercivity. Chen et al. (2003) continued where Bollero et al. (2001) left off by investigating the simultaneous addition of Co and Dy in the production of isotropic bonded magnets using HDDR treated powder. They found that increasing Dy content increases coercivity up to 0.2 at% at which point it plateaus whereas remanence continues to decrease with increasing Dy content. The addition of Co increased the coercivity, however it peaks in remanence and maximum energy product at 0.1 at% with a drop either side. Sepehri-Amin et al. (2010b) employed a technique where finely crushed melt spun Nd-Cu eutectic alloys were mixed with HDDR-treated NdFeB powder. The mixture was heated to ºC to initiate the diffusion of the Nd-Cu eutectic into the NdFeB followed by further heat treatment at ºC. In this experiment it was shown that the Nd-Cu eutectic caused thickening of the grain boundary phase, as shown in figure , leading to coercivity enhancement in the sample, however the composition of this phase is very similar to the starting material as the volume fraction of Nd-Cu was consumed into triple points within the microstructure. The coercivity enhancement led to coercivity values much higher than can be achieved with Dy-free sintered magnets (1552 kam -1 compared to 1000 kam -1 respectively). Katayama et al. (2012) used the conventional HDDR processing route to discover the effect of Si, Al & Cu on the magnetic properties in Dy-free NdFeB. It was found that Si and Cu additions resulted in a drastic reduction in all magnetic properties; however Al successfully increased the coercivity with only a slight drop in remanence. This was attributed to a change in the grain boundary structure where triple point volume was decreased and the Nd-rich grain boundary phase was more pronounced in the refined grain structure. Further 81
 and Nd-Cu diffused NdFeB (right column).")
95 Chapter 3 Literature Review work showed that changing the amount of Nd and Al in the material could easily modify the magnetic properties to increase either the remanence or the coercivity. Figure TEM images of NdFeB (left column) and Nd-Cu diffused NdFeB (right column). Image d) shows an increase in grain boundary phase around the Nd 2 Fe 14 B grains from image c), plus high resolution images showing the thickening of the grain boundary phase with diffusion of Nd-Cu. [Sepehri-Amin et al. (2010b)]. The effects of all of the additives have been summarised in Table below. 82
96 Chapter 3 Literature Review Table Summary of the effect of alloying additions on the HDDR reaction with NdFeB alloys. Element Occupancy Effect of element Al Dy Co Cu (Nd-Cu eutectic) Ga Hf Nb Pr Grain boundary phase Substitute with Nd Substitute with Fe Grain boundary Triple points Fe(c) site occupancy Forms Nb 26 Fe 32 B 42 Substitute with Nd Increases wettability and thickness of Nd-rich grain boundary phase, increases coercivity Improve coercivity and temperature resistance, reduce remanence and maximum energy product Increase temperature stability, remanence, anisotropy and recombination reaction rate, reduce coercivity Thickens grain boundary phase, enhance coercivity Increase anisotropy, recombination rate. Alter g.b. phase structure to amorphous increases coercivity Induces anisotropy Stabilise boron phase during disproportionation, Increase coercivity Zr Forms ZrB 2 Induce anisotropy, reduce temperature sensitivity for processing, suppress grain growth 83
 investigated this by running the HDDR process at a range of temperatures on alloys containing 11.0 at% and 12.0 at% Nd.")

97 Chapter 3 Literature Review Coercivity Mechanisms in HDDR Many people have studied the coercivity mechanism of HDDR processed NdFeB and attempted to link this to the microstructure, but the results are often inconclusive. Kawashita et al. (2003) investigated this by running the HDDR process at a range of temperatures on alloys containing 11.0 at% and 12.0 at% Nd. It was found that the alloy containing 11.0 at% Nd led to a powder that showed little to no coercivity, as was shown in figure Further analysis of the microstructure showed that the 11.0 at% Nd powder contained virtually no Ndrich grain boundary phase compared to a very large proportion in the 12.6 at% Nd sample, which is shown below in figure It was also found using XRD and SEM analysis that there was a large presence of free iron in the 11.0 at% HDDR-processed sample which would also explain the lack of coercivity. From this it was concluded that the coercivity mechanism is nucleation controlled during the growth of Nd 2 Fe 14 B grains from the Nd-rich grain boundary phase during recombination. Figure SEM micrographs showing virtually no Nd-rich phase in the HDDR processed sample containing 11.0 at% compared to a large amount of Nd-rich phase present in the sample containing 12.6 at%. [Kawashita et al. (2003)]. 84
 found that the coercivity mechanism was controlled largely by the pinning strength of the Nd-rich grain boundary phase. Figure 3.2.")
98 Chapter 3 Literature Review However, Ming et al. (2004) found that the coercivity mechanism was controlled largely by the pinning strength of the Nd-rich grain boundary phase. Figure shows the microstructure of the HDDR treated sample in backscattered SEM mode where the Nd 2 Fe 14 B is black and the Nd-rich grain boundary phase is white. The magnetisation curve of this sample is also shown, which follows the pattern of a typical pinning-type coercivity mechanism, where the grain boundaries act as the pinning sites to prevent the movement of domain walls. Although the two mechanisms have both been found to induce coercivity in HDDR powder, they both rely on the Nd-rich grain boundary phase and hence cannot occur simultaneously. Liu et al. (2009a) investigated these mechanisms using a theoretical anisotropy model and confirmed that both pinning and nucleation can control the manifestation of coercivity, but which one is acting in any case depends on structural defects and exchange coupling interactions in the material. Figure Backscattered SEM image of HDDR NdFeB (left) showing white grain boundary phase which acts as pinning sites for preventing domain wall movement, and the initial magnetisation curve (right) of the same sample demonstrating a typical pinning-type pattern. [Ming et al. (2004] 85

 13 (Fe 0.875 Co 0.")
99 Chapter 3 Literature Review Chen et al. (2003) analysed the unique microstructure of HDDR processed NdFeB and determined that the grains with a diameter around 0.3 µm would exhibit the rotation type demagnetisation that exists with a single domain particle type coercivity mechanism, leading to increased coercivity. However there is also the influence of domain wall motion which is associated with lower coercivity values. The grain size in this study was highly dependent on the composition of the alloy, with the Nd 13 Fe 81 B 6 sample having a mean grain size of 1.0 µm and the (Nd 0.8 Dy 0.2 ) 13 (Fe Co ) 81 B 6 sample having a mean grain size of 0.36 µm, the microstructures of which are shown in figure The coercivity of the ternary alloy was lower than that of the Dy and Co containing alloy due to a lower proportion of small grains (0.3 µm grains) which demonstrated a single domain coercivity mechanism. Liu et al. (2009) also demonstrated that more than one mechanism can be responsible for the coercivity of HDDR powders. Figure Backscattered SEM micrographs of the microstructure of HDDR processed a) Nd 13 Fe 81 B 6 with a mean grain size of 1.0 µm and b) (Nd 0.8 Dy 0.2 ) 13 (Fe Co ) 81 B 6 with a mean grain size of 0.36 µm. [Chen et al. (2003)]. 86
100 Chapter 3 Literature Review Other studies have investigated coercivity in a similar way to Kawashita et al. (2003) by performing HDDR through a range of temperatures and testing the magnetic properties to compare the effects of temperature. Jurczyk et al. (1999) found that coercivity decreased with increasing temperature and hence has an inverse relationship, which was also found and consequently confirmed by Kawashita et al. (2003). Sugimoto et al. (1999) found that temperature dependence was different depending on the method of the disproportionation stage. They found that when heating the sample in hydrogen (C-HD), good coercivity values were maintained up to 950 ºC; however heating in vacuum (V-HD) then adding hydrogen when final temperature was achieved showed a vast drop in coercivity above 900 ºC, as shown in the graph below, figure Figure Graphs to show the effect of treatment temperature during disproportionation on remanence and coercivity of resultant NdFeB powder, Sugimoto et al. (1999). 87
101 Chapter 3 Literature Review The investigation carried out by Ragg et al. (1997) discovered that coercivity increases with disproportionation time up to 15 hours, although the relationship is exponential and levels out after 5 hours. Han et al. (2004) however showed that holding the disproportionation pressure for this length of time has detrimental effects on the degree of alignment in the HDDR powder and after 14 hours the powder was basically isotropic. Further investigation into this phenomena showed that low disproportionation times formed a lamellar-type structure, whereas long hold times encouraged the transformation of the initial microstructure into a spherical morphology which reduces the degree of alignment in the material. 88
102 Chapter 3 Literature Review Alternative HDDR Processing Liesert et al. (1996) utilised an approach originally designed for use in high temperature superconductors such as YBa 2 Cu 3 O 7 by controlling solidification under a magnetic field. In this study the disproportionation was controlled to a point near completion where a 7 Tesla field was applied during the recombination stage to encourage directional orientation of the nucleated Nd 2 Fe 14 B grains. The hysteresis loops of the sample parallel and perpendicular to the easy direction of magnetisation shown in figure exhibit very good anisotropy and alignment, which was confirmed using X-ray diffraction in two perpendicular directions. The process was further improved by Liesert et al. (1997) using an excess of intergranular Nd-rich phase and investigating the effect of recombination time under the 7 Tesla applied field where increasing hold time increased the degree of anisotropy. Figure Hysteresis loops parallel and perpendicular to the easy direction of magnetisation prepared by applying a magnetic field during the recombination process. [Liesert et al. (1996)]. 89
 trialled a different approach to HDDR by milling as-cast Nd 12 Fe 82 B 6 in a planetary ball mill for 20 hours under hydrogen to encourage disproportionation into nano-structured Nd 2 H 5, Fe")
103 Chapter 3 Literature Review Gang et al. (2006) trialled a different approach to HDDR by milling as-cast Nd 12 Fe 82 B 6 in a planetary ball mill for 20 hours under hydrogen to encourage disproportionation into nano-structured Nd 2 H 5, Fe 2 B and α-fe mixture that was recombined at 760⁰C for 30 minutes. The fine, milled disproportionated structure and subsequent recombined microstructure are shown in figure below. It can be observed that the powder morphology is very fine at both stages of the process due to the planetary ball milling removing any agglomeration and causing fractures along grain boundaries. This formed a Nd 2 Fe 14 B/α-Fe two-phase nanocomposite exhibiting remanence 0.73 T, coercivity 610 kam -1 and maximum energy product kjm -3. This work proved that there are other ways to initiate the HDDR reaction, however the magnetic properties are lower than those produced using the conventional or vacuum HDDR processing routes. Figure SEM micrographs showing the powder morphology of thend 12 Fe 82 B 6 sample disproportionated under hydrogen in a planetary mill after a) disproportionation and b) recombination. [Gang et al. (2006)]. Williams et al. (1996) used cyclic S-HDDR processing to investigate the role of the Nd-rich grain boundary phase during the high temperature hydrogen and vacuum process. It 90
104 Chapter 3 Literature Review was found that on the first cycle of the HDDR process the large regions of Nd-rich phase redistributed along the grain boundaries of the newly formed, fine grained Nd 2 Fe 14 B structure. This redistributed Nd-rich phase then acted as a fast transport route for hydrogen into and out of the material on subsequent HDDR processing by increasing the effective area of Nd-rich phase. The redistribution of the Nd-rich phase on the first cycle does however leave large cavities in the structure where it used to be, which was confirmed by decreasing density of the sample after the first cycle of processing and a corresponding drop in resistivity (as shown in figure ) in comparison, on the second HDDR cycle there was no further drop in density. Figure Variation of resistivity throughout the HDDR process on the first and second cycle, with a significant drop in resistivity associated with a reduction in density due to increased cavitation. [Williams et al. (1996)] Martinez et al. (1996) attempted to improve the magnetic properties of c-hddr processed Nd-(Fe,Co,Ga)-B magnetic powders by using an annealing technique similar to that used post-sintering. In this case it was found that annealing at 250 ºC, 425 ºC and 630 ºC were all unsuccessful at improving magnetic properties, however it was shown that the higher the annealing temperature, the lower the coercivity and remanence of the resulting sample. 91
105 Chapter 3 Literature Review Scaling of the HDDR Reaction One issue that can occur in the commercialising of a production route is in scaling up the process from small samples in the lab to bulk processing. Manwaring et al. (1994) HDDR processed 25 g, 150 g and 15 kg batches of Nd 16 Fe 76 B 8 to demonstrate the effect of bulk processing. It was found that the exothermic disproportionation reaction in the 15 kg batch had no deleterious effect on the magnetic properties of the sample; however the endothermic reaction in the 150 g batch alone produced a large variation in magnetic properties. This is due to the kinetics of the recombination reaction being very sensitive to temperature and hence large scale processing requires careful control of the temperature throughout the reaction. It was concluded that the two reactions could be separated and so 15 kg batches could be disproportionated all together and then split into small batches for recombination. When this technique was applied, the variation of magnetic properties with regards to position of the sample within the large batch was measured and analysed. The demagnetisation curves for multiple samples from central positions and edge positions in two separate batches are shown in figure It can be observed that within each batch of samples from each position there is little variation in properties from multiple samples. There is also very little change in coercivity between the central and edge samples in each batch, however the remanence varies in batch 1 where the edge samples exhibit over 0.1 T higher remanence than central samples, although this is not the same for batch 2. When comparing the two batches, batch 1 exhibits slightly higher coercivity than batch 2, but batch 2 is much more consistent with both remanence and coercivity throughout the range of samples. Overall the up scaling of the process in this case was successful, although only isotropic powder was produced. 92
 and edge (labelled figure 11 and")
106 Chapter 3 Literature Review Figure Variation of demagnetisation curves of samples located at the centre (labelled figure 9 and 10) and edge (labelled figure 11 and 12) of HDDR processed powder from two separate batches. [Manwaring et al. (2004)]. 93
107 Chapter 3 Literature Review Bonded and hot-pressed Magnets Bonded magnets are produced by combining either milled HDDR powders or meltspun ribbon with a bonding agent such as PTFE or mixing with a resin such as Epoxy and curing to form net-shape magnets with lower magnetic properties than fully dense anisotropic sintered magnets. Bonded magnets can be made isotropic using either isotropic powders or by pressing uniaxially with no applied magnetic field. Anisotropic bonded magnets can be produced by pressing uniaxially or radially in the presence of an applied magnetic field or by hot-deformation techniques such as hot-pressing or annealing to encourage the deformation and curing of the binding agent in a preferred orientation during the pressing stage. Mishra et al. (1988) showed that hot-pressing followed by annealing is best for small grained materials such as melt-spun ribbons or HDDR processed NdFeB but not so good for large grained materials. Alignment was produced by a combination of plastic deformation, grain boundary migration and grain boundary sliding. Lee (1985) utilised the hot-pressing technique to produce fully dense, aligned NdFeB magnets from melt-spun ribbons. The samples were pressed under argon at 700⁰C before transferring to a second hot press to allow deformation parallel to the press direction, introducing a preferred direction of orientation. The demagnetisation curves, figure , of the samples after the first and the second hot pressing stage show that the alignment is achieved solely during the second hot press step. 94
108 Chapter 3 Literature Review Figure Demagnetisation curves of melt spun bonded magnets before and after hotpressing, showing slight variation in magnetic properties between the parallel and perpendicular directions. [Lee (1995)] Doser et al. (1991) replicated this process by consolidating melt-spun ribbons to full density using a hot-pressing technique followed by die-upsetting at 750 ºC with a maximum energy product of 15.8 MGOe (~125 kj m -3 ). Esteviez et al. (1994) used hot-pressing at 1023 K (750 ºC) on HDDR powder to produce bonded magnets with remanence around 0.7 T and coercivity in the range of 1200 kam -1. Yang et al. (1997) simplified the conventional hotpressing and subsequent die-upsetting into a single step process, as shown in figure In this work the authors compressed melt-spun ribbons in a copper tube and induction heated to ºC and pressed between two punch pieces with one stroke to a height reduction of 0.75 ratio, producing anisotropic NdFeB magnets. 95
109 Chapter 3 Literature Review Figure Single step process developed by Yang et al. (1997) for production of anisotropic hot-pressed NdFeB magnets. Gutfleisch et al. (1998) attempted to take this one step further, where HDDR treated NdFeB was hot pressed, die upset and then backward extruded to produce radially oriented ring magnets. This process produced remanence of 1.07 T in the radial direction with a coercivity of 575 kam -1 and good anisotropy, which can be observed in figure , however a bigger reduction in grain size during the HDDR process could reduce the deformation resistance during the backward extrusion and increase the degree of alignment, and hence, magnetic properties of the finished ring magnets. More recently, Nozawa et al. (2011) used SEM and TEM to analyse hot-pressed HDDR powders and determine the cause of increase in coercivity when full density is reached. It was found that the hot-pressing technique redistributed the Nd along grain boundaries to form thin, continuous Nd-rich phase grain boundary phase as with sintered NdFeB magnets. 96
110 Chapter 3 Literature Review Figure Demagnetisation curves in easy and hard direction of magnetisation comparing backward extruded ring magnets with die-upset magnets. [Gutfleisch et al. (1998)] Liesert et al. (1998) took NdFeB alloys with Nd contents of 12, 14 and 16 at% in an attempt to improve hot pressing and die-upsetting of HDDR powders to reduce cracking that usually occurs during the process. It was found that the 14 at% Nd samples contained a large amount of cracks and produced a magnet with 1.2 T remanence and 0.7 T (560 ka m -1 ) coercivity, whereas the 16 at% sample was completely crack-free with an increased coercivity of 0.95 T (760 ka m -1 ) however the remanence was reduced to 1.0 T. Recent work by Suresh et al. (2009) used the spark plasma sintering method in an attempt to consolidate HDDR treated Nd-Fe-Co-Zr-B-Ga alloys. The samples were sintered at temperatures between ºC at a pressure of 80 MPa for 20 minutes. The sample sintered at 500 ºC produced the best magnetic properties, displaying 928 kam -1 coercivity, 1.22 T remanence and 210 kjm -3 maximum energy product which are very respectable magnetic properties. 97
 was studied and measured by means of mass change and magnetic property degradation over periods up to 80 hours, as")
111 Chapter 3 Literature Review Tattam et al. (1996a) looked at possible binding methods for uncoated melt-spun NdFeB bonded magnets in the form of Epoxy resin, zinc and PTFE (as-forged and heat treated). The corrosion behaviour in a humid environment (100 ºC saturated with water vapour) was studied and measured by means of mass change and magnetic property degradation over periods up to 80 hours, as shown in figure The best binding agent was found to be the PTFE when heat treated as an adherent PTFE layer coated the particles forming an impenetrable barrier, meaning the compacts are only susceptible to corrosion at the surface, this sample was closely followed by Epoxy resin, which also coats the particles. The zinc binding agent formed white corrosion products on the surface and was by far the worst for corrosion protection. Further work by the same authors [Tattam et al. (1996b)] showed that doing the heat treatment on the PTFE bonded magnets can be improved by performing them under vacuum rather than in air vastly improved the mechanical properties and removed surface corrosion that can otherwise occur. Figure Magnetic properties of bonded melt spun NdFeB magnets before environmental testing and after 80 hours exposure to a water saturated, 100 ºC temperature. [Tattam et al. (1996a)] 98
 investigated the effect of applied magnetic field in the fabrication process of anisotropic bonded NdFeB magnet powders from d-hddr processing as observed in figure 3.2.44.")
112 Chapter 3 Literature Review Tian et al. (2006) investigated the effect of applied magnetic field in the fabrication process of anisotropic bonded NdFeB magnet powders from d-hddr processing as observed in figure It was found in this work that warm compaction is necessary to lower the viscosity of the binding agent, which increases the alignment ability of the powder during the compaction process and aids with densification. The magnets are pressed using warm compaction under an electromagnetic field of 2 T, before cooling and solidifying under a pulse field of 4 T. Powder blending the samples without the presence of a magnetic field yielded a (BH) max of 6.25 MGOe (49.7 kj m -3 ), which is increased by blending the samples under a magnetic field to MGOe (53.7 kj m -3 ). The authors proposed that the applied field magnetises the particles, which excluded and separated them from each other and made alignment easier during subsequent compaction. Figure Warm compression of bonded NdFeB magnet under the application of a magnetic field to encourage anisotropy. [Tian et al. (2006)]. 99
113 Chapter 3 Literature Review Overall it can be observed from the literature that the magnetic properties of HDDR materials are very sensitive to the processing conditions. Simple alterations to the disproportionation or recombination conditions or to the magnet compositions can have a dramatic effect on the magnetic properties of the HDDR material. In order to use the HDDR process for magnet scrap then large variations in composition are likely to occur which are likely to have a big impact on processing conditions, the resulting microstructure and on magnetic properties. 100
114 Chapter 3 Literature Review 3.3 Recycling rare earth magnets There are several challenges with regards to the potential recycling of end-of-life NdFeB type magnets. The first challenge is associated with the identification and collection of used magnet-containing devices, i.e. urban mining. The main short-term sources of scrap NdFeB include electronic scrap, loudspeakers and hard disk drives (HDDs) which are all currently available as waste products. Longer term sources of rare earth magnet scrap include motors from electric and hybrid vehicles that are presently in service or going into service with an estimated service life of ~10-15 years. Even longer term sources will be provided by magnets from MRI scanners and in off-shore wind turbines, both of which have a predicted lifetime of >15 years. These sources of scrap and their predicted lifetimes are shown in table Hard disk drives are an ideal form of scrap in many respects. They are already collected in large numbers in order to protect confidentiality by destroying data stored on the disk. They are also very easy to identify and are already separated from the rest of the computer system. The magnets used in these systems are all of a similar shape and are in the same position in every hard drive. Table Possible sources of NdFeB scrap and their estimated lifetimes. [A. Walton Presentation (2012)] Scrap source Hard disk drives Loud speakers Mixed electronics Motors and generators in hybrid & electric vehicles Generators in wind turbines MRI scanners Service life 5-10 years 5-10 years 5-10 years 15 years 20 years 15 years 101
115 Chapter 3 Literature Review The second challenge is to identify NdFeB magnets within electrical waste. Standard methods of material identification include identifying the shape of certain components and the use of X-ray fluorescence (XRF) for elemental analysis. Scrap NdFeB magnets are brittle and are usually still magnetised, meaning that when they are broken they will attract to ferrous scrap within the waste stream. Therefore if the magnets are broken during processing of the scrap then they can no longer be identified by shape and XRF analysis will identify ferrous scrap coated in magnet pieces, not just the whole magnets. The next major challenge is the separation of the magnets from the waste stream, which was highlighted as a major challenge in a tri-lateral meeting in Washington between the UK, USA and Japan [Binnemans et al. (2013)]. If magnets are mixed in with ferrous metal scrap for example, standard magnetic separation will not suffice as the magnet scrap will stick to the other ferrous materials. In electronic scrap there may be more than just sintered NdFeB magnets, for example there could be bonded magnets and ferrites present within the stream depending on the source of the scrap. Currently HDDs are shredded to destroy any data remaining on the disk. The voice coil motor magnets also get shredded in this process, which are still permanently magnetic. On shredding the magnets break up into small magnetised pieces that stick to the ferrous scrap in the waste stream and also to the shredder itself, as shown in figure 3.3.1, causing damage to the machinery as well as making separation difficult. Due to these and other issues, less than 1% of rare earth scrap is currently recycled [Binnemans et al. (2013)]. 102


116 Chapter 3 Literature Review Figure Shredded hard disk drives containing magnetic powder (left), industrial shredder with magnetised scrap powder trapped in and around the device (right). Image provided by Rene Kleijn, University of Leiden, Van Gansewinkel Group. One alternative option for separation of magnets from electronic scrap is manual disassembly, however this is very time consuming and labour intensive. In the case of hard disk drives for example there are multiple security screws that need to be removed to open the casing. The sintered magnets are also permanently magnetic, nickel coated and glued into a soft iron core assembly as shown in figure Another option is using mechanical force, such as tumbling the magnet-containing device to break apart the components, and then manually remove the magnets, which are still magnetised. This method is currently used by Hitachi for separating voice coil magnet assemblies from hard disk drives [Hitachi site visit, UK-Japan rare earth mission, Tokyo, Japan, December 2012]. 103

![[Walton et al. (2012)].](/docs-images/72/66468248/images/117-1.jpg "Another alternative option has been developed at the University of Birmingham, where the NdFeB magnets are exposed to hydrogen in order to initiation decrepitation.")
117 Chapter 3 Literature Review Figure Manually disassembled hard disk drive containing two main types of NdFeB magnets, a bonded NdFeB magnet in the spindle motor and two sintered NdFeB magnets in the voice coil motor. [Walton et al. (2012)]. Another alternative option has been developed at the University of Birmingham, where the NdFeB magnets are exposed to hydrogen in order to initiation decrepitation. The magnets in end-of-life products will be in their magnetised state, so they are attracted to the casing in which they are embedded and to each other if more than one is present. Demagnetisation by heat using temperatures over 320 ºC may cause decomposition of glues and would require a lot of energy. 104
118 Chapter 3 Literature Review Hydrogen Processing Zakotnik et al. (2004) investigated the use of the HD process to produce a powder from sintered NdFeB magnets for further processing and possible recycling. In this work the effect of HD processing temperature was studied in terms of particle size distribution of the hydrogen treated powder, which is shown in figure It can be seen that HD processing at room temperature (25 ºC) contains more fine powder than samples processed at higher temperatures, which would be ideal for subsequent processing. The sample treated at 450 ºC exhibited very few particles < 1000 μm, hence could be very difficult to align in subsequent sintering or recycling processes. Figure Particle size distribution of sintered magnets hydrogen decrepitated at a range of temperatures [Zakotnik et al. 2004]. The HD process has also been utilised in the removal of magnets from hard disk drives without the need for it to be disassembled or shredded, as shown by Walton et al. (2012). In this work HDDs were sectioned using an industrial cropper to selectively remove the corner containing the voice coil motor (VCM). The VCM was then distorted in a uniaxial press to break the NdFeB magnets and pierce the electroplated nickel coating to reveal a fresh 105
119 Chapter 3 Literature Review surface. These distorted sections of the HDD were loaded into a porous rotating drum and exposed to hydrogen at atmospheric pressure to decrepitate the magnets. The HD process not only breaks the magnet into a powder but also the powder is demagnetised by the process. The demagnetisation occurs as the hard magnetic matrix lattice is expanded by the presence of hydrogen, thus modifying the exchange interactions of the electrons, leading to a loss of magnetisation. This demagnetisation effect allows the powder to be more easily separated from the assembly without sticking to the ferrous components. By rotating the porous drum the powder can be liberated from the assemblies for collection. The collected powder consists mainly of large particles of NdFeB along with small impurities such as small plastic particles, electronic components and nickel flakes from the magnet coating. This powder can then be sieved and mechanically agitated to remove the nickel coating and plastic particles or small electronic components that have passed through the porous drum. Following extraction and separation of the material, the next stage of recycling is to choose the subsequent processing technique to either extract specific elements from the waste stream or reprocess the magnet into a new magnet for re-use. There are many ways of doing this. Walton and co-workers state that the hydrogen recycled powder can be reprocessed in a number of ways including: Refining the powder to extract the rare-earth elements for use as a feedstock for cast alloys. This has the advantage that the feedstock will be ~30% rich in rare earths, there will only be three rare earths present (Nd, Pr and Dy) and there will be no radioactive thorium which is present in raw mined materials. Disadvantages include the use of acids and organic solvents such as hydrofluoric acid in the extraction process and that this would require a lot of energy to re-produce a final magnet. 106
120 Chapter 3 Literature Review Melting and re-casting to form new alloy ingots. The main advantage is that the oxygen content of the alloy could be reduced by removing the slag layer. A disadvantage is that the new cast alloy will have a composition highly dependent on the input feed. Milling, aligning, pressing and sintering into new magnets. This reprocessing route would have a large energy saving compared to refining, however the final magnet composition is dependent on the input feedstock and the sintered magnet could have a high oxygen content due to the relatively high oxygen content exhibited by scrap sintered magnets (typically ppm). Degassing the powder and pressing into bonded magnets is a very cheap process however the corrosion resistance and stability of these magnets will be poor. Degassing the powder and melt spinning for use in bonded magnets, however the final magnet composition and magnetic properties are highly dependent on the input feed. HDDR processing of the powder for use in bonded magnets, however the final magnet composition and magnetic properties are highly dependent on the input feed. A scrap HDDR powder could be powder blended into a primary HDDR powder without having an effect on the overall microstructure of the mixture. All of these potential recycling routes are shown schematically in figure These reprocessing techniques are currently used in magnet production with cast alloys as the input feed as previously mentioned. A more detailed explanation of how each of these processes have been or could be adapted from the current specifications to enable re-processing of NdFeB alloys with a sintered microstructure follows figure

121 Chapter 3 Literature Review Figure Schematic showing multiple processing routes for the hydrogen recycled NdFeB powder [Walton et al. (2012)] 108
122 Chapter 3 Literature Review Pyrometallurgy Pyrometallurgy or high temperature processing of rare earth elements has been used for around twenty years to reprocess clean scrap generated during magnet production. Some of these pyrometallurgical processes have now been tailored to enable recycling of magnetic materials from waste streams and end-of-life consumer products on a laboratory scale. Pyrometallurgy currently used on an industrial scale includes processes such as direct melting of the rare earth alloy and liquid metal extraction to separate rare earths from transition metals in the metallic state. There are two main processes that have been developed for use in recycling of scrap magnet alloys, and these are electroslag refining and the glass slag method. The electroslag refining method was first introduced as a method of upgrading rare earth scrap such as NdFeB-type or SmCo-type magnets by Ellis et al. (1994). This process involves melting the scrap material and adding a reactive flux, made from CaCl 2 and CaF 2, to remove carbon, hydrogen, nitrogen, oxygen and metallic impurities. The material is either then poured into a water cooled mould through a slag layer containing which traps the impurities, or the melt is held at temperature in a liquid state and a slag layer is added to react with the impurities and then separated by cooling. This process works best with clean magnet scrap containing little impurities, i.e. not for swarf containing fine particulates or high levels of contamination. It must also be noted that the electroslag refining method cannot be used to separate rare earths, so it produces an alloy which is dependent on the input feed. A schematic of the electroslag refining apparatus is shown in figure 3.3.5, where the scrap material ingot is surrounded by a sea of molten slag which reacts with the impurities. 109
123 Chapter 3 Literature Review Figure Schematic showing the apparatus used for the electroslag refining method of rare earth scrap. [Ellis et al. (1994)]. This method has been further improved to a liquid metal extraction process where a wide variety of scrap feed materials including swarf can be processed to produce a clean final alloy with little to no intermetallic impurities [Ellis et al. (1994)]. This process works by the dissolution of a rare earth alloy in an alloy system by which the rare earth elements and other transition metals distribute themselves between liquid phases and can be separated by density or distillation/sublimation. For NdFeB alloys, the separation is performed by liquid magnesium. This is because Nd freely reacts with Mg to form an alloy which can be separated by vacuum distillation of Mg whereas Fe is completely immiscible in all portions with Mg and hence only the Nd reacts with Mg. Each type of rare earth scrap will require a different liquid alloy system to separate the rare earth element from the transition metals depending on the miscibility of each element with the alloy system. 110

124 Chapter 3 Literature Review The glass slag method for recycling was first utilised for separation of neodymium from NdFeB alloys by Saito et al. (2003). In this technique a rare earth alloy is brought into contact with a specially selected molten flux. This flux then selectively dissolves the rare earths from the alloy and supercools to form a glass. In the work by Saito et al. (2003), a molten boron trioxide was used as the flux which left behind α-fe and Fe 2 B with a Nd content of less than 0.01 wt%. An SEM micrograph and X-ray mappings of Nd, Fe and B of the alloy after removal of Nd are shown on figure 3.3.6, from which it can be observed that the resulting alloy is rich in Fe and B and lean in Nd, signifying successful separation. The rare earth containing glass is then dissolved in sulphuric acid followed by precipitation of the rare earths as hydroxides or as sulphate double salts, however it was found that this method produced large quantities of unspecified inorganic waste. Figure SEM micrograph and X-ray mappings of Nd, Fe and B in alloy after removal of Nd using the glass slag method [Saito et al. (2003)]. 111
125 Chapter 3 Literature Review Hydrometallurgy Although already used in primary production, hydrometallurgy was the traditional route used for recovery of rare earths from permanent magnets in the form of pre-consumer production scrap in sintered magnet production [Ellis et al. (1994)]. In this process, the rare earth alloys are dissolved in strong mineral acids in order to precipitate the rare earth elements as double sulphates, as with glass slag production, or oxalates or fluorides. Some impurities such as nickel, copper and boron are present in these precipitates and require further separation. Lyman and Palmer (1992) created a procedure where the Nd can be separated from NdFeB scrap using an aqueous H 2 SO 4 solution which encourage complete dissolution of NdFeB. This forms a strong acidic solution, which has sodium or potassium hydroxide added to form a neodymium alkali metal or salt, which can be converted to neodymium trifluoride using hydrofluoric acid solution, and then reduced using calcium. Another possible method of recycling NdFeB is to dissolve the scrap into HNO 3 then add hydrofluoric acid to form a neodymium-iron double salt, which can be reduced with calcium to form a neodymium-iron master alloy for use in production of new NdFeB magnets [Ellis et al. (1994)]. 112
126 Chapter 3 Literature Review Sintering A possible route for producing coercive powder from sintered NdFeB magnets is the HD process, as proposed by Rivoirard et al. (2000) where sintered precursors were exposed to hydrogen for absorption at controlled rates before heating under vacuum to desorb the sample and finally annealing to recover the bulk magnetic properties for use in bonded magnets. This process of producing anisotropic powder from waste sintered NdFeB magnets was further investigated in more detail by Zakotnik et al. (2006) to produce new or recycled sintered magnets from clean, uncoated blocks of scrap sintered Nd Pr 0.06 Dy 0.63 Fe Nb 0.36 Al 0.69 B This highly reactive powder can only be used as a building block for recycling however as its intrinsic coercivity is significantly reduced by the hydrogen absorption and hence requires further processing. The authors milled the HD-treated powder for 30 minutes in a roller-ball mill to reduce the particle size, before aligning, pressing and vacuum sintering at 1080 ºC for one hour. The magnetic properties of the recycled magnet showed a decrease in (BH) max of 15%, remanence of 10% and coercivity of 20%, these reductions in properties were attributed to increased grain size and reduced density of the recycled magnet due to oxidation. Zakotnik et al. (2008) investigated methods to recover the magnetic properties of the recycled samples further by altering the preparation techniques and processes. In this work the authors varied both the milling and the sintering conditions. It was found that increasing the milling time from no milling up to 20 hours greatly improved the density of the recycled magnet by creating a uniform distribution of particle sizes through the green compact, however with the lower milling times (<3 hours), increasing the sintering time recovered a degree of density. Thirty minutes and 1 hour milling, along with sintering for 3 hours greatly 113
127 Chapter 3 Literature Review improved the density to ~7.5 g cm -3 compared to 6.4 g cm -3 with no milling and only sintered for 1 hour. Although 20 hour milling and 1 hour sintering showed the greatest density (>7.6 g cm -3 ) for the sintered magnet, the optimum processing conditions in terms of magnetic properties were found to be by milling for thirty minutes and sintering at 1080 ºC for 1 hour where the maximum energy product was only 15% lower than that of the starting material. Further studies by the same authors [Zakotnik et al. (2009)] determined the effect of multiple re-sintering cycles. In this work the scrap sintered magnet was broken down in hydrogen, milled, pressed and aligned, then re-sintered before testing the magnetic properties. Then each consecutive cycle broke the magnet down in hydrogen, milled, blended with neodymium hydride, aligned and pressed, sintered and tested. It was found that after every cycle the density dropped and the squareness of the demagnetisation loop was reduced as determined by permeameter measurements, density measurements and SEM analysis of the microstructure showing significantly increased porosity. ICP analysis after each cycle showed a reduction in Nd content due to volatilisation during sintering and Leco oxygen analysis showed an increase in oxygen content after each cycle. The oxidation led to a reduction in magnetic properties of the sintered sample both by reducing the density and the formation of a non-magnetic oxidation phase presumed to be Nd 2 O 3. The recycling process was adapted to cope with the loss of Nd by powder blending in an extra 1 at% neodymium hydride after the 1 st, 2 nd and 3 rd cycles. The blending of Nd hydride was successful in recovering much of the magnetic properties and demagnetisation loop squareness towards that of the starting material after the first cycle. The demagnetisation quadrants of the samples sintered 4 times both with and without Nd additions are shown below in figure
128 Chapter 3 Literature Review Figure Demagnetisation loops of samples cyclically sintered both without (a) and with (b) additons of neodymium hydride [Zakotnik et al. (2009)]. 115
129 Chapter 3 Literature Review Recycling using HDDR Zakotnik et al. (2004) used two different processes to investigate recycling of NdFeB sintered magnets to produce a powder for use in bonded magnets. The two processes were HD-degassing and c-hddr. In this case the c-hddr process utilised a hydrogen disproportionation pressure of 0.4 bar and reaction temperatures up to 800 ºC, followed by recombination under vacuum before quenching. The HD-degassed powder exhibited good anisotropy and a high remanence when tested straight after processing, however it was found that after just 3 hours of exposure to air the sample showed a downward trend of magnetic properties resulting from its poor stability against oxidation and lack of corrosion resistance. The HDDR process stabilised the powder by altering its microstructure, however the treatment in this work produced isotropic powder exhibiting greatly reduced remanence and slightly increased coercivity, as expected from isotropic material. The stability of the HDDR treated powder was much better than that of the HD-degassed powder. After 120 hours of air exposure there was no significant change in magnetic properties. The demagnetisation curves for HD-degassed and HDDR processed powders and the variation in magnetic properties with respect to air exposure time are shown in figure
 and variation of magnetic properties with sample exposure to air (right). [Zakotnik et al. (2004)]. Luo et al.")
 that there are three main reaction exotherms as the sintered magnet is heated from room temperature to 1000 ºC under a mixed")
130 Chapter 3 Literature Review Figure Demagnetisation curves of HD and HDDR powder immediately after process completion (left) and variation of magnetic properties with sample exposure to air (right). [Zakotnik et al. (2004)]. Luo et al. (2009) investigated the hydrogen absorption and desorption characteristics of (NdDy) 15 (FeCoNbCu) 79 B 6 sintered magnets, not as a method of recycling but as a method of characterisation. In this study it was concluded by differential scanning calorimetry (DSC) that there are three main reaction exotherms as the sintered magnet is heated from room temperature to 1000 ºC under a mixed argon and hydrogen atmosphere. The first exotherm peak occurred between ºC which is associated with the hydrogenation of the Nd-rich phase, the second exothermic peak in the region ºC relates to the hydrogenation of the Nd 2 Fe 14 B tetragonal phase and finally the disproportionation of the Nd 2 Fe 14 B phase between ºC. This hydrogenation DSC trace for this work is shown below in figure In 2011, Luo et al. (2011) continued this work to gain a finer understanding of the procedure and determined that the sintered NdDyFeCoNbCuB-type magnets can be HDDR treated with very careful control over the process parameters to produce anisotropic powder that recovers 68% of the maximum energy product displayed by the starting bulk magnet. 117
131 Chapter 3 Literature Review Figure Hydrogenation DSC curve for a sintered NdDyFeCoNbCuB-type magnet clearly identifying the main hydrogen absorption reactions upon heating under H 2 /Ar flowing gas. [Luo et al. (2009)] Perigo et al. (2012) adopted the HDDR process to recycle sintered N42 grade NdFeB magnets. In this work the authors determined that processing temperatures outside the range ºC were deleterious to the magnetic properties of the resulting powder. Samples recombined at temperatures lower than 840 ºC showed a kink in their demagnetisation quadrant which was attributed to the presence of soft magnetic phases within the material due to incomplete recombination. The best recycled magnet powders produced in this study were processed at 860 ºC and were magnetically isotropic with 0.58 T remanence and 1.15 T (920 ka m -1 ) coercivity, the demagnetisation curve of which is shown below in figure The bonded magnets made from these powders were superior to any commercially available ferrite magnets with a lower cost than primary production of HDDR bonded magnets and without the need for Dy. 118
132 Chapter 3 Literature Review Figure Demagnetisation curve of the isotropic recycled magnet powder produced by Perigo et al. (2012). Da Silva et al. (2012) produced hybrid bonded magnets consisting primarily of meltspun NdFeB mixed with either isotropic HDDR recycled NdFeB (similar to that produced by Perigo et al. (2012)) or strontium ferrite powders. The goal of this work was to produce bonded magnets with better magnetic properties than standard ferrites but at a lower cost than primary processing of melt-spun NdFeB bonded magnets. It was found that adding up to 5 wt% of either powder had no negative effect on the intrinsic coercivity of the bonded magnet however the remanence was reduced. Increasing the amount of additive caused further reductions in magnetic properties, with greater reductions witnessed in strontium ferrite containing magnets than those containing recycled HDDR powder. These reductions can be observed in figure , which shows that adding recycled NdFeB has a much lower effect on remanence than adding ferrite powder, however both additions greatly affect the coercivity. Although the additives lowered the overall properties of the bonded magnets produced, they also lowered the cost of the magnet, offering cheaper alternatives for low-end applications. 119
133 Chapter 3 Literature Review Figure The effect of adding ferrite or HDDR-recycled NdFeB powder on coercivity (left) and remanence (right) to melt spun ribbon based NdFeB bonded magnets. [da Silva et al. (2012)] Guth et al. (2012) utilised the d-hddr route for recycling sintered NdFeB magnets to produce anisotropic powder for resin bonded magnets. In this work a Dy-lean alloy (Nd Pr 6.3 Dy 1.72 Fe Co 0.35 B 0.95 (wt%)) and a Dy-rich alloy (Nd Dy 8.94 Fe Co 0.98 B 0.9 (wt%)) were processed at a set temperature of 840 ºC using a variation of hydrogen pressures. It was observed that the Dy-rich alloy required higher hydrogen pressure (70 kpa (0.7 bar) compared to 25 kpa (0.25 bar)) to fully disproportionate the sample due to the presence of Dy and Co in large quantities stabilising the Nd 2 Fe 14 B phase against disproportionation. The recovery of magnetic properties in the recycling of the Dy-lean alloy were very acceptable for use in a bonded magnet, however an alloy containing Ga and Nb that was specifically designed for HDDR processing showed even better recovery of magnetic properties on HDDR processing at a pressure of 30 kpa (0.3 bar). The change in microstructure from the starting low-dy sintered magnet to the fully HDDR processed sample is shown in figure It was observed that the grain size was reduced from around 10 µm in the sintered specimen to less than 1 µm in the HDDR powder to form a very fine microstructure. This 120


134 Chapter 3 Literature Review work also stated that the d-hddr process can be adapted depending on the composition of the input feed for optimum processing by increasing or decreasing the hydrogen pressure during disproportionation or recombination. The authors compared the magnetic properties of the Dy-lean recycled powder to those of commercial HDDR powder produced from an unspecified NdFeBGaNb-type alloy. It was found that the recycled Dy-lean powder had a similar remanence and coercivity to the commercial powder but with much less loop squareness which was assumed to be due to oxidation during the recycling process. Figure Backscattered SEM micrographs of a low-dy containing sintered starting microstructure (labelled (a) ) and the fully HDDR processed fine microstructure (labelled (f) ). [Guth et al. (2012)]. 121
135 Chapter 4 Materials and Methods Chapter 4 MATERIALS AND METHODS 4.1. Material Selection The compositions of the three scrap sintered magnets investigated during this thesis are shown in table 4.1. Pictures of the materials in their as-received form are shown below in figure Table 4.1. Compositions of the three starting materials (atomic % unless stated otherwise). Sample Nd Dy Pr Fe Co Al Nb Cu B Oxygen (ppm) Composition A Nil 78.6 Nil Nil Composition B Nil Composition C Nil Figure Starting materials in the as-received form of Compositions A, B and C from left to right. 122
136 Chapter 4 Materials and Methods The compositions of these starting materials were obtained using Ion Coupled Plasma (ICP) analysis on an Optima 5300V ICP machine and the oxygen contents were obtained using a LECO oxygen analyser, accurate to 1ppm (manufacturers specification). This analysis was all performed by Less Common Metals Ltd. Composition A was chosen as the material to be used during the investigation of the key processing variables for HDDR. 123


137 Chapter 4 Materials and Methods 4.2 Production of HDDR Material Initial Sample Preparation The uncoated scrap blocks of composition A and composition B were cracked and broken into pieces using a 10 ton press and an angled metal bar to reduce sample size and create fresh surfaces to react with the hydrogen during the decrepitation process. The nickel coating on magnets of composition C was removed using a scalpel; the sintered magnet was then broken in half using a vice to create a fresh surface to initiate hydrogen reaction during decrepitation. Images of the starting materials in both the as-received form and prepared ready for hydrogen decrepitation are shown below in figure Nickel coating Figure The starting materials of Compositions A,B and C from top to bottom in the asreceived form and prepared ready for hydrogen decrepitation, with the removed nickel coating evident for Composition C. 124

138 Chapter 4 Materials and Methods Hydrogen Decrepitation (HD) 100 g of the fragmented sintered magnet block or voice coil motor magnet was placed in the decrepitation chamber of the HD rig and sealed. The mass was restricted to prevent large temperature deviations during the exothermic HD reaction. The decrepitation chamber was then placed in a large, hollowed cast iron block to act as a heat sink during the process and attached to the system shown in figure using a quick-fit connector. The system was then evacuated to ~10-2 mbar before backfilling with hydrogen to 4 bar gauge pressure. The pressure level was monitored until it dropped to signify the activation of the decrepitation reaction. As the hydrogen pressure decreased more hydrogen was introduced to maintain a pressure of 4 bar until the pressure remained stable for 20 minutes, signalling the end of the reaction. The system was then evacuated and the decrepitation chamber was sealed and transferred to an argon filled glove box where the HD powder was handled and stored under an inert argon atmosphere containing <50 ppm oxygen. Figure A schematic showing the setup for the HD process used to turn the scrap magnets into a powder ready for further processing. [Mottram (1998), p. 53] 125
139 Chapter 4 Materials and Methods Alternatively the material was hydrogen decrepitated in the HDDR system, as shown in figure to limit the oxidation of the HD powder as discussed in further detail in chapter g of the fragmented sintered block was placed into a stainless steel canister which was inserted into the HDDR furnace tube and evacuated. Upon reaching full vacuum (~10-2 mbar), hydrogen was introduced to 2 bar dynamic pressure, controlled using mass flow controllers and held until full decrepitation had occurred. The reaction was monitored by assessing the hydrogen flow required to keep the pressure constant. When the flow slowed to zero the reaction was deemed to be complete. 126

 the system was fully evacuated using a rotary vacuum pump (~10-2 mbar) before being heated to the desired processing temperature (800-950 ºC).")
140 Chapter 4 Materials and Methods Hydrogenation Disproportionation Desorption Recombination (HDDR) Either 20 g of the HD powder was removed from the glove box in a sealed glass sample tube before transferring into a stainless steel canister in air which was then placed in the HDDR furnace tube as quickly as possible to minimise the HD powders exposure to oxygen; or 20 g of the fragmented sintered block was hydrogen decrepitated in the HDDR rig. Once the HD material was in the HDDR rig (as seen in figure 4.2.4) the system was fully evacuated using a rotary vacuum pump (~10-2 mbar) before being heated to the desired processing temperature ( ºC). During the heating process the hydrogen stored in the HD-treated NdFeB is degassed which can be observed by the loss of vacuum, and recorded using an arduino data logger. A schematic of the HDDR rig set up is shown below in figure Figure Schematic representation on the HDDR system set up. 127

.")
.")
141 Chapter 4 Materials and Methods Control system diagram Pirani pressure gauge Argon (left) and hydrogen (right) inlet valves Water cooled copper sleeve Gas inlet valve HDDR Furnace Inconel furnace tube Figure HDDR rig and furnace (top right and bottom) used throughout this project for the processing of the NdFeB including mass flow control system (top left). Once the processing temperature was achieved and the vacuum had recovered to a level of ~10-2 mbar, the disproportionation stage was started by introducing hydrogen at a rate of 16 mbar min -1 up to the desired processing pressure ( mbar). This rate was previously determined within the Magnetic Materials Group at The University of Birmingham [Sillitoe (2009)]. The hydrogen pressure was held at this pressure for between 0-60 minutes to allow full disproportionation of the material. 128
142 Chapter 4 Materials and Methods After this hold time the recombination reaction was started by lowering the hydrogen pressure to mbar at a rate of 100 mbar/min and held for 0-30 minutes before complete hydrogen removal using a rotary vacuum pump (~10-2 mbar). At pressures below 300 mbar the mass flow controllers cannot accurately control the removal of hydrogen so they are assisted by the vacuum valve being manually opened until full vacuum (~10-2 mbar) is achieved. At full vacuum the recombination reaction is complete and the sample is quickly cooled by rolling the furnace off the furnace tube and/or placing a water-cooled copper coil over the tube to increase the cooling rate. A representative schematic diagram of the heating and hydrogen profiles is shown below in figure The pressures, temperatures and hold times for the reaction were changed depending on the investigation in progress to optimise the overall HDDR processing conditions. Figure Representative schematic showing the heating and hydrogen pressure profile of the HDDR reaction 129
143 Chapter 4 Materials and Methods 4.3 Production of Bonded Magnets Powders created using the HDDR processing route were pressed using either polytetra-fluro-ethylene (PTFE) or epoxy resin as binding agents to produce either isotropic or anisotropic bonded magnets. The HDDR powder was ground using a pestle and mortar prior to mixing with the binder. The PTFE bonded magnets were produced by mixing the ground HDDR powder with PTFE in a 80:20 volume ratio NdFeB:PTFE, before pressing at 10 tons and curing at 360 ºC for 5 minutes followed by a slow cool to room temperature. To produce the epoxy bonded magnets the epoxy had to be prepared first; the epoxy resin and hardener were melted on a hot plate in a carrier fluid (industrial methylated spirit or cyclohexane). The ground HDDR powder was then added in an 85:15 volume ratio of NdFeB:epoxy and mixed to coat every particle in the binding mixture. The mixture was then transferred into a vacuum port to evaporate the carrier fluid thus leaving the powder coated in resin. The resin coated HDDR powder was then ground and pressed to 10 tons and finally cured at 125 ºC for 2 hours to set. For isotropic magnets the powder and binder mix were poured into a 10 mm diameter die and pressed to 10 tons pressure using an automatic Specac 30 ton press; the press and die are shown in figure For anisotropic bonded magnets the powder and binder mix was poured into a specially designed cuboid die (10 mm x 20 mm x 20 mm) lined with PTFE lubricant before pressing to 10 tons pressure under an applied magnetic field of 1 Tesla in a Redcliffe alignment press; the press and die are shown in figure
144 Chapter 4 Materials and Methods For a 10 mm tall bonded magnet with a diameter of 10 mm, the overall volume is determined by the equation: V = π r 2 h where, V = volume (cm 3 ), r = radius (cm) and h = height (cm) V = * * 1.0 = cm 3 The mass of sample and binder to be used in each bonded magnet is determined by the equation: m = V f * V * D where, m = mass (g), V f = volume fraction and D = density (g cm -3 ) For PTFE bonded magnets a ratio of 80:20 NdFeB:Binder is used m = 0.8 * * 7.5 = 4.71 g NdFeB m = 0.2 * * 2.2 = 0.35 g PTFE For Epoxy resin bonded magnets a ratio of 85:15 NdFeB:Binder is used: 0.85 * * 7.5 = 5.00 g NdFeB 0.15 * * 1.1 = 0.13 g Epoxy N.B. For Epoxy resin bonded magnets general practice is to make enough for at least 5 magnets for each run as some of the mixture can be lost during the drying process and removal from the mixing vessel. The mass of anisotropic magnets was double that of the isotropic magnets due to dimensions of the die. 131

 Specac uniaxial press and B) Isotropic die")


145 Chapter 4 Materials and Methods Pressure control panel A B Die main body Pressure ram Punch pieces Figure Equipment used for the production of anisotropic epoxy resin and PTFE based bonded magnets A) Specac uniaxial press and B) Isotropic die for use in the uniaxial press A B Pressure ram Die main body Alignment pole pieces Punch piece Field control unit Figure Equipment used for the production of anisotropic epoxy resin and PTFE based bonded magnets A) Redcliffe alignment press, B) Specially made die for use with the alignment press. 132
146 Chapter 4 Materials and Methods 4.4 Characterisation Techniques Permeameter The starting materials and bonded magnets were magnetically characterised using a closed loop permeameter. The permeameter requires a uniform sample with two parallel flat faces with a minimum depth of 3 mm and maximum diameter of 22 mm in order to fit between the measurement coils. The uncoated blocks of Compositions A and B were cut and sliced using a diamond cutting saw to create cuboids to fit within the constraints of the system and measured 5 times in each direction and an average taken to enter into the calculation spread sheet. Cylindrical bonded magnets with parallel faces also had their diameter measured five times and an average taken. The surface area of the sample is required to calculate the polarisation and the energy product of the sample in question. The system, as shown in figure comprises of two electromagnet poles connected to a power supply, with a pair of concentric coils connected to two Hirst Magnetics integrators. One of the coils measures the polarisation of the sample with the change in applied magnetic field; the other coil measures the applied field across the sample that is produced by the electromagnets. The software then performs a calculation (equation 4.1.1) to determine the magnetic induction associated with the sample. The integrators are zeroed before use to exclude the effect of any stray fields within the vicinity of the sample and to increase the accuracy of the measurement. Equation where µ 0 is the permeability of free space = 4π x 10-7 N A


.")
147 Chapter 4 Materials and Methods The sample was then magnetised in the testing direction and placed between the pole tips at the centre with the measurement coils around it. The pole tips were moved so that they were in contact with the sample to form a closed loop. The applied field was gradually increased to 1.5 T before lowering to zero. The direction of the field was then reversed and increased to apply a demagnetising field up to 1200 ka m -1. The field was then reduced to zero, the direction of applied field reversed and increased to 1200 ka m -1 to complete the hysteresis loop. The field was then lowered back to zero. The measurement uncertainty associated with the permeameter were found to be remanence ±2.30%, coercivity ±2.50% and maximum energy product (a combination of remanence and coercivity) ±4.80% at a confidence level of 95%. The uncertainty analysis can be found in the appendix (Figure App. 4.4). A B Pole tip Tightening bolts Electromagnet Pole piece C Measurement coils Pole tips Integrators Power supply Figure Permeameter used for measuring solid magnet samples such as sintered and bonded magnets, consisting of A) electromagnet assembly, B) measuring coils in between the electromagnet poles, and C) computer control unit, integrators and power supply. 134

148 Chapter 4 Materials and Methods Vibrating Sample Magnetometer (VSM) Before measurement the samples were ground down to remove agglomeration using a pestle and mortar. Between mg was added to the cylindrical sample holder (figure 4.4.2) along with enough candle wax to fill the sample container after the sample has been added, before sealing with standard electrical insulating tape. The sample holder was then placed in boiling water for 2 minutes to melt the wax, then transferred to an electromagnet to align the magnetic particles whilst the wax solidified in a 1.5 T aligning field, thus holding the particles in the easy direction which was marked on the sample holder. The sample was then magnetised using a capacitor discharge pulse magnetiser, producing a 4 Tesla alignment field. The sample was then positioned centrally in the VSM before measuring magnetic properties in the easy direction. The sample was then pulse aligned perpendicular to the easy direction, i.e. the hard direction, and measured again using the same settings on the VSM to determine the anisotropic nature of the powder. Figure Cylindrical two-piece sample holder for VSM powder samples The VSM used is shown below in figure 4.4.3, along with a schematic showing the set-up of a typical VSM connected to a user interface, figure The sample is vibrated sinusoidally perpendicular to the applied field using the vibration unit in the head, which causes an induced voltage in the pickup coils that is proportional to the magnetic moment of the sample along with signal received by the hall probe measuring the applied field. These 135


149 Chapter 4 Materials and Methods signals are transferred to the computer interface to produce a magnetic hysteresis loop which can be used to calculate the remanence, coercivity and energy product of the sample. The uncertainty analysis associated with the VSM were found to be remanence ±0.7%, coercivity ±0.7% and maximum energy product ±1.4%, the uncertainty analysis can be found in the appendix (Figure App. 4.4). Vibrating head drive Close up of pole tips, pick up coils and foot of sample rod Sample rod Pole pieces Pole tips Figure Lakeshore vibrating sample magnetometer used in this project and close up of pick up coils 136
150 Chapter 4 Materials and Methods Figure VSM schematic showing the internal setup of the VSM. Schematic from: Accessed: 15/01/
 is measured by three orthogonal hall probes situated within a probe head, allowing a resolution of 0.2 x 0.2 mm.")

151 Chapter 4 Materials and Methods MagScan The MagScan, supplied by Redcliffe Magtronics, is a field mapping system that can determine the orientation and variation of magnetic field strength within a sample or across a batch of samples. The magnetic field exhibited by the sample(s) is measured by three orthogonal hall probes situated within a probe head, allowing a resolution of 0.2 x 0.2 mm. The probe head is set at a specific distance above the sample (~2-10 mm) and scans a set area within a maximum limit of 300 x 300 mm which is controlled by the computer. The MagScan produces an image showing contrasting colours depending on the strength and direction of the field detected by the hall probes. A set-up of the MagScan is shown below in figure Computer control system Power supply Scanning system Scanning motion system Probe head Scanning Area (300x300 mm) Figure Entire MagScan set up including computer, power supply and scanning system (top) and close up on the probe head and scanning area (bottom). 138
 to produce a level sample.")
152 Chapter 4 Materials and Methods Microscopy Sample Preparation The samples were prepared for microscopy by grinding the HDDR powder in a pestle and mortar gently to remove agglomeration. The HDDR powder was then mixed with conductive thermohardenable Bakelite and heated and pressed using an Opal 400 mounting press (figure 4.4.6) to produce a level sample. Solid samples of the sintered starting materials were mounted using coarse particle Bakelite, however, for the powdered samples the Bakelite was ground using a pestle and mortar to produce a fine powder that can be mixed with the sample powder to create a layer of sample containing Bakelite thus preventing powder pullout during the subsequent grinding and polishing. These samples were then ground and polished using a combination of SiC grinding papers (P120, P240, P400, P800 and P1200 grit for solid samples or P800 and P1200 grit for powdered samples) to remove deep scratches followed by polishing using nylon and selvyt cloths with 6μm, 1μm and 1/4μm diamond paste suspended in an oil based lapping fluid to remove light scratches and leave a flat, polished surface. Locking system Ram control buttons Temperature display Timing selector On/off switch Figure Opal 400 mounting press for mounting samples in Bakelite 139
153 Chapter 4 Materials and Methods The samples were then inspected using a standard laboratory optical microscope before being analysed using an Olympus LEXT OLS 3100 laser microscope, a Jeol 6060 scanning electron microscope (SEM) or a Jeol 7000 high resolution scanning electron microscope (HR-SEM). Optical Microscopy The bakelite-mounted samples were placed under a Laborlux 12 HL optical microscope fitted with Leitz lenses ranging from 10x-400x zoom and an AxioCam ICc 1 camera linked to J-Microvision imaging software to study the surface of the sample. Scanning Electron Microscopy Samples mounted in conducting Bakelite were examined using the Jeol 6060 Tungsten filament SEM, a Hitachi TM 3000 desktop SEM and the high resolution Jeol 7000 field emission gun SEM (FEG-SEM). Secondary electron imaging was used for analysis of surface topology of the samples and backscattered electron imaging was used for phase identification within the samples. The Jeol 6060 and Hitachi TM 3000 were used for most imaging, however, the Jeol 7000 was required for clearly viewing the disproportionated structure due to its superior resolution. 140

154 Chapter 4 Materials and Methods Density Measurements The density of the bonded magnets was calculated using measurements from an Ohaus Galaxy densitometer, shown in figure The sample was weighed in the air chamber and then in a fluid chamber filled with diethyl phthalate of known density. The density of the sample was then calculated by: Sample Density (g cm -3 ) = Sample Mass in Air (g) x Fluid Density (g cm -3 ) Sample Mass in Air (g) Sample Mass in Fluid (g) Figure Ohaus Galaxy densitometer showing air and fluid measurement chambers. 141
155 Chapter 5 Starting Materials Chapter 5 RESULTS & DISCUSSION - STARTING MATERIALS Material of composition A originating from UGIMAG was supplied by Arnold Magnetics as blocks of uncoated sintered NdFeB-type material measuring 45 mm x 70 mm as shown in figure 5.1.1a. The composition of these blocks was determined to be Nd 13.4 Dy 0.7 Fe 78.6 Al 0.7 Nb 0.4 B 6.2 (atomic %) with an oxygen content of 2665 ppm and traces of Pr 0.04 at%, Cu 0.04 at%, Mn 512 ppm, Si 427 ppm and N 90 ppm. The Dy and Pr are likely to be mostly located in the matrix phase having substituted with Nd and small amounts in the rare earth rich grain boundary phase [Tenaud et al. (1991)]. The Al and Nb are likely to be located in the grain boundary phase and triple points, along with the trace amounts of Cu, Mn, Si and N as shown by Schneider et al. (1999), Ahmed et al. (1996) and Katayama et al. (2012). Small cubes ~1 cm 3 were cut from the block and measured in the easy direction of magnetisation using a permeameter, the remanence was found to be 1200 mt and coercivity was measured at 1180 ka m -1. The demagnetisation curve is shown in figure 5.1.1b, which shows a very square loop, signalling excellent alignment within the block. The microstructure of this sample, figure 5.1.2, shows the typical microstructure of a sintered magnet, consisting of (Nd,Dy,Pr) 2 Fe 14 B grains, with an average grain size of 6.2 µm (with an estimated standard deviation of 2.3) surrounded by Nd-rich grain boundary phase containing Al, Nb, Cu, Mn, Si, N and O, with only small amounts of porosity, evidenced by the black regions, which gives rise to a high density sintered magnet. 142
 Uncoated block of sintered NdFeB magnet of")


156 Chapter 5 Starting Materials a) b) Figure a) Uncoated block of sintered NdFeB magnet of composition A, b) Demagnetisation curve of 1 cm 3 sample measured in easy direction of magnetisation using a permeameter. Figure SEM micrographs of sintered material of composition A at x500 zoom (top) and x1000 zoom (bottom) 143
 with an oxygen content of 4130 ppm and traces of Cu 0.04 at%, Ga 0.")
157 Chapter 5 Starting Materials Material of composition B was supplied by Arnold Magnetics as blocks of uncoated sintered NdFeB-type material measuring 60 mm x 60 mm as shown in figure 5.2.1a. The composition of these blocks was determined to be Nd 12.5 Dy 1.8 Pr 0.2 Fe 72.6 Co 5.0 Al 0.9 Nb 0.6 B 6.4 (atomic %) with an oxygen content of 4130 ppm and traces of Cu 0.04 at%, Ga 0.05 at%, C 671 ppm, Si 596 ppm, Mn 464 ppm, Ni 232 ppm and N 222 ppm. The Co additions are likely to be located in the matrix phase having substituted with Fe as shown by Nakayama and Takeshita (1993). The Ga, C and Ni are likely to be located within the grain boundary phase as they do not react with the matrix phase during the sintering process as shown by Matssura et al. (1999) and Sepehri-Amin et al. (2010a). Small cubes ~1 cm 3 were cut from the block and measured in the easy direction of magnetisation using a permeameter, the remanence was found to be 1100 mt and the coercivity was not able to be measured as it requires a field larger that exceeds the current system limitations, so in this case it can be quoted at >1500 ka m -1. The partial demagnetisation curve is shown in figure 5.2.1b, which shows that the magnetisation is maintained up to 1500 ka m -1 the maximum field of the permeameter. a) b) Figure a) Block of sintered starting material of composition B, b) Partial demagnetisation curve of 1 cm 3 sample in easy direction of magnetisation. 144
 2 (Fe,Co) 14 B grains than composition A with an")
 surrounded by Nd-rich grain boundary phase containing Al, Nb, Ga, C, Cu, Si, Mn, Ni, N and O with only similar levels of porosity, which gives")
158 Chapter 5 Starting Materials The microstructure of this sample, figure 5.2.2, shows the typical microstructure of a sintered magnet, consisting of slightly smaller (Nd,Dy,Pr) 2 (Fe,Co) 14 B grains than composition A with an average grain size of 6.1 µm (with an estimated standard deviation of 2.5) surrounded by Nd-rich grain boundary phase containing Al, Nb, Ga, C, Cu, Si, Mn, Ni, N and O with only similar levels of porosity, which gives rise to a high density sintered magnet. Figure SEM micrographs of sintered material of composition B at x500 zoom (top) and x1000 zoom (bottom) 145

159 Chapter 5 Starting Materials Material of composition C was supplied by Philips as individual demagnetised voice coil motor magnets with a single layer nickel coating as shown in figure 5.3.1a. After removal of the nickel coating the composition of these blocks was determined to be Nd 11.6 Dy 0.6 Pr 1.6 Fe 77.9 Co 1.4 Al 0.7 Cu 0.1 B 6.1 with an oxygen content of 5080 ppm and traces of Ga 0.05 at%, C 1779 ppm, Mn 474 ppm, Si 398 ppm and Ni 325 ppm. The additional elements outside of Nd, Fe and B are likely to occupy the same sites as in the sintered blocks of compositions A and B. A small slither cut vertically down the middle of the sample was cut from the magnet and measured in the easy direction of magnetisation using a vibrating sample magnetometer (VSM), the remanence was found to be 850 mt and coercivity was measured at 1200 ka m -1. The demagnetisation curve is shown in figure 5.3.1b, which is not as square in loop shape, which is due to the self-demagnetisation effect that occurs with open-loop hysteresis loop measurements. Figure Two individual voice coil motor magnets of composition B in as-received form with an electroplated nickel coating, b) Demagnetisation curve of slither of sample in easy direction of magnetisation. 146


160 Chapter 5 Starting Materials The sample of composition C has to be measured using a VSM due to the thickness of the sample being lower than the thickness of the measuring coils of the permeameter. This means that the electromagnet poles of the permeameter would be unable to form a closed loop with the parallel surfaces of the sample. The direction of magnetisation is perpendicular to the flat surface however the poles exist in an arc from the left hand edge to the right hand edge of the magnet, as shown using a field mapping system called MagScan. The magnetic field of the scanned magnet is shown below in figure It can be observed that the left hand side is effectively the south pole showing negative field values and the right hand side is the north pole showing positive field values. Figure MagScan image showing the north and south poles of the voice coil motor magnet. The microstructure of this sample, figure 5.3.3, shows the typical microstructure of a sintered magnet, consisting of larger (Nd,Dy,Pr) 2 (Fe,Co) 14 B grains than compositions A and 147


161 Chapter 5 Starting Materials B, with an average grain size of 7.2 µm (with an estimated standard deviation of 2.8) surrounded by Nd-rich grain boundary phase containing Al, Cu, Ga, C, Mn, Si, Ni and O with much larger levels of porosity than compositions A and B, which gives rise to a lower density of the sintered magnet. Figure SEM micrographs of sintered material of composition B at x500 zoom (top) and x1000 zoom (bottom). 148
162 Chapter 6 Development of Microstructure Chapter 6 RESULTS & DISCUSSION - DEVELOPMENT OF MICROSTRUCTURE To fully understand the changes that take place during the HDDR reaction it is important to look at how the microstructure develops and the effect of hydrogen absorption and desorption throughout the process from the sintered starting material to fully HDDR processed powder. This whole chapter uses the starting material of Composition A as an example to observe these changes. For compositional and phase changes the backscattered electron imaging mode is most useful and has been used in all cases in this section unless stated otherwise. 149
 surrounded by Nd-rich grain boundary phase and triple points (white) containg various additions as discussed in chapter 5.")
163 Chapter 6 Development of Microstructure Sintered NdFeB Figure 6.1 shows the microstructure of the sintered starting material, which has been previously discussed in chapter 5. The sintered microstructure consists of matrix Nd 2 Fe 14 B grains (grey) surrounded by Nd-rich grain boundary phase and triple points (white) containg various additions as discussed in chapter 5. The typical grain size of sintered NdFeB is ~10 µm. Nd-rich phase Nd 2 Fe 14 B phase Figure 6.1. SEM micrograph of the sintered starting material at x1000 magnification in backscattered electron imaging mode. 150
164 Chapter 6 Development of Microstructure Hydrogen Decrepitation The hydrogen decrepitation (HD) process was used to produce a powder from sintered magnets of composition A, Nd 13.4 Dy 0.7 Fe 78.6 Al 0.7 Nb 0.4 B 6.2 (atomic %) with an oxygen content of 2665 ppm. It has previously been shown by Harris et al., (1995) that during the HD process hydrogen is absorbed by both the Nd-rich grain boundary phase and the Nd 2 Fe 14 B matrix phase. This leads to the formation of Nd-hydride in the grain boundary phase and absorption of hydrogen into the matrix phase lattice which causes an expansion of the matrix and grain boundary phases. The difference in volume expansion between the matrix phase and the grain boundary phase leads to intergranular cracking and brittle fracture. The HD process in this case was carried out at 2 bar and absorption of hydrogen was measured using mass flow controllers to maintain the pressure. The hydrogen flow rate which was required to keep the pressure at 2 bar was monitored throughout the reaction. This absorption was also accompanied by an increase in temperature due to the exothermic nature of the decrepitation process which was monitored via a thermocouple. Figure 6.2 shows the flow rate of hydrogen and temperature of the sample during the HD reaction. The first peak in the hydrogen flow rate is associated with filling the furnace with hydrogen up to 2 bar which took 10 minutes. It took 25 minutes for the HD reaction to initiate, signified by the narrow absorption peak between minutes. This indicated rapid hydrogen absorption, with the HD process taking 20 minutes to complete. The time taken for initiation is likely to be as a result of a surface oxide which has previously been shown to slow the initiation of hydrogen [Meakin et al. (2012)]. 151

165 Chapter 6 Development of Microstructure Figure 6.2. Flow rate of hydrogen and sample temperature during the hydrogen decrepitation process. Figure 6.3 shows the physical appearance of the hydrogen decrepitated powder as removed from the HD vessel. It can be observed that the particles in general are quite coarse, although there are some fine powder particles within the mixture. Figure 6.3. Photograph of hydrogen decrepitated powder before HDDR processing. 152
166 Chapter 6 Development of Microstructure Backscattered SEM analysis (shown in figure 6.4) revealed that the hydrided Nd 2 Fe 14 B phase is still intact, separated by small regions of Nd-rich hydride phase. As the Nd-rich phase absorbs hydrogen, a neodymium hydride phase (assumed to be NdH 2.7 ) is formed which now appears as the white phase. The hydrogen decrepitated powder looks similar to the starting sintered microstructure in the way that the grey matrix phase is surrounded by angular white phases at triple points and grain boundaries. However it has been fractured into large particles due to the decrepitation process and the phases present are different as stated previously. Image A shows evidence of intergranular cracking which has separated the sintered block into individual particles. 153


167 Chapter 6 Development of Microstructure A Cracks along grain boundaries Intergranular cracks caused by decrepitation B Nd-rich hydride Hydrided Nd 2 Fe 14 B Phase Figure 6.4. SEM micrographs of hydrogen decrepitated NdFeB from the sintered block at A) x400 magnification and B) x1000 magnification. 154
168 Chapter 6 Development of Microstructure Heating and Degassing The HD sample was kept under vacuum between decrepitation and the heating stage, with no milling or air exposure. During heating of the HD powder under vacuum up to the HDDR treatment temperature, the hydrogen contained within the material was desorbed. The temperature change and hydrogen desorption rate were measured by a thermocouple and vacuum pressure gauge attached to an arduino data logger designed specifically for desorption measurements. Figure 6.5. shows the desorption trace of the HD treated sample as it was heated at a rate of 15 ºC min -1 up to 880 ºC. It can be observed that the desorption occurs in two peaks. The initial large absorption peak between ºC can be attributed to a combination of desorption of NdH 2.7 to NdH 2 and desorption of hydrogen from the Nd 2 Fe 14 B phase, with the second, smaller peak between ºC attributed to the desorption of hydrogen from NdH 2 to Nd [Williams et al. (1991), Ragg et al. (1997)]. Figure 6.5.Desorption trace of HD-treated NdFeB upon heating in vacuum at 15 ºC min
169 Chapter 6 Development of Microstructure Part-Disproportionated Structure The next stage of the overall processing is the HDDR reaction. HDDR is split in to two main reactions as described in the literature review; the disproportionation and the recombination reactions. The disproportionation reaction is used to dissociate the Nd 2 Fe 14 B into its constituents by exposing the sample to hydrogen at elevated temperatures as shown in equation 6.1. where x approaches 1.0 at elevated temperatures Equation 6.1. During the disproportionation stage, the pressure was increased at a set rate of 16 mbar min -1 up to the set processing pressure, in this case 1500 mbar. In order to track the disproportionation reaction, the temperature and hydrogen flow rate into the reaction vessel were measured using a thermocouple and a mass flow controller respectively. Figure 6.6 shows the hydrogen flow rate into the reaction vessel as the pressure is increased from 0 to 1500 mbar. It can be observed that there were two clear absorption peaks, one which occurs almost instantly and one that occurs between ~ mbar. The first peak is assumed to be associated with the uptake of hydrogen by the Nd-rich phase to create pools of NdH 2 at very low partial pressures of hydrogen, i.e. completed below 200 mbar. The second peak is associated with the reaction that occurs in equation 6.1, where the Nd 2 Fe 14 B is dissociated into NdH 2, αfe and Fe 2 B. These assumptions are in agreement with the work by Luo et al. (2009) where hydrogenation of NdDyFeCoNbCuB-type magnets was studied by differential 156
170 Chapter 6 Development of Microstructure scanning calorimetry (DSC). The DSC trace showed that there are two clear absorption peaks, the first related to hydrogenation of the Nd-rich phase and the second attributed to hydrogenation of the tetragonal matrix phase. Figure 6.6. Measurement of hydrogen flow rate into the system along with pressure during the disproportionation reaction, with two clear peaks of hydrogen absorption. In order to understand the way that the matrix phase disproportionates in more detail the reaction was halted by quickly cooling the furnace and switching from hydrogen to vacuum during the pressure ramp stage of the disproportionation reaction at ~700 mbar. By doing this it was possible to view the route taken by hydrogen during the disproportionation reaction. Figure 6.7 shows the point at which the process was halted during the HDDR reaction as the thick vertical red line in the reaction schematic. 157
171 Chapter 6 Development of Microstructure Figure 6.7.Schematic showing the point at which the process is halted during the HDDR reaction to image the part-disproportionated structure. Initial work by Sugimoto et al. (1999) suggests that in a cast starting material, the hydrogen will use the Nd-rich grain boundary phase to transport itself throughout the bulk of the material during HDDR. Initial assumptions for the sintered material would suggest that hydrogen would take the same route through the sintered microstructure, even though the grain boundary phase will be thinner than that in the cast microstructure providing more narrow channels for hydrogen. The partly disproportionated structure was imaged using a Jeol 6060 SEM and a Jeol 7000 HR-SEM as shown in figures

 multiple particles separated by cracks caused during hydrogen decrepitation at")
172 Chapter 6 Development of Microstructure A Cracks caused during hydrogen decrepitation B Region where Ndrich grain boundary phase has disproportionated Crack caused by disproportionation Region of unreacted Nd 2 Fe 14 B phase Disproportionation around a triple point Regions where disproportionation of Nd 2 Fe 14 B phase is complete Figure 6.8. Backscattered SEM micrographs of a partly disproportionated region of NdFeB showing A) multiple particles separated by cracks caused during hydrogen decrepitation at x230 magnification and B) a highlighted area around a crack in the particle where the disproportionated can be clearly observed at x2000 magnification. 159
173 Chapter 6 Development of Microstructure Figure 6.8 shows a region where hydrogen decrepitation induced cracking can be clearly observed. In image A there is a clear region (circled in blue) where the crack has not propagated completely and dark grey regions can be observed from the crack in towards the centre of the particle. One area where this was visible has been expanded to x2000 magnification and is shown in image B. On closer inspection around this cracked region it can be observed that there are areas where the matrix phase appears to have disproportionated. Moving further away from the crack, the grain boundary phase has also started to initiate disproportionation both along grain boundaries and from triple points. As the distance from the crack into the particle increases, the amount of disproportionation decreases, such that the matrix phase has reacted next to the crack, but on the left hand side of the image, the Nd 2 Fe 14 B clearly remains unreacted. This would suggest that hydrogen absorption and disproportionation initiates from rough, textured surfaces such as cracks, then the hydrogen is transported through the particle along the grain boundary phase and around triple points, which in turn begins to disproportionate. Figure 6.9 shows the edge of a particle where it can clearly be observed that the hydrogen has entered from the edge of the particle and worked its way through the grain boundary phase and triple points, leaving much of the grey Nd 2 Fe 14 B matrix phase intact. Towards the edge of the sample, some of the matrix phase has started to disproportionate to a greater extent, which is observed as thick regions of dark-grey disproportionated structure, whereas further into the sample, only very thin areas are transformed and the matrix phase is completely unreacted. This suggests that the mobility of hydrogen through the Nd-rich phase is much higher than through Nd 2 Fe 14 B and hence the whole sample will not all react simultaneously. If this was not the case, all of the material would disproportionate equally from the edge of the particle towards the middle at the same rate, not just the grain boundary 160

174 Chapter 6 Development of Microstructure phase as observed here. From the analysis of figures 6.8 and 6.9 it can be said that the grain boundaries are acting as pathways for hydrogen into the particle and the HDDR reaction initiates from the grain boundaries and triple points, indicating that the HDDR reaction is diffusion controlled. This agrees with the work by Gutfleisch et al. (1994) where it was shown that the neodymium from the grain boundaries diffuses into the matrix phase to aid with the disproportionation process. In this case the grain boundary phase has initiated disproportionation of the matrix phase followed by diffusion of the neodymium into the matrix phase. Nd from large pools such as those located at triple points also diffuse into the matrix phase to aid with the disproportionation. Disproportionation at grain boundary Regions where disproportionation of Nd 2 Fe 14 B phase is completed Disproportionated triple point Regions of unreacted Nd 2 Fe 14 B phase Figure 6.9. Backscattered SEM micrograph of the partly disproportionated sample showing the route taken by hydrogen through the material during the reaction at x1500 magnification 161

175 Chapter 6 Development of Microstructure To get a better image of the areas where disproportionation has initiated along grain boundaries and at triple points a Jeol 7000 HR-SEM was used. Figure 6.10 shows one of these regions where the grain boundaries and triple points are clearly disproportionated and the reaction is diffusing towards the centre of a matrix grain. Pool of Ndrich hydride Unreacted Nd 2 Fe 14 B Phase Disproportionated triple point Disproportionated grain boundary phase Figure HR-SEM image exhibiting disproportionated triple points and grain boundaries with the reaction diffusing into the central matrix phase grain highlighted by green arrows at x8000 magnification. The disproportionation reaction in this case is clearly observed at high resolution as the structure can be identified as a rod-like structure as previously reported by Gutfleisch et al. (2000) which was said to be vital for the inducement of anisotropy [Gutfleisch et al. (1999)]. In figure 6.10 the direction of the disproportionation reaction diffusing from the grain 162
176 Chapter 6 Development of Microstructure boundary and the triple point into the Nd 2 Fe 14 B grain is signified by the green arrows. The disproportionation reaction that is growing from the triple point appears to have grown from the centre of that triple point, which is evident due to the shape of the diffused reaction. At this point some of the triple points have not reacted or initiated disproportionation. Figure 6.11 shows HR-SEM micrographs of the edge of a partly disproportionated particle and an expanded region from this particle showing that disproportionation has initiated at a triple point and along grain boundaries along with the presence of unreacted NdH 2, which has also been observed in HDDR-treated cast materials by Kawashita et al. (2004). These images reiterate that the rate of reaction is different between the grain boundary, triple points and matrix phases. The green arrows indicate the direction of disproportionation reaction propagation from the centre of the triple point in towards the centre of the surrounding grains similar to that observed in figure In the bottom image there is also a clear piece of unreacted Nd-rich that is surrounded by a thin layer of the disproportionated phase, circled in red. The triple point which is white in appearance on the image, differs slightly compared to other similar regions within the sample (circled in light blue) where the near-white phases appear to have been swallowed up by the disproportionation reaction. At this point it is unclear whether the large unreacted triple points are likely to be drawn into the disproportionated structure, as proposed by Gutfleisch et al. (1994) or if it will remain unreacted throughout the entire HDDR reaction. 163

 and expanded region showing a disproportionated")
177 Chapter 6 Development of Microstructure Edge of particle Unreacted Nd-rich surrounded by disproportionated structure Disproportionated triple point Disproportionated grain boundary Figure 6.11.HR-SEM images of edge of particle (top) and expanded region showing a disproportionated triple point, grain boundaries and unreacted Nd-rich/Nd-hydride (bottom). 164


178 Chapter 6 Development of Microstructure It was also important to investigate how the disproportionation reaction was affected by particle size, as possible over-processing could occur if small particles disproportionate much faster than large particles. Figure 6.12 shows a particle ~60-80 µm wide where the disproportionation reaction can be clearly identified along grain boundaries and triple points in both backscattered and secondary electron imaging modes. Disproportionation reaction occurring along grain boundaries and diffusing into Nd 2 Fe 14 B phase. Unreacted Nd 2 Fe 14 B phase Figure Backscattered SEM micrograph of a small particle of NdFeB where the disproportionation reaction has started at grain boundaries and worked in towards the centre of the matrix grains (top) and same particle viewed in secondary electron imaging mode highlighting the reactions taking place at the grain boundaries. 165
179 Chapter 6 Development of Microstructure It can be observed from the backscattered image in figure 6.12 that the hydrogen has reacted in the same way as shown previously. However the regions of matrix phase that have disproportionated appear to be larger than in the bigger particles shown in figures 6.8 through 6.11, especially closer to the edges of the particle. The disproportionation in this particle has reacted in a way that the reacted grain boundaries are clearly visible in secondary electron imaging, also shown in figure The disproportionated regions appear darker than the matrix phase in BSE mode as it consists largely of α-fe, which is not as heavy as Nd 2 Fe 14 B, therefore it reflects less backscattered electrons than the matrix phase, appearing darker. Figures 6.13 and 6.14 also show backscattered HR-SEM micrographs of partdisproportionated small particles. The entire network of grain boundaries in both images has completely absorbed hydrogen, some of which have expanded and the disproportionation reaction has propagated into the matrix grains. In figure 6.13 the particle is very narrow at the bottom of the image and the disproportionation reaction is more prominent in this region. It is therefore clear that there is a risk of over-processing due to smaller particle sizes. The hydrogen reactions described in this section give evidence as to the absorption peaks observed in figure 6.6. This is evident because the Nd-rich grain boundary phase clearly absorbs hydrogen before the matrix phase, which can be attributed to the first absorption peak in figure 6.6. The disproportionation reaction is then initiated from these hydrided grain boundaries and triple points in towards the centre of the Nd 2 Fe 14 B matrix grains which can be attributed to the second absorption peak on the graph. 166


180 Chapter 6 Development of Microstructure Figure HR-SEM micrograph of a small particle where the disproportionation reaction is more prominent in the narrow section of the particle. Figure HR-SEM micrograph of a long, narrow NdFeB particle clearly showing complete reaction of the grain boundary phase network. 167

181 Chapter 6 Development of Microstructure Fully Disproportionated Structure Figure 6.15 below shows the fully disproportionated microstructure imaged using the Jeol 6060 SEM. The disproportionation was completed by increasing the hydrogen pressure to 1500 mbar and holding for 30 minutes. Region of unreacted Nd-rich/ Nd-rich hydride NdH 2 rods (white) in Fe matrix (grey) with finely dispersed Fe 2 B (black) Figure SEM micrograph in backscattered electron imaging mode of the fully disproportionated microstructure at x4000 magnification. This structure can be observed as white coloured rods of NdH 2, situated within a grey coloured iron matrix, with finely dispersed black regions of Fe 2 B, accompanied by some large (1-5 µm diameter) regions of Nd-rich/Nd-rich hydride that have not undergone disproportionation as previously shown by Gutfleisch et al. (2000) for cast alloys. This confirms from the part-disproportionated microscopy that some regions of Nd-rich do not 168
182 Chapter 6 Development of Microstructure react even during full disproportionation. This could be attributed to an excess of Nd within the material composition that is required to produce the Nd-rich grain boundary phase in the sintered microstructure but is not necessarily required to complete disproportionation of the matrix phase. An excess of Nd has been shown to be required for successful HDDR reaction by Kawashita et al. (2003) in order to achieve good magnetic properties. It was also observed in the work by Kawashita et al. (2004) that rounded pools of NdH 2 existed in the disproportionated structure of HDDR-treated annealed cast NdFeB starting materials. Alternatively the unreacted Nd-rich phase could be maintained due to them containing a high oxygen content. Kim et al. (2012) showed that the sintered microstructure consists of two types of Nd-rich grain boundary phase. One of these phases was a network of amorphous Nd-rich grain boundary phase. The other was in the form of Nd-rich triple points containing Nd 2 O 3. The regions of Nd-rich that remain unreacted in the current work could be the latter of the two grain boundary phases where the Nd 2 O 3 forms a barrier that stabilises the Nd-rich against disproportionation. This would leave the NdH 2 that does disproportionate being the former of the two phases that does not contain oxygen. It is likely that some of the Nd-rich triple points which have formed an oxide do not react in hydrogen during HD as the oxide is very stable. Therefore this will raise the melting point of the triple points beyond the temperature for processing in this section and therefore they remain intact. This cannot be the case for all of the triple points however as many of them diffuse fully into the disproportionate structure. The large regions of Nd-rich phase still present could be attributed to oxidation of triple points. Meakin et al. (2012) showed using confocal 3-D laser microscopy that oxidation of sintered NdFeB is nucleated and confined to Nd-rich triple points. 169

183 Chapter 6 Development of Microstructure Figure 6.16 shows the fully disproportionated structure as observed using the Jeol 7000 HR-SEM. It can be observed that disproportionated structure in this sample contains characteristic white rods of what can be assumed to be NdH 2 which have previously been identified as being vital for the production of anisotropic HDDR powder [Han et al. (2004)]. It was also possible to observe the small, rounded, finely dispersed black Fe 2 B phase that appears in a similar pattern as that previously shown by Gutfleisch et al. (2000). These fine Fe 2 B phases have also be shown to contribute to the production of anisotropy during HDDR by Honkura et al. (2005). The constituents were identified by a combination of shape as described in the literature and shade depending on mass of the phase, where heavier phases appear lighter in colour. NdH 2 rods embedded in an α-fe matrix Disproportionated structure Fine Fe 2 B distributed within the disproportionated structure Figure HR-SEM backscattered image of the disproportionated structure at x5500 magnification 170
184 Chapter 6 Development of Microstructure Part Recombined During the recombination reaction the pressure is lowered at a consistent 100 mbar min -1 down to the set recombination pressure. When this pressure is below the equilibrium pressure in the HDDR reaction the disproportionated mixture begins to recombine to form Nd 2 Fe 14 B grains. This reaction is highly endothermic, and can be measured accurately using a thermocouple, as shown in figure 6.17 below. In this case the temperature dropped from 885 ºC down to 830 ºC and the recombination reaction took 20 minutes to reach completion. Recombination is complete when the temperature returns back up to the process temperature and the vacuum in the system has recovered, meaning that no more hydrogen is leaving the sample. Figure Graph to show the endothermic reaction associated with the recombination of Nd 2 Fe 14 B from the disproportionated mixture. 171
185 Chapter 6 Development of Microstructure Similarly to the disproportionation reaction, the recombination reaction was stopped before completion to view the order in which the reaction takes place. To perform this successfully the recombination was halted by pinpointing the moment where the endothermic reaction has started and the temperature of the sample is at its lowest. Whilst under a low vacuum, the furnace was rolled off the sample to quickly cool it to below 500 ºC and prevent any further reaction from taking place. The position in the reaction at which this occurred is shown by the red line in figure 6.18 below. Figure Schematic showing the point at which the process is halted during the HDDR reaction to image the part-recombined structure Stopping the reaction at this point allowed nucleation of Nd 2 Fe 14 B grains and a small amount of growth in order to observe the difference between the disproportionated structure and the matrix phase. Figure 6.19 shows a HR-SEM micrograph of the partially recombined microstructure. Clear regions of Nd 2 Fe 14 B matrix phase can be observed surrounded by large 172

186 Chapter 6 Development of Microstructure regions of untransformed disproportionated structure which is also accompanied by large voids. These voids are assumed to be due to the HDDR-induced cavitation that was initially described by Williams et al. (1996) where the large regions of Nd-rich phase have been redistributed from triple points in the former microstructure around the newly created finer microstructure to create a network of narrow grain boundary phase around the newly created sub-micron grains. The shapes of the three voids circled in light blue are clear representations of a triple point from the former sintered microstructure Disproportionated structure not yet recombined Void where Ndrich phase has redistributed from triple point Recombined Nd 2 Fe 14 B grains Figure Backscattered SEM micrograph of a sample where the recombination reaction has started, small grains of Nd 2 Fe 14 B have nucleated, large cavities are visible where the Ndrich phase has been redistributed and some areas remain in their disproportionated state. 173

187 Chapter 6 Development of Microstructure Figure 6.20 shows an area of the partially recombined microstructure close to a crack through a particle. It appears that the region closest to the crack has a larger proportion of recombined Nd 2 Fe 14 B than the rest of the particle. This suggests that the recombination reaction is initiated close to rough surfaces and particle edges where there is likely to be a higher number of nucleation sites. This is similar to the way that the disproportionation of the matrix phase initiates more readily at particle edges. Along with the HDDR-induced cavitation there are also some large pools of unreacted Nd-rich still present at this point in the reaction. Figure Backscattered HR-SEM micrograph showing the partially recombined microstructure including large pools of unreacted NdH

188 Chapter 6 Development of Microstructure Figure 6.21 shows another particle edge, however there appears to be little difference in the proportion of recombined Nd 2 Fe 14 B between the particle surface and the particle centre. This suggests that the recombination reaction occurs simultaneously throughout the particle regardless of distance to the surface of the sample. There are however still large pools of unreacted Nd-rich distributed throughout the sample. Figure HR-SEM micrograph of the partially disproportionated microstructure at the edge of a large particle. In some specific regions, such as in figure 6.22, where the particles are smaller it is possible to see the mottled effect in secondary electron imaging mode.this is produced by pull-out of the Nd pools which are redistributed during the recombination reaction. In the backscattered image it is possible to observe small regions of grey Nd 2 Fe 14 B forming within the disproportionated regions in the areas that the mottled effect can be seen on the SEI image 175


189 Chapter 6 Development of Microstructure (Image A). There are larger regions of Nd 2 Fe 14 B about 1 µm in diameter that are fully transformed along with large visible voids associated with the redistribution of Nd-rich phase from pre-existing triple points in the sintered microstructure. Mottled effect where matrix phase is nucleating into small grains A Void left by redistribution of Nd-rich phase from a triple point B Recombined Nd 2 Fe 14 B Disproportionated mixture Figure HR-SEM micrographs of the partly recombined microstructure, including fine Nd 2 Fe 14 B grains, large voids and remaining disproportionated mixture, A) SEI image and B) backscattered image. 176

190 Chapter 6 Development of Microstructure Fully Recombined Structure Finally it is important to investigate the fully HDDR processed sample after recombination is complete. Figure 6.23 shows the fully HDDR processed sample in secondary electron imaging mode. The effect of the HDDR reaction on the sample can be clearly observed in this image as the fine microstructure is separated by very small regions of Nd-rich phase which have pulled-out during polishing of the sample. These small regions of pulledout Nd-rich appear as black dots which give the surface of the sample a mottled appearance that is characteristic of the HDDR reaction. Mottled effect associated with HDDR reaction Nd 2 Fe 14 B phase Cavitation induced by HDDR process Figure Secondary electron image at x2000 magnification of the mottled effect associated with the HDDR reaction where the microstructure has been refined 177
191 Chapter 6 Development of Microstructure This microstructural change and Nd-rich phase redistribution is confirmed by switching to backscattered mode where the fine network of Nd-rich phase can be observed as white dots and patches that cover the entire micrograph shown in figure 6.24 below. It is also possible in this image to observe areas of cavitation where the large pools of Nd-rich phase from triple points in the sintered microstructure have been redistributed around the finer HDDR microstructure and left a cavity where it used to be, which is matched up on the secondary electron image in figure It can also be observed that there are large pools and regions of Nd-rich (> 2 µm diameter) that remain unreacted from the initial sintered microstructure. This has created two different sizes for the Nd-rich phase, which is not typically observed when processing cast NdFeB materials which have a much lower oxygen content ( ppm). Nd-rich phase redistributed during HDDR reaction Nd 2 Fe 14 B phase Cavitation caused by redistribution of Nd-rich phase during HDDR reaction Large pool of unreacted Nd-rich Figure Backscattered SEM micrograph of the final HDDR microstructure exhibiting clear evidence of submicron grains, redistributed Nd-rich grain boundary phase and the cavitation associated with this. 178

192 Chapter 6 Development of Microstructure Overall Microstructural Transformation The overall transformation of microstructure is shown in figure 6.25 below. Image A shows the sintered microstructure with a grain size around 10 µm and image B shows the fully HDDR processed microstructure with a grain size closer to 1 µm. The full series of microstructural changes can be represented schematically as shown in figure A B Figure Backscattered SEM micrographs showing A) Starting sintered microstructure and B) Fully HDDR processed microstructure. 179


193 Chapter 6 Development of Microstructure Nd-rich triple point Nd 2 Fe 14 B Formation of NdH 2 at grain boundaries and triple points Disproportionation reaction along grain boundaries A B C Disproportionation at triple point F E D Disproportionation propagates from grain boundaries and triple points Unreacted Nd 2 Fe 14 B G H HDDR induced cavitation Unreacted Nd-rich Fine grained Nd 2 Fe 14 B Cavitation where Nd-rich is being redistributed Nucleated Nd 2 Fe 14 B grains Unreacted Nd-rich 180 Redistributed Nd-rich phase Figure Schematics showing the change in microstructure associated with the HDDR processing of sintered material.
194 Chapter 6 Development of Microstructure Figure 6.26 shows the step by step microstructural changes throughout the HDDR process schematically. Image A shows the starting sintered microstructure with Nd 2 Fe 14 B grain size ~10 µm. Image B shows the absorption of hydrogen along grain boundaries and into the triple points. Image C shows the hydrogenation and disproportionation initiating along the grain boundaries and at the triple points. Image D shows how the disproportionation reaction propagates from grain boundaries and triple points into the matrix phase leaving unreacted oxidised Nd-rich phase at two of the triple points. Image E shows the continuation of the disproportionation phase until image F where the sample is completely disproportionated into a mixture of NdH 2 and Fe 2 B in an α-fe matrix with the exception of the unreacted Nd-rich phase. Image G shows fine grains of Nd 2 Fe 14 B nucleating and recombining from the disproportionated mixture and the start of formation of cavitation. Finally image H shows the fully recombined Nd 2 Fe 14 B microstructure (grain size < 1 µm) with redistributed Nd-rich phase and clear HDDR induced cavitation. 181
195 Chapter 7 Equilibrium Point Identification and Recombination Chapter 7 RESULTS & DISCUSSION - EQUILIBRIUM POINT IDENTIFICATION AND RECOMBINATION The HDDR process has a large number of variables that can have an effect on the processing kinetics and microstructure which in turn affect the mechanical and magnetic properties of the resulting materials. These process variables include: Process temperature* Temperature ramp rate* Hydrogen pressure* Hydrogen pressure ramp rate* Hydrogen pressure hold times* Cooling rate *Can be different for the disproportionation and the recombination parts of the HDDR reaction. When designing a set of processing parameters it is important to investigate the effect of one variable at a time, whilst keeping the rest as constants. Changing too many variables simultaneously could cause conflicting results, as well as mis-interpretation of the results. A set of HDDR conditions was suggested by a former colleague in the magnetic materials group [Sillitoe (2009)] which was used as a starting point for this investigation. These processing conditions are shown in figure
196 Chapter 7 Equilibrium Point Identification and Recombination Figure 7.1. HDDR processing conditions designed by Sillitoe (2009) in the magnetic materials group These processing parameters consisted of a processing temperature of 910 ºC, with a heating rate of 15 ºC min -1, a hydrogen pressure ramp rate of 16 mbar min -1 up to 1000 mbar with a further hold time of 1 hour to complete disproportionation. The recombination was set with a hydrogen ramp rate of 100 mbar min -1 to a hold pressure of 100 mbar and was held for 20 minutes. After the hold time the hydrogen pressure was reduced to vacuum (~10-2 mbar) and the furnace rolled off the furnace tube containing the sample to encourage fast cooling of the sample and discourage excessive grain growth. The experiment was run so that the disproportionation start point could be calculated to determine the equilibrium point between the disproportionation reaction and the recombination reaction. To determine this equilibrium point the pressure was increased at 16 mbar min -1 using mass flow controllers until a sudden 183
197 Chapter 7 Equilibrium Point Identification and Recombination increase in flow rate was observed. The increase in flow rate is associated with absorption of hydrogen by the sample material and hence the onset of disproportionation. The equation related to this reversible reaction is: Disproportionation Nd 2 Fe 14 B + (2±x)H 2 2NdH (2±x) + Fe 2 B + 12Fe ± H Recombination [Equation 7.1] Where H is the reaction enthalpy [Rybalka et al., (2003)] Figure 7.2 shows the hydrogen flow rate, pressure and temperature during the disproportionation reaction which were monitored by mass flow controllers, a pressure gauge and a thermocouple respectively during disproportionation of 20 g of composition A. Exotherms Linear pressure rise with filling HDDR rig 700 mbar Reaction Start Figure 7.2. The change in temperature, pressure and hydrogen flow during the disproportionation reaction, allowing the equilibrium point to be observed. 184
198 Chapter 7 Equilibrium Point Identification and Recombination During hydrogenation it was observed that there were three exothermic reaction peaks, similar to those shown by Luo et al. (2009) using DSC. The initial sharp exothermic reaction is thought to be associated to the absorption of hydrogen into the grain boundary phase as the hydrogen uses the Nd-rich phase to transport itself through the material, as shown in chapter 6. The second small exotherm is assumed to be the initial absorption of hydrogen into the Nd 2 Fe 14 B grains after the Nd-rich phase has completed the absorption of hydrogen and the third broad exotherm is related the disproportionation of the matrix phase, both of which combine into a single increase in hydrogen flow rate. The disproportionation reaction was observed to begin at 700 mbar, where the reaction shifts to the right hand side of equation 7.1. As the pressure is increased further away from the equilibrium point the driving force for the reaction increases, this could lead to a change in the reaction kinetics and produce an undesirable microstructure with poor magnetic properties due to over-processing. To avoid possible over-processing that could occur during the hold stage of disproportionation the pressure was set to 800 mbar, which is 100 mbar above the reaction initiation pressure. The total reaction time was set to 2 hours as it was previously demonstrated by Sillitoe (2009) that a 2 hour reaction time was optimum for complete disproportionation. The disproportionation reaction was then set as a constant in order to investigate the effect of the recombination conditions on the microstructure and magnetic properties of the resultant powder. To investigate the recombination reaction a range of different pressures were compared to analyse reaction rates by studying hydrogen flow out of the sample using mass flow controllers. Evacuation of hydrogen below 300 mbar using mass flow controllers was found to be difficult due to the orifice size being too small which could lead to excessive grain growth after completion of recombination. In later work manual evacuation of the reaction vessel was performed by opening a valve linked directly to a rotary vacuum pump. Figure


199 Chapter 7 Equilibrium Point Identification and Recombination shows the pressure, sample temperature and net flow of hydrogen out of the system during initial recombination testing. Endotherm start Figure 7.3. Variation of temperature and hydrogen flow rate indicating a second reaction occurring at 300 mbar accompanied by a large endothermic spike. It can be observed from figure 7.3 that during the 350 mbar hold time, hydrogen is clearly desorbed from the sample however there is no observed change in temperature. However during initial testing it was also observed that another separate reaction occurred at around 300 mbar during the hydrogen removal step after the completion of recombination. This is signified in figure 7.3 by a small drop in temperature followed by a large endothermic temperature peak. This reaction could be associated with the secondary reaction where hydrogen is desorbed from the neodymium hydride in the grain boundary phase, as shown below in equation 7.2. This reaction is assumed to be the reverse reaction during the initial stage of disproportionation as observed in figure
200 Chapter 7 Equilibrium Point Identification and Recombination Desorption - Absorption Nd + H 2 NdH 2 [Equation 7.2] It has previously been shown by Williams et al. (1991) that desorption from disproportionated NdFeB-type alloys occurs in two clear steps. The first of which is associated with desorption of hydrogen from the Nd 2 Fe 14 B phase and conversion of NdH ~3 to NdH ~2, the second is the desorption reaction shown in equation 7.2. At this point it was unclear how this reaction would affect the recombination of the Nd 2 Fe 14 B phase if they occurred simultaneously, hence the recombination pressures were kept above 300 mbar, as shown in figure 7.4. Fastest Rate Figure 7.4. The relationship between hydrogen flow out of the sample at different recombination pressures. The recombination in this instance was performed at 500 mbar, 400 mbar and 350 mbar in order to measure the rate of desorption of hydrogen during the recombination reaction, whilst avoiding possible over-processing at lower pressures and avoiding the 187
201 Chapter 7 Equilibrium Point Identification and Recombination reaction described by equation 7.2. It can be observed from figure 7.4 that recombination at 350 mbar produced the highest flow rate of hydrogen out of the sample (i.e. it has the steepest slope for total flow out). This data was put into figure 7.5 in order to calculate the time taken to remove 500 cc of hydrogen from the sample under each of the recombination pressures. Figure 7.5 Time taken to remove 500cc hydrogen extrapolated from hydrogen removal rate data. It can be observed that with a recombination pressure of 500 mbar, the extrapolated data would put full reaction time at way over 100 minutes, and most likely between minutes as less than 150 cc had been removed within the 100 minutes. A recombination pressure of 400 mbar reduced the reaction time to 90 minutes which is still a long process time, however a recombination pressure of 350 mbar could remove 500 cc of hydrogen in 30 minutes, which is similar to the reaction time used in the initial experiments by Sillitoe (2009). Sugimoto et al. (1999) showed that for conventional HDDR treatment of cast alloys, recombination times up to 60 minutes had little negative effect on the magnetic properties of the samples. However for v-hd treatment as used in this work, and a HDDR treatment 188
202 Chapter 7 Equilibrium Point Identification and Recombination temperature of 950 ºC, the remanence increases from 0.8 T to 1.4 T by increasing recombination time from 0 to 20 minutes, however increasing the recombination time to 40 minutes results in a linear drop in remanence to 1.2 T. Therefore it can be said that recombination hold times of less than 40 minutes are optimal for production of high remanence magnets. With the recombination pressure set at 350 mbar, it was important to consider the time for which this pressure should be held for and the rate at which the remaining hydrogen should be removed from the system after the completion of recombination, i.e. applying manual evacuation after 350 mbar reaction was complete. This would give an insight into the effect of the reaction described by equation 7.2 on the overall recombination reaction. Sugimoto et al. (2002) showed that the rate of hydrogen pressure reduction during recombination (s-dr) is an important factor with regards to obtaining good magnetic properties. The recombination pressure hold times at 350 mbar were set to 10, 15, 20, 25 and 30 minutes using mass flow controllers, followed by a hydrogen removal rate of 100 mbar min -1 (now referred to as slow evacuation ) using manual evacuation where the 300 mbar endothermic peak would be passed through slowly. In another trial the same recombination hold times at 350 mbar were used followed by a hydrogen removal at 1000 mbar min -1 (now referred to as fast evacuation ) using manual evacuation where the endothermic reaction would be passed through rapidly. Figure 7.6 shows a schematic representation the recombination reaction and evacuation procedure. 189
203 Chapter 7 Equilibrium Point Identification and Recombination Figure 7.6. Schematic representation of the 350 mbar recombination reaction followed by the manual evacuation pressure reduction. The hysteresis loops of each of the samples can be found below in figure 7.7 which show the degree of anisotropy possessed by those samples. The data in these loops is uncorrected for self-demagnetisation within the VSM open-loop system due to the irregular particle morphology of HDDR powders. It should be noted that the hysteresis loops are in some cases asymmetric about the origin, especially in the hard direction of magnetisation. This is possibly due to rotation of the sample in the sample holder as the direction of the applied field is reversed as there is little friction in between the wax-bound sample and it requires less energy to rotate the sample than demagnetise the sample. It can be observed that there is a large amount of anisotropy in all of the samples recombined for 15 minutes or more (C-J), with both fast and slow evacuation rates, which is the difference in shape between the hysteresis loop of the easy direction and the hard direction. The 10 minute processing shows almost zero anisotropy as the easy and hard directions have overlapping hysteresis loops. This 190
204 Chapter 7 Equilibrium Point Identification and Recombination suggests that short processing times does not allow nucleation of a sufficient proportion of aligned grains to produce maximum alignment, hence maximum remanence cannot be achieved. A B C D E F 191
205 Chapter 7 Equilibrium Point Identification and Recombination G H I J Figure 7.7. Hysteresis loops of samples HDDR processed with varying recombination hold times and subsequent evacuation rates. A) 10 minute slow, B) 10 minute fast, C) 15 minute slow, D) 15 minute fast, E) 20 minute slow, F) 20 minute fast, G) 25 minute slow, H) 25 minute fast, I) 30 minute slow and J) 30 minute fast. It can be observed that the shape of the hysteresis loops, especially in the easy direction of magnetisation is the same for all samples with a recombination time of 15 minutes or more, displaying a typical S shape. The hysteresis loops in the hard direction of magnetisation vary as the recombination time is increased, for example the sample processed for 10 minutes displays the same S shape as in the easy direction due to the isotropic nature of the powder produced. As the recombination hold time is increased, the hard direction loops become narrower, as seen for the 15 minute slow recombination sample in figure 7.7c, before reverting away from the S shape. This change in shape and narrowing of the hard direction loop shows the increase of anisotropy with recombination processing time, which can be attributed to the nucleation of fully aligned Nd 2 Fe 14 B grains and 192
206 Chapter 7 Equilibrium Point Identification and Recombination completion of recombination. The shape of the hard direction loops for each hold time are the same, with the exception of the 15 minute recombination reaction, where the slow removal rate exhibits a narrow S shape but the fast removal rate does not. It should be noted that there is clearly an offset in x-axis intercepts between the positive and negative directions in the above hysteresis loops. This could be attributed to a combination between the angle of the sample during measurement in the hard direction as the sample rod is slightly bent and also rotation of the sample within the sample holder during the measurement. In order to compare the individual properties with the processing conditions effectively, graphs have been formulated to give a greater insight as to any patterns that occur; these are shown in figures 7.8, 7.9 and The data taken from the hysteresis loops shown in figure 7.7. Figure 7.8 shows the variation of energy product with recombination time for the slow evacuation and the fast evacuation routes. It can be observed that in both cases, energy product increases with recombination hold time up to 25 minutes, at which point the energy product drops. The drop in energy product could be attributed to over-processing of the powder when the recombination reaction is complete, but the hydrogen pressure is maintained which could lead to unwanted grain growth. Grain growth has been associated with reduction of coercivity due to the coercivity mechanism of the material moving away from single domain particles as they grow larger than the critical grain size of 0.3 µm [Livingston (1985)] as shown by Chen et al. (2003). Below 25 minutes the remanence is low which is assumed to be due to the incomplete recombination process, hence there are fewer Nd 2 Fe 14 B magnetic grains in the material. It can also be noted that for every recombination hold time, the fast 193
207 Chapter 7 Equilibrium Point Identification and Recombination evacuation process produces higher energy product values than the slow evacuation process. This gives the impression that the desorption of hydrogen from NdH 2 at 300 mbar has a large effect on the magnetic properties, passing through it quickly seems to enhance the magnetic properties, and therefore at this point it can be assumed that passing through this reaction slowly is detrimental to the overall magnetic properties of the sample. The overall difference between the slow and fast evacuation procedures could instead be due to possible grain growth that has occurred between recombination and quenching, i.e. the hydrogen evacuation time. Figure 7.8. The variation of BH (max) with recombination time and subsequent hydrogen removal rate. The energy product is calculated from the combination of remanence and coercivity; hence it is important to compare the effects of recombination time on those individual properties. 194
208 Chapter 7 Equilibrium Point Identification and Recombination Figure 7.9 shows the variation of remanence with recombination hold time. It has the same shape and pattern as the energy product graph. It is assumed that over-processing has occurred beyond 25 minutes which results in a drop in remanence, possibly due to a loss of anisotropy. As with the energy product, the remanence is higher for the fast removal of hydrogen than the slow removal of hydrogen, again showing that the 300 mbar reaction has a negative effect on the remanence. This pattern is similar to that shown by Sugimoto et al. (1999), however the maximum remanence in this case occurs after 25 minutes recombination time compared to 20 minutes for cast alloys as shown by Sugimoto and co-workers. For recombination times <25 mins there is a potential for under-processing where recombination had not completed within the given hold time, which would result in regions of disproportionated structure within the final microstructure. Figure 7.9. Graph to show the variation of remanence with recombination time 195
209 Chapter 7 Equilibrium Point Identification and Recombination The graph in figure 7.10 shows the variation of coercivity with recombination time. It can be seen that there is no specific pattern overall with the values of coercivity, although it is apparent that the coercivity is very low in comparison to what can be achieved through HDDR treatment of both cast and sintered NdFeB starting materials. Coercivity values in the region of and in excess of 1000 ka m -1 have been achieved by various research groups [Liu et al. (2009b), Jurczyk (1995) & Guth et al. (2012)], which indicated that the process variables were not optimised in this case. There are also no major differences between the slow evacuation route and the fast evacuation route, which can be noted by the two lines crossing each other 3 times. This low coercivity could be due to many factors, such as the high processing temperatures (greater than 900⁰C) which have been shown previously by Jurczyk et al. (1999), Kawashita et al. (2003) and Sugimoto et al. (1999) to produce NdFeB powders with low coercivity. Alternatively the low coercivity could be caused by the disproportionation time, either where holding the sample under hydrogen for extended times after completion of disproportionation leads to over-processing or too short holding time where disproportionation is incomplete. 196
210 Chapter 7 Equilibrium Point Identification and Recombination Figure Graph to show the variation in coercivity with recombination time. To justify the results achieved it is imperative to analyse the microstructure of each of the samples to investigate grain size, distribution of the Nd-rich grain boundary phase and the presence of unidentified phases. Scanning electron microscopy was used in backscattered electron mode to analyse the samples, as shown in figure
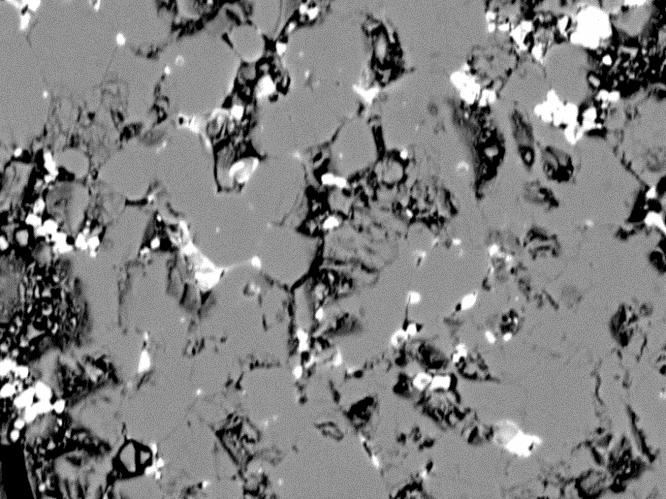
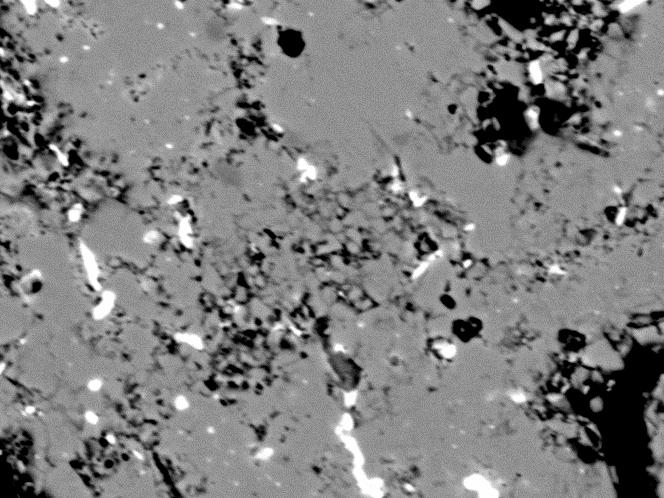
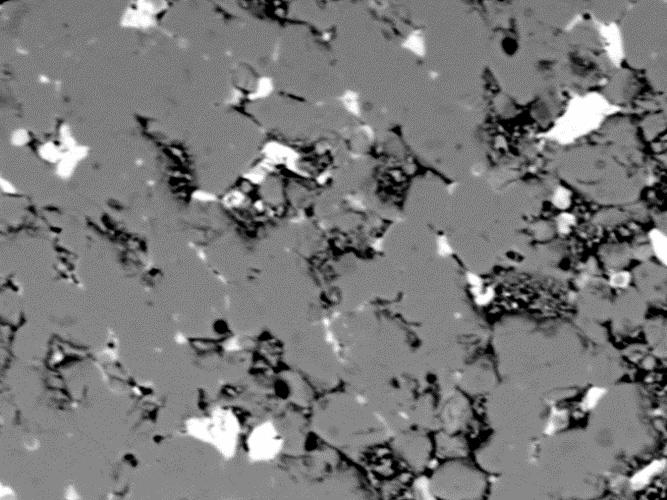
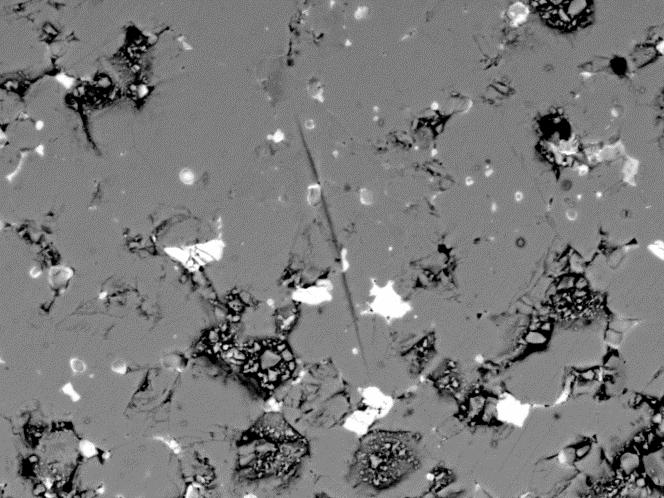
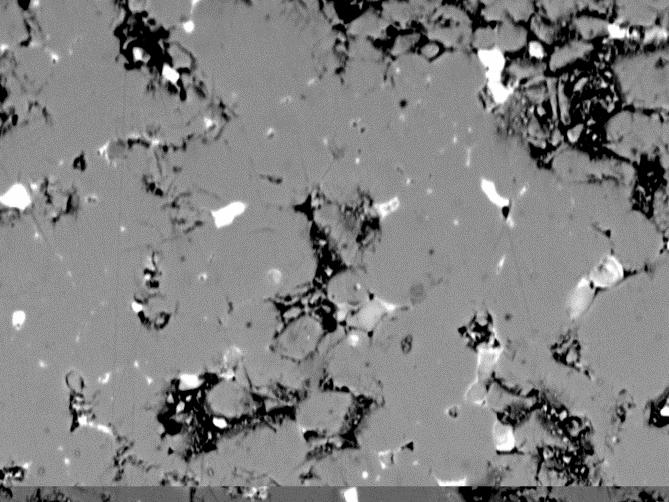

211 Chapter 7 Equilibrium Point Identification and Recombination A Nd 2 Fe 14 B phase Nd-rich Disproportionated structure B C 198

 20 minute fast, D) 25 minute fast and E) 30 minute fast In figure 7.")


212 Chapter 7 Equilibrium Point Identification and Recombination D E Nd 2 Fe 14 B phase HDDR-induced cavitation Redistributed Nd-rich phase Redistributed triple point Figure Backscattered electron images of HDDR samples processed with recombination times of A) 10 minute fast, B) 15 minute fast, C) 20 minute fast, D) 25 minute fast and E) 30 minute fast In figure 7.11 it can be observed that with increasing recombination hold time, the Ndrich grain boundary phase is increasingly distributed throughout the sample. Figure 7.11A, the 10 minute hold time, has large regions of Nd-rich phase within the Nd 2 Fe 14 B structure where there has not been a complete redistribution of grain boundary phase around a finer microstructure. This is also accompanied by areas where the recombination process is incomplete and the disproportionated structure is still present. This suggests that the poor magnetic properties are partly due to incomplete HDDR reaction. The Nd 2 Fe 14 B grains that 199
213 Chapter 7 Equilibrium Point Identification and Recombination are present appear to be much greater than the 0.3 µm single domain particle grain size associated with HDDR processed NdFeB as the redistribution of the Nd-rich phase is much coarser than expected. As the processing time is increased there is still evidence of incomplete recombination and large regions of Nd-rich phase until the 25 minute and 30 minute processing times, which show a higher degree of Nd-rich redistribution than the shorter processing times however the grain size still appears to be much larger than 0.3 µm. The large regions of Nd-rich phase still present could be attributed to oxidation of triple points. Meakin et al. (2012) showed using confocal 3-D laser microscopy that oxidation of sintered NdFeB is nucleated and confined to Nd-rich triple points. Woodcock et al. (2012) used finite element modelling, TEM and SEM to analyse these oxidised regions, showing that they acted as nucleation sites for reverse domains, leading to a reduction in coercivity. The low coercivity exhibited by the samples in this work could be partly due to this oxidation effect and nucleation of reverse magnetisation domains. The redistribution of Nd-rich phase is always accompanied by HDDR-induced cavitation which can be seen in detail in figures 7.11D and 7.11E, the 25 and 30 minute hold times, where the Nd-rich phase from former grain boundaries and triple points has left a void as it was redistributed. This variation within the microstructure can explain the variation of magnetic properties between all of the samples. The apparent large grains evidenced by lack of Nd-rich redistribution in these samples could also be due to incomplete disproportionation due to the low hold pressure chosen for these experiments. This would agree with the work by Kwon and Kim (2006) where it was found that a low disproportionation pressure resulted in incomplete disproportionation, however a high disproportionation pressure resulted in improved coercivity but poor alignment towards the point where the samples became isotropic. Following on from this it 200
214 Chapter 7 Equilibrium Point Identification and Recombination would be important to investigate the kinetics of the disproportionation reaction to ensure completion of the disproportionation stage before the onset of recombination. This may help to reduce the grain size down towards the ideal 0.3 µm associated with the ideal HDDR treated NdFeB. Figure 7.12 shows the microstructures of the 25 minute slow and the 30 minute slow evacuation samples. It can be observed that both of these samples appear to exhibit a large grain size (> 10µm) which is caused by grain growth as the sample is held at the processing temperature for a longer time than fast the evacuation method after completion of recombination. This could be the part of the reasoning behind the reduced magnetic properties from the fast evacuation to the slow evacuation as larger grains do not exhibit the single domain particle coercivity mechanism. The 30 minute slow evacuation sample shows evidence of faceted grains where the sample has been over-processed. This effect has been shown by McGuiness et al. (1990) where rectangular or flat-sided grains in the order of µm form during disproportionation at temperatures >835 ºC using c-hddr. Samples containing these grains exhibited coercivity values <600 ka m -1, compared to ~1000 ka m -1 exhibited by samples processed at <800 ºC with no faceted grains. 201
 25 minute slow and B) 30 minute slow recombination.")

215 Chapter 7 Equilibrium Point Identification and Recombination A Large Nd 2 Fe 14 B grain HDDR-induced cavitation Small Nd 2 Fe 14 B grains B Large faceted Nd 2 Fe 14 B grain Large Nd 2 Fe 14 B grain Small Nd 2 Fe 14 B grains Figure Backscattered electron SEM micrographs of HDDR treated samples with varying recombination parameters. A) 25 minute slow and B) 30 minute slow recombination. The fine grain structure that can be seen in all of these microstructures however is not ultrafine which would be expected from HDDR processed powder. This suggests that either the sintered starting material did not fully disproportionate due to the low disproportionation pressure used, or the material has not fully recombined but grain growth has occurred during hydrogen removal after recombination, meaning that this hydrogen removal process has a 202
216 Chapter 7 Equilibrium Point Identification and Recombination large effect on microstructure. Further increasing the hydrogen removal rate or quenching earlier in the process could solve this problem. From this work it can be concluded that the recombination stage of the HDDR reaction has a very large influence on the microstructure and magnetic properties of the resultant sample. Specifically it appears that although the recombination stage of the HDDR reaction affects both the remanence and coercivity of the resultant powder, there is only a clear pattern emerging in the remanence values, whereas the coercivity values appeared more random. These findings agreed with the work by Sugimoto et al. (2002) that hydrogen pressure reduction rate during recombination is important to obtain good magnetic properties from cast alloys during d-hddr. In order to produce a sample with the ideal microstructure and magnetic properties it is imperative to keep tight control over the processing temperature, recombination hold time and hydrogen removal rate to avoid large and faceted grains which lead to poor magnetic properties. Reducing the processing temperature and ensuring complete disproportionation could be vital in order to recover the coercivity of the starting sintered material. It is therefore necessary to investigate the disproportionation stage and the effect of processing temperature to try to improve the coercivity. It has been suggested by Rybalka et al. (2003) that the HDDR treatment temperature is the overall kinetic controlling factor and therefore it could have the greatest effects on microstructure and magnetic properties of the resultant powder. This is the focus of the following chapter. 203
217 Chapter 8 Effect of HDDR Treatment Temperature Chapter 8 RESULTS & DISCUSSION - EFFECT OF HDDR TREATMENT TEMPERATURE Rybalka et al. (2003) suggested that the processing temperature is the kinetic controlling factor for the HDDR reaction for cast alloys, which will have an effect on the coercivity of the resultant powders. Therefore in this chapter the effect of temperature was assessed to try to optimise this for processing of sintered magnets. A set of processing parameters had been suggested by Sillitoe (2009) during a final year project using sintered blocks of composition A (Nd 13.4 Dy 0.7 Fe 78.6 Al 0.7 Nb 0.4 B 6.2 (atomic %) with an oxygen content of 2665 ppm and traces of Pr 0.04 at%, Cu 0.04 at%, Mn 512 ppm, Si 427 ppm and N 9 0ppm). The hydrogen decrepitated sample was heated under vacuum to the desired processing temperature at a rate of 15 ºC min -1 for all temperatures. Hydrogen was then introduced at 16 mbar min -1 to a set value of 1000 mbar and held for 1 hour to encourage complete disproportionation. The overall disproportionation time was 2 hours. The pressure was then reduced to 100 mbar at a rate of 100 mbar min -1 and held for 20 minutes before reducing the pressure to vacuum and subsequently quickly cooling the sample by rolling the furnace off the furnace tube. These parameters are shown schematically in figure 8.1. Following on from this work, this set of HDDR reaction parameters was used to study the effect of treatment temperature on the kinetics of the HDDR reaction by heating the samples of composition A to temperatures between ºC. 204
218 Chapter 8 Effect of HDDR Treatment Temperature Figure 8.1.Schematic to show processing parameters for investigating the effect of processing temperature on HDDR [Sillitoe (2009)]. The disproportionation reaction was measured using mass flow controllers. Figure 8.2 shows a typical plot of hydrogen flow rate against pressure during the disproportionation reaction. The horizontal orange line indicates the flow rate associated with filling the reaction vessel at 16 mbar min -1. The reaction start is the point at which the flow rate rapidly increases above this orange base line, and is indicated by the green vertical line. As the disproportionation nears completion the hydrogen flow rate reduces to that of the horizontal base line. Once the flow rate crosses this line, and stays below it, the reaction is complete, as signified by the red vertical line on the image. 205
219 Chapter 8 Effect of HDDR Treatment Temperature Figure 8.2. Plot of hydrogen flow rate against pressure during the disproportionation reaction showing how reaction start and finish points are calculated. A graph was plotted, figure 8.3, showing the start and finish points of the disproportionation reaction at different temperatures. It was shown that the onset disproportionation pressure increased linearly with temperature, however the end point of the reaction increased almost exponentially. The disproportionation finishing point with regards to pressure exhibited a curve shaped line when compared to processing temperature, however above 880 ºC the disproportionation had not completed by the pressure limit of 1000 mbar. A separate experiment was performed at 930 ºC in order to identify the reaction finish point where the pressure was increased continually at 16 mbar min -1 until the disproportionation reaction had completed, allowing interpolation of the data to finish the curve, which can be seen as the dotted line in figure 8.3. This implies that increasing the processing temperature shifts the equilibrium point of the disproportionation reaction to a higher pressure. This finding is in agreement with the NdFeB phase diagram for HDDR, as shown in figure
220 Chapter 8 Effect of HDDR Treatment Temperature The increasing distance between the start and finish point of disproportionation also implies that the reaction is slowed down by increasing reaction temperature. This is in contrast to the findings of Didus et al. (2003), who found that increasing the processing temperature speeds up the disproportionation reaction for cast alloys, however that was using the c-hd route of disproportionation. The kinetics of disproportionation vary greatly between the c-hd and v- HD routes and also between the processing of cast alloys and sintered magnets. Figure 8.3. Pressures associated with the start and finish points of the disproportionation reaction at varying process temperatures. The arrows indicate incomplete disproportionation upon reaching 1000 mbar and the dotted line is interpolated using the data from the 930 ºC experiment. 207
221 Chapter 8 Effect of HDDR Treatment Temperature Disproportionation Figure 8.4. NdFeB phase diagram for HDDR treatment [Takeshita (1995)] The magnetic properties achieved at each of the processing temperatures are summarised in figure 8.5 below, including remanence, coercivity and maximum energy product up to 890 ºC. It can be observed that between ºC the values for all three magnetic properties are very low, however increasing the temperature to 880 ºC produced peak values for remanence, coercivity and energy product. Above 880 ºC the properties are vastly reduced, which is likely to be due to the incomplete disproportionation at 1000 mbar. 208
222 Chapter 8 Effect of HDDR Treatment Temperature Figure 8.5. Variation of remanence, coercivity and maximum energy product with processing temperature using a disproportionation pressure of 1000 mbar. The main issues that arose from this work were that a processing pressure of 1000 mbar was too low for temperatures above 880 ºC as full disproportionation was not achieved, which was also evidenced in the work in chapter 7 of this thesis. Therefore the processing conditions were changed slightly to accommodate this. The overall processing time was kept the same, however the disproportionation reaction was taken to 1500 mbar at 16 mbar min -1 to encourage full disproportionation at higher temperatures and held for 30 minutes rather than 60 minutes, maintaining a total disproportionation time of 2 hours. The recombination process had also been altered to remove hydrogen at 100 mbar min -1 all the way to vacuum without a holding stage at 100 mbar. This was achieved using manual evacuation at pressures below 300 mbar, in line with the work from chapter 7. The desorption and recombination reaction in this set up was judged to have finished when the full vacuum was recovered as no further hydrogen was entrained within the material. This method of recombination was employed following on from the work in chapter 7 to ensure complete recombination and avoid possible under- or over-processing. The furnace tube is quickly 209
223 Chapter 8 Effect of HDDR Treatment Temperature cooled to prevent excessive grain growth. These processing parameters are shown schematically in figure 8.6. Figure 8.6. Altered processing parameters to allow full disproportionation at temperatures above 880 C. Another improvement in the processing was that the hydrogen decrepitation of 20 g of the sintered block was carried out in the same vessel as the HDDR reaction, avoiding any possible contact with air during transfer of the powder from the HD vessel to the HDDR rig via an argon controlled atmosphere glove box. The samples were only ever under an atmosphere of hydrogen or argon or under vacuum as the system was kept closed until the entire reaction was complete. The lack of contact with air in between hydrogen decrepitation and the HDDR reaction will significantly limit the chance of oxidation which is likely to be the cause of the lack of reaction with hydrogen at the triple points, as observed in chapter

224 Chapter 8 Effect of HDDR Treatment Temperature With the new set of processing parameters from figure 8.6, samples were processed with 20 C increments between C, the disproportionation absorption peaks of the samples are shown below in figure 8.7 where a clear pattern can be observed. At lower temperatures, C, the hydrogen absorption peak is tall and narrow, indicating that the reaction occurs very quickly. With increasing temperature the disproportionation peak can be observed to broaden, indicating that the reaction rate is slower as was previously observed earlier in this chapter. Figure 8.7. Hydrogen absorption peaks associated with the uptake of hydrogen during disproportionation measured using mass flow controllers at a range of temperatures between C. As with the findings of figure 8.3, the onset of disproportionation increases with an increase in temperature in a near-linear fashion, however the pressure required to initiate the reaction is lower than previously exhibited when the sample was transferred in air. This drop in initiation pressure could be attributed to the absence of oxides at grain boundaries and triple 211
225 Chapter 8 Effect of HDDR Treatment Temperature points such as Nd 2 O 3 and Nd(OH) 3 that can form on exposure to atmospheric conditions [Meakin et al. (2012)] during loading of the sample, which has now been eliminated by performing the HD and HDDR reactions in the same furnace tube. However as the samples had been exposed to air after hydrogen decrepitation, the hydrides at grain boundaries and triple points are much more reactive, as previously shown by Chun-lin et al. (2004). The reduction in reaction starting pressure is constant for all reaction temperatures and can be observed clearly in figure 8.8 between the blue and red data points. It can be deduced that it is likely that the formation of oxides impede the absorption of hydrogen by the Nd-rich grain boundary phase and triple points, which has been shown to act as a path to the subsequent disproportionation of the matrix Nd 2 Fe 14 B phase [Harris & Williams (2001)]. This effect was also shown in chapter 6 where some of the triple points within the samples did not react with hydrogen during the HDDR process. Figure 8.8. Variation of disproportionation start and finish points at varied temperatures between C when HD and HDDR processed in-situ with a comparison to the disproportionation start and finish points achieved in figure 8.3 where the samples were exposed to air. 212
226 Chapter 8 Effect of HDDR Treatment Temperature From figure 8.8 it is also clear that the disproportionation had been completed at pressures lower than 1500 mbar for all temperatures. Interestingly the reaction finish points for the samples processed at temperatures < 880 C are almost identical to those achieved in the aforementioned work displayed in figure 8.3. This suggests that the disproportionation reaction is controlled by the hydrogen pressure in the system and is not necessarily time dependent. Had the reaction been kinetically controlled then reaction finish points would also be reduced by avoidance of air exposure. The magnetic properties achieved by these samples are shown in figure 8.9, the hysteresis loops can be found in the appendix (Figures App.8.9A App.8.9F). It can be observed that there is a similar trend in properties, especially remanence and energy product, as those shown in figure 8.5, however, with a less drastic drop in properties with samples processed above 880 C. The increased properties of these high temperature samples can be attributed to the complete disproportionation achieved by increasing the reaction pressure to 1500 mbar. This agrees with the work by Kwon & Kim (2006) where they demonstrated that the hydrogen pressure needs to be high enough to allow for complete disproportionation, and that by tracking the absorption of hydrogen to ensure reaction completion, the magnetic properties have vastly increased in these samples. With these samples the variation of coercivity follows a smooth curve with a peak at 880 ºC and a value of 840 ka m -1, which was not the case in figure 8.5 where a sharp drop off was observed for HDDR performed above 880 ºC. This could be due to the lack of oxidation products in the sample having less effect on the coercivity by allowing a better redistribution of Nd-rich phase in liquid form during the HDDR process or it could be due to the fact that complete disproportionation was achieved. 213
227 Chapter 8 Effect of HDDR Treatment Temperature There is still a clear peak in the variation of remanence which suggests that the remanence is very dependent on processing temperature as well as the recombination kinetics as concluded in chapter 7. It would appear from figure 8.10 that the change in recombination parameters from the work in chapter 7 has resulted in guaranteed completion of recombination to produce the desired microstructure of the HDDR processed powder. This can be observed as the endothermic reaction associated with recombination has completed and the sample temperature has returned to the process temperature before the sample was quickly cooled. The shape of the maximum energy product curve suggests that it is mostly dependent on the remanence of the HDDR powder as it follows the same trend as the remanence rather than the smooth curve exhibited by the variation of coercivity with temperature. Figure 8.9. Variation of coercivity, remanence and energy product of the samples of composition A with processing temperature with a disproportionation pressure of 1500 mbar. 214
228 Chapter 8 Effect of HDDR Treatment Temperature Figure 8.10.Change in pressure and sample temperature during the recombination reaction measured using a pressure gauge and a thermocouple. The peak value of remanence occurs at 880 C with a value of 1.08(±0.02) T, which is accompanied by a maximum coercivity at the same temperature with a value of 840(±0.17) ka m -1 and hence a maximum (BH) max of 178(±0.5) kj m -3. These values are lower than those achieved by Luo et al. (2011) who produced HDDR powders from NdDyFeCoNbCuB sintered magnets using a DSC, leading to remanence of 1.13 T, coercivity of 1592 ka m -1, and energy product of kj m -3. However the magnets in the current work do not contain Dy which is known to increase coercivity. The demagnetisation quadrant for this sample is shown in figure 8.11 and exhibits significant anisotropy, with a large difference between the curve in the easy and hard directions of magnetisation. The demagnetisation curves will not exhibit perfect squareness that is achieved by the ideal sintered NdFeB magnet due to the use of the VSM as a measurement tool which is an open system where selfdemagnetisation occurs. Due to the irregular particle morphology of the powder produced it is not possible to calculate the exact self-demagnetisation factor required to correct the data. 215
229 Chapter 8 Effect of HDDR Treatment Temperature Figure Demagnetisation curves in Easy and Hard directions of magnetisation for the sample processed at 880 C with a disproportionation pressure of 1500 mbar. As the highest value for all magnetic properties was achieved at 880 C, as was the case in figure 8.5, it can be deduced that 880 C is the optimum processing temperature for sintered NdFeB of composition A. The microstructure of this sample is shown in figure HDDRinduced cavitation Oxidised triple point left after the disproportionation process Nd 2 Fe 14 B phase Redistributed Nd-rich phase Figure Backscattered SEM micrograph of a different area of the 880 ºC processed sample showing no signs of faceted grains. 216
230 Chapter 8 Effect of HDDR Treatment Temperature It can be clearly observed from figure 8.12 that the grain size of the HDDR processed microstructure is much lower than the 10 µm associated with the sintered microstructure. This is because there are two sizes of Nd-rich phase present, the large is associated with oxidised triple points left after disproportionation with the smaller sizes associated with the redistributed HDDR structure. Figure 8.13 shows another region of this sample in backscattered mode for phase contrast and secondary electron imaging mode to show the surface topology. It can be observed from both SEM micrographs that there are two large regions of HDDR-induced cavitation as previously described by Williams et al. (1996), which is shown by the dark black area in image 8.12A and black surrounded by white in figure 8.12B. This area can be attributed to cavitation rather than grain pull out due to the white regions around the void in secondary electron imaging mode due to the scattering of the signal that occurs with uneven surface relief such as that caused by cavitation. These features were also observed during disproportionation in chapter 6. The small black dots on the SEI image represent Nd-rich pull out during polishing and have no effect on the surrounding surface topology. 217
 backscattered electron mode and B) secondary electron")
 which would indicate over processing. However almost all of the other areas of the sample showed no signs of faceted grains.")
231 Chapter 8 Effect of HDDR Treatment Temperature A B HDDR-induced cavitation Faceted grains Figure SEM micrographs showing the microstructure of the sample HDDR processed at 880 ºC with a disproportionation pressure of 1500 mbar in A) backscattered electron mode and B) secondary electron imaging mode. In the bottom left of the images, it is clear to see that there are two large, faceted grains as previously shown by McGuiness et al. (1992) which would indicate over processing. However almost all of the other areas of the sample showed no signs of faceted grains. In this case the over-processing is likely to be due to either the hold time under hydrogen after the completion of disproportionation or grain growth that occurs after completion of 218
232 Chapter 8 Effect of HDDR Treatment Temperature recombination. In the case of over-processing during disproportionation, the process could be improved by finishing the disproportionation stage upon completion of hydrogen absorption or to begin the recombination step immediately upon 1500 mbar being reached. By stopping the hold time at 1500 mbar and starting the recombination straight away, these faceted grains could be avoided. Overall it can be observed that as HDDR processing temperature was increased, the pressure required to initiate disproportionation increased linearly, however the finish point increased almost exponentially. 219
233 Chapter 9 Reproducibility & Large Batches Chapter 9 RESULTS & DISCUSSION -REPRODUCIBILITY & LARGE BATCHES 9.1 Variation of magnetic properties within a batch The HDDR process can be difficult to control particularly with large batch sizes due to the changing pressures and temperatures during processing. This has previously been shown by Manwaring et al. (1994) on production of isotropic HDDR powder from cast starting alloys. The risk of inconsistent results intensifies with increased batch sizes due to disproportionation related exothermic and recombination related endothermic temperature fluctuations during the HDDR process on a large scale. Therefore it is important to monitor the reproducibility of the process by controlled sampling from each batch and by comparing batches against one another to ensure constant properties. When producing magnets it is important to understand how the powder varies within each batch along the powder bed as inconsistent properties could cause poor performance or possible failure of a product in service. It was previously shown in chapter 8 that processing temperature has a very large effect on the magnetic properties of HDDR processed sintered NdFeB, hence large exothermic/endothermic fluctuations are likely to result in a drop in remanence and also coercivity. When running the initial tests it was important to keep every part of the processing the same. This included sample size, processing temperature, times and pressures. In this case 20 g of hydrogen decrepitated composition A was used every time and was weighed accurately in a glove box under an argon atmosphere, before being transferred in air to the HDDR furnace. The samples were heated in vacuum at 10-2 mbar to 885 ºC at a rate of 15 ºC min -1. The disproportionation was achieved by introducing hydrogen at 16 mbar min
.")

234 Chapter 9 Reproducibility & Large Batches up to a pressure of 1500 mbar, and held at this pressure for a further 30 minutes. The recombination was set to remove hydrogen at 100 mbar min -1 until full vacuum was achieved (with the aid of a vacuum pump). Upon full vacuum the furnace was rolled off and the sample was quickly cooled in air. This is the same set of processing parameters used in the latter part chapter 8 and is again shown schematically in figure 9.1. Figure 9.1. Schematic showing the processing conditions used for the reproducibility study on NdFeB alloys of composition A. Firstly it was important to investigate the variability of physical and magnetic properties within a single batch. Batch 1 was processed using the conditions specified above from figure 9.1. When the process was completed the sample was removed from the furnace to reveal a bulk of agglomerated grey powder with a black coating on the upper surface, as shown in figure 9.2 below. The entire sample was crushed using a pestle and mortar to separate any particles that have agglomerated during the process into a powder of individual particles. The powder breaks up easily with very little force having been hydrogen 221
 were taken at random from the powder in order to measure their magnetic")


235 Chapter 9 Reproducibility & Large Batches decrepitated as part of the processing. Three small samples (< 100 mg) were taken at random from the powder in order to measure their magnetic properties using a VSM. Blackened coating Blackened coating Grey Bulk Grey Bulk Figure 9.2. Appearance of sample as removed from the HDDR furnace, consisting of grey bulk material with a blackened coating The magnetic properties in the easy direction of magnetisation of these three randomly selected samples are shown graphically figure 9.3. Figure 9.3.Variation of remanence, coercivity and maximum energy product of three random samples taken from HDDR batch
236 Chapter 9 Reproducibility & Large Batches It can be observed from figure 9.3 that there is a large variation of remanence, coercivity and maximum energy product across just three samples from batch 1. The remanence varies from sample 1 to sample 3 by 300 mt and the coercivity varies by over 100 ka m -1. Commercially this would be an unacceptable amount of variation, especially as sample 3 is lower both in terms of remanence and coercivity than samples 1 and 2. Batch 2 was produced using the exact same processing conditions as batch 1. It was again observed that there was a black coating on the NdFeB powder, along with a variation in particle size before and after grinding with a pestle and mortar. The batch was split into two smaller batches, one half of which was tested the same way as batch 1 where the powder was ground down to remove agglomeration and mixed together with 3 random samples taken. The other half of the sample was carefully separated by hand to take a sample of the black coating, a sample of fine particles, passed through a 100 µm sieve and a sample of coarse particles >100 µm. This would enable a further understanding of how particle size affects the magnetic properties and whether it could give an explanation of why there was such a large variation in results in batch 1. The magnetic properties achieved by these samples are shown graphically in figure

237 Chapter 9 Reproducibility & Large Batches Figure 9.4.Magnetic properties of samples taken from HDDR batch 2. Figure 9.4 shows the variation of coercivity, remanence and maximum energy product across six samples from HDDR batch 2, including the separated and carefully selected particles (coarse, fine and blackened). The standard samples 1-3 exhibit a reduced variation in both coercivity and remanence compared to that of batch 1, where the coercivity varies by 60 ka m -1 and the remanence varies by 120 mt. In this case the maximum remanence is 150 mt lower than the maximum remanence from the samples from batch 1 however the coercivity values are close to those produced by the samples from batch 1. It is evident that the particle size has little influence on the remanence and coercivity, however the black coating had very poor magnetic properties with a remanence of 130 mt and coercivity of 40 ka m -1. The coercivity and remanence are very close to zero and hence when mixed with the fine and coarse particles this will dilute the magnetic properties which is the case for samples 1-3 in batches 1 and 2. The variation of the results could be attributed to the quantity 224

238 Chapter 9 Reproducibility & Large Batches of black particles within each of the measured samples which were taken at random. With further mixing it is assumed that the magnetic properties of samples taken at random would even out. In order to eliminate the black layer from the magnetic material in batch 3 the blackened coating particles from the main bulk were removed and then three random samples were taken from the remaining powder after using a pestle and mortar to remove agglomeration. This was achieved by scraping the blackened layer from the bulk of the agglomerated powder with a scalpel, before the bulk is processed. The three samples used contained a mixture of coarse and fine particles as it would be impractical and time consuming to separate them in industry considering their magnetic properties are comparable. The magnetic properties of these three samples are shown graphically in figure 9.5. Figure 9.5. Variation of magnetic properties across three samples taken from batch 3 after removal of blackened material. 225
239 Chapter 9 Reproducibility & Large Batches Figure 9.5 shows the variation of coercivity, remanence and maximum energy product between three random samples from batch 3 after careful removal of the blackened material. It can be observed that there is a smaller difference between the highest and lowest values of both coercivity and remanence compared to the previous samples, leading to almost identical maximum energy products of all three samples. The coercivity values range from kam -1, however the remanence only varies by 10 mt which is significantly lower than the variation exhibited by samples from batches 1 and 2. This shows that by removal of the blackened material the variation of magnetic properties is significantly reduced and hence the results are more reliable. It can also be observed that the remanence and coercivity of the samples from batch 3 are higher than those of the random samples from batches 1 and 2, showing that the blackened material was responsible for the dilution of the magnetic properties as well as the variation. It can be assumed that the variation of properties within a batch containing the black particles could be reduced by homogenous mixing, however the magnetic properties would still be of lower value than if the black material was removed. As the black particles only exist on the surface of the bulk and not in the middle of the agglomerated bulk when removed from the furnace it could be attributed to oxidation of the sample during handling and processing. The hydride form of the powder is extremely sensitive to oxygen, as shown by Chun-Lin et al. (2004), and will form grey looking oxides and hydroxides upon exposure to air. This could be reduced by handling and processing the material in an inert atmosphere and/or vacuum throughout the entire process until the final powder product is obtained for example by conducting the HD and HDDR in the same reaction furnace. The amount of oxidation that takes place during the experiment could be reduced by upgrading the vacuum system for example a diffusion pump would remove more oxygen from the internal atmosphere. However this would be expensive and time consuming. 226
240 Chapter 9 Reproducibility & Large Batches An alternative way to remove more oxygen from the sample would be to flush the system with argon at least twice in between loading the sample and the beginning of the hydrogen decrepitation reaction. The overall effect that these extra steps could be very small as the sintered starting material contains oxygen that is entrained within the material from the initial processing. It should be noted that when samples are processed in-situ, i.e. no air exposure, the amount of blackened surface coating is significantly reduced. This gives evidence that the blackened coating is at least in some part caused by oxidation. The effect of sublimation of Nd during the HDDR process is also evident. The samples are processed inside small tubes made from sheets of stainless steel that are placed into the HDDR furnace. After HDDR processing 5-10 samples the stainless steel tubes begin to discolour from shiny silver to dark grey with shades of blue. The foil also becomes slightly magnetic intimating that the Nd vapour produced by the samples under heating has reacted with the foil during the process. The loss of Nd in this case could also lead to the production of the blackened coating layer with poor magnetic properties. 227
241 Chapter 9 Reproducibility & Large Batches 9.2 Increasing Batch Size Increasing the batch size increases the difficulty in maintaining the desired processing temperature in the furnace and therefore could have either a positive or negative effect on the variation of magnetic properties within a batch. The percentage of blackened material with respect to the bulk of non-oxidised material will be reduced by increasing the batch size due to the lower surface area to total mass ratio. Alternatively the exothermic and endothermic reactions will be greater and have a larger effect on the bulk of the material, especially during recombination, hence increasing variability. It was shown in chapter 6 that the recombination reaction can lower the temperature around the sample by over 50 ºC, which can have a very large effect on magnetic properties, as previously demonstrated in chapter 7. The batch sizes used for this series of tests were 20 g, 50 g, 100 g and 400 g, which is the current limit of processing capacity in our laboratories. With all of the samples the blackened surface was carefully removed before the remaining NdFeB was ground using a pestle and mortar to remove agglomeration. The 25, 50 and 100 g samples had one sample taken at random from the bulk of the powder; however the 400 g sample was split into two pieces down the middle of the agglomerated bulk. Each separated end of the sample had the surface layers of the agglomerated bulk removed from the core, and then one sample from the core material and 1 sample from the surface material were taken at random from each end piece for measurement and for microscopy. In the following table, core 1 and surface 1 were from one end piece and core 2 and surface 2 were taken from the other end piece. The magnetic properties of all of the samples are shown graphically in figure

242 Chapter 9 Reproducibility & Large Batches Figure 9.6. Magnetic properties of different batch sizes of NdFeB of composition A treated using the same HDDR processing conditions. It can be observed that the 20, 50 and 100 g samples exhibit remanence values above 860 mt, whereas all of the samples from the 400 g batch exhibit 755 mt remanence values or less. The overall range of remanence between the 7 samples is 200 mt. As these samples have had any blackened material removed before measurements were taken, any fluctuations in remanence were due to the material itself rather than the blackened material. The remanence of the 20 g sample in this case is much lower than that observed in chapter 8 although the reasoning behind this is unclear at present. When analysing the coercivity of the samples it is clear that the 20 g sample has a much higher coercivity (850 ka m -1 ) than all of the other 6 samples which exhibit coercivity values between ka m -1. These factors have had similar effects on the maximum energy products of the samples where the 20, 50 and 100 g samples have a (BH) max over 229
243 Chapter 9 Reproducibility & Large Batches 105 kj m -3 and all for the 400 g batch samples exhibit (BH) max values ranging from kj m -3. The hysteresis loops of the all of these samples are located in the appendix (Figures App.9.6A - App.9.6F), and they all exhibit anisotropy between the easy and hard directions. The reduction in remanence of the samples taken from the 400 g batch could be due to possible over- or under-processing during the HDDR reaction. Under-processing includes incomplete recombination, which would leave regions of the disproportionated mixture within the HDDR treated fine Nd 2 Fe 14 B matrix. This disproportionated mixture could effectively dilute the remanence of the sample in a similar way to the blackened oxidised material as it contains free iron which is soft magnetic. This effect has previously been shown by Liesert et al. (1998) where iron particles left in the sample due to under-processing (i.e. incomplete recombination) contribute to a reduction in magnetic properties of HDDR NdFeB produced from cast alloys. Zakotnik et al. (2006) suggested that regions of free iron in the disproportionated structure is also responsible for nucleating reverse domains during magnetisation reversal, which reduces the coercivity of the sample. The incomplete recombination was confirmed in core sample 1 when viewing the sample on the SEM, which is shown in figure 9.7. Although the bulk of the sample had recombined to form the Nd 2 Fe 14 B phase, there was still evidence of a disproportionated structure around the edges of the sample and in the regions particularly where the Nd-rich phase had been redistributed. This was the case in almost all of the particles for core sample 1, which could explain why the coercivity is the lowest of all of the samples. It could be assumed from this that the Nd-hydride from triple junctions diffuses into the bulk of the material before recombination is initiated, otherwise the regions around the triple points would react first. 230


244 Nd 2 Fe 14 B Disproportionated mixture Chapter 9 Reproducibility & Large Batches Former Nd-rich triple point Figure 9.7. SEM micrographs of powder from core sample 1 exhibiting areas of disproportionated structure at the particle edges and around voids within the matrix phase. The other powder sample taken from the core of the 400 g exhibits a similar remanence to that of core sample 1, however it exhibits higher coercivity. It could be assumed that this sample would therefore contain less disproportionated structure than the previous sample, if any at all. Closer inspection of the microstructure of core sample 2 shows a large amount of redistribution of the Nd-rich phase which indicates that the sample is mostly recombined into the fine grained Nd 2 Fe 14 B matrix phase, with only small regions of disproportionated structure evident as shown in figure 9.8. The disproportionated structure in this sample was located in the centre of the bulk rather than around cracks and voids with the previous sample. The distribution of disproportionated structure in this sample suggests that the previous assumption about the reaction finishing at triple points is incorrect, instead the reaction occurs simultaneously throughout the bulk with no preferential finishing position. 231

245 Chapter 9 Reproducibility & Large Batches Disproportionated mixture Figure 9.8. Backscattered SEM micrograph of powder from core sample 2 consisting mostly of Nd 2 Fe 14 B matrix phase and Nd-rich grain boundary phase with few small regions of the disproportionated mixture. A closer look at the microstructure of surface sample 1 is shown in figure 9.9. It can be observed that the HDDR reaction had completed successfully almost all of the sample with only a very tiny region of incomplete recombination. Comparing the microstructure to the magnetic properties confirms the hypothesis that the disproportionated structure reduces the coercivity of the powders as this sample contains less disproportionated structure and exhibits higher coercivity than the previous two samples. 232

246 Chapter 9 Reproducibility & Large Batches Nd-rich pull out Disproportionated mixture Figure 9.9. SEM micrograph of powder from surface sample 1 exhibiting very little disproportionated mixture. SEM analysis of surface sample 2 can be observed in figure It is evident from these images that the HDDR reaction had completed throughout the entirety of the sample. There is no evidence to suggest that there is any disproportionated microstructure remaining within the sample. The small black dots on the left image in figure 9.10 are regions of Nd-rich that pulled out during polishing due to their soft nature and are not disproportionated regions. 233


247 Chapter 9 Reproducibility & Large Batches Figure SEM micrographs of two regions from surface sample 2 showing no signs of incomplete recombination. There was however one large particle that was found when searching the whole of the mounted sample on the SEM that demonstrated a large patch of the disproportionated mixture. This can be observed in figure The centre of this sample was bisected by a long line of disproportionated mixture over 100 µm in length and ~20 µm wide with some small patches of incomplete recombination scattered throughout the particle. This was the only particle in this sample that demonstrated this amount of the disproportionated structure. The location of this region of incomplete recombination would suggest that the recombination reaction in kinetically controlled and starts at the edges of the samples and works its way towards the centre of the particle. However it was shown in chapter 6 that this is not necessarily the case. Regions such as this could be responsible for the lower remanence and coercivity exhibited by this sample than the surface sample

248 Chapter 9 Reproducibility & Large Batches Figure SEM micrograph of one large particle within surface sample 1 that exhibited a large line of disproportionated mixture (circled in red). The regions of incomplete recombination are likely to be a result of the large temperature fluctuations in the powder bed during processing as a result of endothermic and exothermic reactions. These fluctuations would likely alter the reaction rates of the surrounding material and could be enhanced greatly by the large batch sizes. The temperature of the samples was not measured for this large batch due to the current system set up, however work is underway to improve the scaling up process. Large scale HDDR processing is performed commercially by Aichi Steel, Japan, which can compensate for temperature fluctuations and avoid oxidation (US Patent 5,851,312). To accomplish this large scale treatment, Aichi has employed a continuous processing furnace to turn cast blocks of NdFeB into a fully HDDR treated, fine grained powder for use in bonded and hot-pressed magnets. As Aichi are using cast ingots as an input 235
249 Chapter 9 Reproducibility & Large Batches feed the composition is tailored specifically for the HDDR reaction and the oxygen content will be much lower than that found in scrap sintered magnets. The cast material is loaded into the front end of the furnace where it is hydrogen decrepitated, before being moved into the HDDR section of the continuous furnace. The HDDR section is surrounded by temperature compensating devices that can remove heat during the exothermic disproportionation reaction and add heat during the endothermic recombination reaction to maintain the optimum treatment temperature at all times. It would ultimately be possible therefore to process sintered NdFeB magnets on a large scale in a more controlled fashion. Overall it can be observed that the reproducibility of HDDR treated samples is improved by removing any blackened oxidised coatings after removal from the bulk of the NdFeB powder. Although care can be taken to avoid oxygen exposure, end of life NdFeB magnets are likely to contain surface oxides or corrosion products which may not be detected before hydrogen decrepitation. Homogenous mixing could evenly distribute the oxidised particles if manual removal or magnetic separation is not feasible after HDDR processing. Particle size has little effect on the magnetic properties of the HDDR powder so light grinding or milling could be utilised to remove any particle agglomeration without the need for expensive processing such as jet milling. Finally, increasing the batch size has a large effect on magnetic properties, especially due to the endothermic nature of the recombination reaction altering the reaction kinetics. This could be improved by using sensitive temperature compensation devices to maintain the desired reaction temperature throughout the entire reaction and encourage optimised processing and complete recombination. 236
250 Chapter 10 Mixed Input Feeds Chapter 10 RESULTS & DISCUSSION - MIXED INPUT FEEDS Real life scrap feeds of NdFeB magnets are very unlikely to contain one specific composition as used for chapters 6-9, therefore it is very important to determine the effects of processing multiple compositional feeds. Depending on the application that the scrap magnets were taken from, there could be a large range of additives which will affect the kinetics of the HDDR reaction. Dysprosium and cobalt are added to NdFeB alloys to increase the coercivity and temperature capabilities of the NdFeB magnets; these additives are likely to affect the processing conditions required for HDDR processing. In this section various mixes of low Dy and Co-containing composition A and high Dy and Co-containing composition B were processed simultaneously. These two alloys represented the largest compositional difference of the real scrap available in the laboratory. Composition A contains relatively low levels of additives and is similar in composition to the low-grade NdFeB magnets used in hard disk drives, whereas composition B represents a higher-grade magnet such as that from a permanent magnet motor containing more Dy and Co to give the material a higher coercivity and temperature stability. These two compositions are shown below in table g samples consisting of various combinations of compositions A and B were loaded as fractured pieces from the sintered blocks into the HDDR furnace. The mixtures were then hydrogen decrepitated and HDDR processed in-situ with no exposure to air. 237
251 Chapter 10 Mixed Input Feeds Table ICP analysis of alloys of Compositions A and B (atomic %). Alloy Nd Dy Pr Fe Co Al Nb B Composition A Nil Composition B Having already studied the processing conditions required for reprocessing of sintered alloys of composition A, it is important to understand how the parameters need to be altered to fully reprocess alloys of composition B. The temperature was kept at 880 ºC as in previous chapters, however it was found that alloys of composition B had not completed disproportionation within the 1500 mbar set pressure as used with composition A, as shown in figure 10.1 below. Figure Disproportionation absorption graph for composition B showing incomplete disproportionation at 1500 mbar. Further investigation into the absorption of hydrogen showed that the hydrogen pressure needed to be raised to 2000 mbar for complete disproportionation to occur. The 238
252 Chapter 10 Mixed Input Feeds processing parameters chosen for this section are shown in figure It can be observed that the sample is heated under vacuum to 880 ºC before hydrogen is introduced at 16 mbar min -1 up to 2000 mbar, at which point the pressure was reduced at 100 mbar min -1 down to vacuum. Upon completion of recombination and recovery of full vacuum, the furnace was rolled off the tube and the sample was quickly cooled. Figure Schematic to show the processing parameters used for processing mixed input feeds to encourage full disproportionation of compositions A and B. The absorption traces in figures 10.3 and 10.4 exhibit an initial peak in hydrogen flow that has no associated increase in temperature which is due to the filling of the reaction vessel with hydrogen at a rate of 200 mbar min -1, up to a hold pressure of 2000 mbar. The time taken for the initiation of hydrogen decrepitation to occur is controlled by the surface condition of the material, hence this time varies from sample to sample. The samples were left under hydrogen until the temperature had recovered to room temperature after the exothermic 239
253 Chapter 10 Mixed Input Feeds reaction in order to ensure complete decrepitation. The reaction vessel was then left under vacuum until the beginning of the HDDR reaction. During preparation of the powders for HDDR processing, it became apparent that the hydrogen decrepitation reaction may be affected by the range of compositions. Both individual samples of composition A and composition B were decrepitated under 2 bar hydrogen at room temperature. The HD hydrogen absorption charts for 20 g samples of composition A and composition B are shown below in figure It can be observed that the two compositions do not react in the same manner during decrepitation. Composition A absorbs hydrogen over ~40 minutes exhibiting a broad peak and a exothermic temperature reaching 30 ºC, whereas composition B suddenly initiates and absorbs hydrogen over ~15 minutes exhibiting a sharp absorption peak accompanied by an exothermic reaction temperature reaching 85 ºC. The HD hydrogen absorption chart for a 50:50 mix of compositions A and B is shown in figure The 50:50 mix of compositions A and B exhibits an initial sharp peak of hydrogen absorption, followed by a low level of continuous absorption for a further 25 minutes. This could be the case that the initial peak was the reaction of the composition B element of the mixture and the low level of continuous absorption is related to the composition A element. The increase in temperature associated with the initial absorption of composition B could have initiated the decrepitation of the composition A alloy, however as the temperature had increased, it increased the speed in which composition A absorbed the hydrogen during the decrepitation phase. 240
254 Hydrogen flow associated with filling the reaction vessel to 2 bar. Chapter 10 Mixed Input Feeds Figure Hydrogen absorption peaks and associated temperature profile of samples of composition A (left) and composition B (right) hydrogen decrepitated at 2 bar at room temperature. Hydrogen flow associated with filling the reaction vessel to 2 bar. Composition B Composition A Figure Hydrogen absorption peak and temperature profile of a 50:50 mix of composition A and composition B showing features of the two individual alloys. 241
255 Chapter 10 Mixed Input Feeds The disproportionation reaction was again monitored by mass flow controllers, a pressure gauge and a thermocouple. Composition A initiates disproportionation at ~500 mbar and is complete by ~950 mbar and absorbs hydrogen in one tall sharp peak, whereas composition B (which has a higher Dy and Co content) initiates disproportionation at ~1100 mbar and is complete by ~1800 mbar in a broad absorption peak. These disproportionation charts can be observed in figure The first peak that occurs instantly is attributed to the absorption of hydrogen by the Nd-rich phase at grain boundaries and triple points and occurs in all of the disproportionation graphs. This peak can be observed as a single, double or triple peak. This shows that composition B requires not only a higher pressure to encourage disproportionation but also a longer period of time to complete the reaction. It has already been shown that temperature affects the reaction kinetics in that a higher reaction temperature requires a higher hydrogen pressure to encourage disproportionation. It can now also be said that certain alloying additions alter the kinetics of the reaction and stabilise the matrix phase against disproportionation. This was also demonstrated by Fujita and Harris (1994) and Sugimoto et al. (1997) who showed that Co stabilises the matrix phase of cast alloys against the onset of disproportionation and requires a longer time to complete the process. Dy and Co are often added to an alloy together. The higher disproportionation pressure could therefore be due to both the Dy and the Co. This can be clearly observed when comparing these two alloys as composition B is rich in Dy and Co and requires a higher pressure and longer processing time for disproportionation than the low Dy-containing and Co-free composition A. 242
256 Chapter 10 Mixed Input Feeds Absorption of H 2 by Nd-rich phase Figure Hydrogen absorption peaks for the disproportionation of composition A (left) and composition B (right). It is clear that if mixed batches of composition A and composition B are processed then it is likely that a higher pressure would be required. Therefore subsequent batches were produced by mixing composition A with composition B in 10% intervals from 100% A to 100% B. The disproportionation graphs of these samples are shown below in figure The mixed batches demonstrate a combination of the disproportionation peaks from both composition A and composition B, however as the ratio of composition B increases, the first peak becomes shorter and the second peak becomes taller. The reaction start and finish points for both disproportionation peaks remains constant throughout, it is only the intensity of each peak that varies depending on the quantity of each composition present within the mixture. So it is clear that the exotherm from one composition does not have a big effect on the other. ^ 100% Composition A ^ 90% Composition A 10% Composition B 243

257 Chapter 10 Mixed Input Feeds ^80% Composition A 20% Composition B ^70% Composition A 30% Composition B ^60% Composition A 40% Composition B ^50% Composition A 50% Composition B ^40% Composition A 60% Composition B ^30% Composition A 70% Composition B 244

258 Chapter 10 Mixed Input Feeds ^20% Composition A 80% Composition B ^10% Composition A 90% Composition B ^100% Composition B Figure Hydrogen absorption peaks of mixed batches of compositions A and B in 10% increments. The magnetic properties of the mixed batches were measured by removing any blackened coating then taking 3 random samples from each batch for characterisation and an average taken from the three samples. The magnetic properties show a large amount of variation, both within each batch and with variation of composition. The average magnetic properties of each composition are shown graphically in figure 10.7, 10.8 and 10.9 below, the magnetic properties of the individual samples can be found in the appendix (Table App.10). 245
259 Chapter 10 Mixed Input Feeds It can be observed from figure 10.7 that the average remanence of the sample of 100% composition A is much lower than the 1.08 T exhibited by the sample processed in chapter 8. The average coercivity (figure 10.8) for this sample is similar to the 840 ka m -1 exhibited by the sample from chapter 8, however due to the drop in remanence, the maximum energy product (figure 10.9) is much lower than the 178 kj m -3 that has previously been achieved. This drop in remanence could be attributed to the increased disproportionation pressure which has been shown in previous chapters to lead to over-processing of the sample. The sample of 100% composition B exhibits an average coercivity of 745 ka m -1, which is surprisingly lower than that achieved by the sample of 100% composition A as it contains a higher level of dysprosium which is added to increase the coercivity of the starting material. This could be attributed to the fact that the HDDR treatment temperature has been optimised for processing samples of composition A, whereas composition B may require a different processing temperature to improve the magnetic properties, as was shown for composition A in chapter 8. However the remanence and energy product of HDDR-treated composition B is higher than that of 100% composition A in this case. The average remanence, coercivity and maximum energy products for each compositional mixture are displayed graphically in figures 10.7, 10.8 and

260 Chapter 10 Mixed Input Feeds Figure Variation of average remanence across three samples from each of the mixed composition input feeds. It can be observed from figure 10.7 that the variation of average remanence value across the compositions is within a 200 mt range, which is a large amount of variation. With exception to the sample containing 20% composition B, all of the mixed batches exhibit a lower average remanence than both the individual samples of compositions A and B. This would suggest that the kinetics of the reaction have been affected by the introduction of two differing compositions of sintered NdFeB. It has previously been shown in chapters 7 and 8 that the magnetic properties are very sensitive to processing conditions, so for example any variation in sample temperature during recombination can significantly alter the microstructure and hence magnetic properties of the resultant sample. 247

261 Chapter 10 Mixed Input Feeds Figure Variation of average coercivity across three samples from each of the mixed compositions. Figure 10.8 shows that along with the variation in remanence, there is also a large variation in coercivity between the mixed composition batches. The overall range between the average coercivity values is 223 ka m -1, which is a slightly larger range of values than those exhibited by the remanence values. There is no specific trend in coercivity observed from these samples, however the sample consisting of 100% composition A has the highest remanence. As mentioned previously, the sample of 100% composition B exhibits a lower value of coercivity than composition A, so it would be logical to predict that creating mixtures of these compositions would result in lower coercivity, which is certainly true in this case. 248

262 Chapter 10 Mixed Input Feeds Figure Variation of average maximum energy product across three samples from each of the mixed compositions. The variation of energy product across the samples is also very large, this was always going to be the case after observing the fluctuations of coercivity and remanence across the compositional range. The samples containing only composition A and only composition B (i.e. no mixing) exhibit relatively high energy products compared to most of the mixed samples (with exception to the sample containing 80% A and 20% B). This was to be expected as there would be no interactions between different compositions during processing that could alter the reaction kinetics. As with the work in chapter 9, the variation could possibly be evened out across mixed composition input feeds by improving the mixing of the two materials. In this work the broken pieces were weighed out and crudely mixed by placing them in the same stainless steel tube before placing them into the HDDR rig. Alternatively the mixed feeds could be hydrogen decrepitated as one batch, then mixed by powder blending before inert transfer into the 249
263 Chapter 10 Mixed Input Feeds HDDR rig for further processing. This could however have an adverse effect in that it increases the amount of interactions between the mixed compositions. The variations within each batch could be reduced by processing the mixed compositions separately then powder blending the resultant powder, however this would not necessarily be feasible with real scrap feeds. The overall variation of the magnetic properties between the mixed input feeds of compositions A and B cannot simply be attributed to one single part of the HDDR reaction. It can be observed that the disproportionation absorption peaks of the two compositions do not overlap so the exothermic reaction from composition A should not have a significant effect on the disproportionation of the material of composition B. However after completion of disproportionation of composition A, the sample is exposed to increased hydrogen pressures for ~1 hour during the disproportionation of the composition B part of the sample. This could lead to over processing as previously observed when conducting the HDDR reaction at lower temperatures. The overall effect of the increased processing pressure for disproportionation can also be observed by comparing the magnetic properties of the 100% composition A sample processed at 1500 mbar with the sample processed at 2000 mbar. The 1500 mbar processed sample exhibits 1.08 T remanence, 840 ka m -1 coercivity and 178 kj m -3 maximum energy product, whereas the best measured sample processed at 2000 mbar exhibits 0.85 T remanence, 860 ka m -1 coercivity and 108 kj m -3 maximum energy product. Although the coercivity is similar between the two samples, there is a noticeable drop in remanence in the sample processed at 2000 mbar, which also has a knock-on effect with regards to a drop in energy product of 70 kj m -3. The remanence was therefore reduced by over-processing during the disproportionation which leads to a loss of anisotropy in the sample, giving rise to a loss of remanence. 250
264 Chapter 10 Mixed Input Feeds The recombination part of the HDDR reaction could be the area in which the kinetics of the reaction are most affected by the mixture of two compositions. Due to system limitations where the hydrogen flow out of the system cannot be measured at pressures of less than 300 mbar it is difficult to monitor whether the two compositions undergo recombination simultaneously or if the two reactions are separate as with the disproportionation reaction. Figure below shows the recombination graphs for the individual samples of compositions A and B. Endothermic recombination peak Initial shoulder during exotherm Endothermic recombination peak Figure Recombination charts of composition A (top) and composition B (bottom) 251
265 Chapter 10 Mixed Input Feeds It can be observed from figure that the recombination of composition A occurs as one smooth endothermic reaction with a drop in temperature ~30 ºC completed in 7 minutes. Composition B, however, appears to have a slight shoulder at the beginning of the exotherm, potentially indicating a two-step recombination process. The overall drop in temperature is ~120 ºC and occurs over a 10 minute period. This may indicate that the recombination reaction in composition A occurs at lower pressures than composition B and in a concentrated part of the recombination trace, whereas composition B recombines over a larger pressure range. This was shown to be the case by Nakamura et al., (1999) who demonstrated that the addition of 2 at% Dy to the ternary alloy increases the pressure that recombination occurs at for HDDR treatment of cast alloys. It was also shown by Nakamura et al. (1998) that additions of Co and Ga increase the recombination pressure of cast alloys. Step 1 Step 2 Step 3 Figure Recombination chart of 50:50 mixture of compositions A and B clearly showing a three step endothermic drop in temperature. 252
266 Chapter 10 Mixed Input Feeds Figure above shows the recombination graph for the 50:50 mixture of compositions A and B. The endothermic reaction associated with recombination appears to be in three small steps during the drop in temperature, indicating that the recombination of both composition A and composition B occurs almost simultaneously. This could therefore affect the kinetics and the way that the samples recombine as the temperature drops by 45 ºC and takes almost 10 minutes to recover back to over 880 ºC. Comparing the recombination chart of the 50:50 mixed batch with the recombination charts of each individual composition, figure 10.10, it can be observed that there is a clear difference with regards to drop in temperature during the recombination. The drop in temperature associated with the recombination of composition A is ~30 ºC which is less than that exhibited by the 50:50 mix, however the sample consisting solely of composition B experienced a drop in temperature of ~120 ºC. The time taken for the temperature to recover in both situations also follows the same pattern as does the difference in intensity of endothermic reaction. This could suggest that the additions of Dy and Co increase the intensity of the endothermic reaction in order to achieve full recombination. The mixture of the two compositions however does not allow the Dy and Co to have such a large effect on the endothermic nature of the recombination reaction. To justify this hypothesis it is important to analyse the recombination endotherm temperature across all of the mixed input feed samples. These temperatures and time taken to recover to processing temperature are shown in figure below. 253

267 Chapter 10 Mixed Input Feeds Figure Lowest temperature during endothermic recombination reaction and time taken to recover to the processing temperature of mixed input feeds consisting of varies quantities of compositions A and B. It can be observed from figure that the lowest temperature exhibited by samples of mixed input feeds varies across the compositional range however there is no specific pattern with regards to quantity of composition B present within the sample. This could be just a random or alternatively it could simply be due to position of the thermocouple in the powder bed during processing. All of the samples of mixed composition exhibited a single smooth endotherm during recombination except for the samples containing 50% and 90% composition B. The 90% sample has a kink or shoulder at the beginning of the endotherm, possibly caused by two separate recombination reactions from the two compositions. The recombination chart of this sample is shown below in figure The low point in recombination temperature of this sample is ~825 ºC, which is in between the 855 ºC exhibited by composition A ad 755 ºC exhibited by composition B again demonstrating a mixture of the effects of recombination of 254
268 Chapter 10 Mixed Input Feeds compositions A and B. This kink in the recombination endotherm however could be an anomaly however as it was only experienced in one of the nine mixed input feed samples. Figure Recombination chart of the sample containing 90% composition B exhibiting a kink at the start of the recombination endotherm. Looking at the microstructures of these mixed input samples shows that the HDDR process was completed successfully, converting the sintered microstructure into a fine grained powder. Figure shows the microstructures of two particles from the 50:50 mix of compositions A and B. 255


269 Chapter 10 Mixed Input Feeds HDDR induced cavitation Large Nd 2 Fe 14 B grains Large oxidised Nd-rich pools Figure Backscattered SEM micrographs of two particles from the 50:50 mix of compositions A and B processed at 880 ºC and 2000 mbar disproportionation pressure As with the samples processed at 880 ºC in chapter 8, the whole of the material appears to have successfully recombined into a fine grained microstructure evidenced by the finely redistributed Nd-rich grain boundary phase. There also appears to be large regions of oxidised Nd-rich remaining from the initial sintered microstructure as demonstrated more clearly in chapter 6 as well as regions of HDDR-induced cavitation caused by the redistribution of Nd-rich. However the bottom image in figure has a few large matrix 256
270 Chapter 10 Mixed Input Feeds grains present. This could be a particle of composition A where the over-processing occurred by raising the disproportionation pressure to 2000 mbar in order to process composition B after completion of processing composition A. Scrap voice coil motor magnets of composition C were HD and HDDR treated in the same way as the previous samples of compositions A and B with the reaction schematic shown in figure The composition of the VCM magnets has been added to table 10.2 for comparison against compositions A and B with regards to major constituents. It can be observed that composition C contains the least Nd and Dy, but the most Pr out of the three materials and also contains a small amount of Co. The additions found in composition C would suggest that the disproportionation peak should be between the peaks produced by compositions A and B due to the quantity of Co in the sample, however it can be observed from figure that the start point of disproportionation is at the same pressure as composition A and disproportionation is completed by a lower pressure than composition A. This low disproportionation initiation pressure could be due to composition C containing the lowest total rare-earth quantity of all three starting materials or possibly due to the high level of Pr present within the structure. McGuiness et al. (2001) reported that Pr addition to NdFeB broadens the processing window in terms of process temperature when using the conventional HDDR method. With the v-hd s-dr or d-hddr method being employed in this work, the Pr could broaden the processing window in terms of hydrogen absorption pressure as the temperature is constant. Alternatively the increase of disproportionation pressure could be influenced by the additions of both Co and Dy together as these elements are usually added to NdFeB simultaneously in order to improve both the Curie temperature and the coercivity of the magnet. The low Dy content in this case does not aid towards stabilising the Nd 2 Fe 14 B phase against disproportionation. Furthermore there 257
271 Chapter 10 Mixed Input Feeds could be a lower threshold level of Co required to stabilise the matrix phase against disproportionation which is greater than the 1.4 atomic % found in composition C. Table ICP analysis of alloys of Compositions A, B and C (atomic %). Alloy Nd Dy Pr Fe Co Al Nb B Composition A Nil Composition B Composition C Nil 6.1 Figure Comparison of disproportionation hydrogen absorption peaks for compositions A, B and C. The low point of recombination temperature is shown in figure 10.16, where the endotherm reached 830 ºC, lower than that of composition A but not as low as composition B. The recovery time to reach processing temperature was ~11 minutes, again this is slower than that of composition A, and disagreeing with the principle that Co cobalt content speeds up the 258
272 Chapter 10 Mixed Input Feeds recombination reaction. It can be said that with the s-dr processing route the Co content of the sample affects the low point of the endotherm during recombination however it does not speed up the reaction, whereas with conventional HDDR the Co content lowers the reaction temperature and speeds up the rate of reaction. Figure Recombination chart of composition C showing the effect of sample temperature during the recombination reaction. The magnetic properties of the sample of composition C after HDDR processing are shown in figure It can be observed that there is a slight difference between the easy and hard directions of magnetisation, evidence of the anisotropic nature of the sample, however the remanence is >200 mt lower than exhibited by both compositions A and B after completion of HDDR. That being said, the remanence of the sintered starting material of composition C is lower than those of compositions A and B so this should not come as a surprise. A remanence of 600 mt is lower than almost all of the values exhibited by the mixed composition batches, however coercivity of 900 ka m -1 is much higher than exhibited by the other samples. 259
273 Chapter 10 Mixed Input Feeds Figure Demagnetisation quadrant of the hysteresis loop in the easy and hard directions of magnetisation for the HDDR treated sample of composition C. The microstructure of this sample is shown below in figure which demonstrates the standard HDDR treated NdFeB-type structure of a fine grained Nd 2 Fe 14 B matrix separated by finely dispersed Nd-rich grain boundary phase. Large voids are observed where the Ndrich phase has redistributed from triple points within the previous sintered structure. There is no evidence of disproportionated structure, hence the HDDR reaction was completed successfully under the processing parameters set out at the beginning of this chapter. 260

274 Chapter 10 Mixed Input Feeds Figure Backscattered SEM micrograph of HDDR treated sample of composition C. It is clear to see that mixed input feeds can be processed simultaneously however there is a large amount of variation in the resulting magnetic properties. Although this situation is not ideal with regards to the production of bonded magnets, any HDDR powder produced from mixed feed stocks would require the quotation of minimum magnetic properties expected from the batch and could not be used in high-end or safety critical products. Ensuring well controlled and complete disproportionation and recombination is the key to successful processing of mixed input batches. Sorting of input feeds according to the application from which they were used in would provide assistance with limiting the range of compositions present in each processed batch. For example separating voice magnets from hard disk drive would lead to a narrow distribution of composition and would require a lower disproportionation pressure and over-processing could be avoided. Likewise magnets from electric or hybrid vehicle motors would likely be rich in Dy and Co and hence separating them prior to HD and HDDR would aid with processing parameter selection. 261
275 Chapter 11 Bonded Magnets Chapter 11 RESULTS & DISCUSSION - BONDED MAGNETS After completion of HDDR, the powders can be used to produce solid permanent magnets in a number of ways including; resin bonding, hot-pressing, and more recently by spark plasma sintering. In this section the focus will be on the production of bonded magnets. The bonded magnets in this case were produced from HDDR treated powders of composition A from a single 100 g batch. Producing magnets from one composition and one batch eliminates any variability in properties that could occur between batches. The 100 g batch size was chosen as this was the largest batch size which was very reproducible in terms of properties shown in chapter 9. The main ways of altering the bonded magnet type are by changing the binding agent and by production of isotropic or anisotropic magnets. Binding Agents The two binding agents used in this work were PTFE and epoxy resin. The PTFE is received as a fine powder which is mixed with the HDDR treated powder by hand with a pestle and mortar in a ratio 80:20 with regards to NdFeB:PTFE. Due to the fine nature of the PTFE powder, agglomeration and clumping occurs in the as-received powder during mixing with the NdFeB powder so the mix is not completely homogenous. Figure 11.1 shows a representation of how the PTFE mixes with the NdFeB if a cross section of a bonded magnet was taken. It can be observed that although the PTFE is mixed across the entire cross section, there are areas where clumping or agglomeration has occurred and that 262

276 Chapter 11 Bonded Magnets the PTFE is not homogenously spread across the cross section of the magnet. This representation was formed from visual inspection of the magnets both during and after the production procedure. NdFeB Agglomerated PTFE Fine, well distributed PTFE Figure Representative schematic showing the mixing and agglomeration of PTFE through a cross section of an NdFeB bonded magnet. Once the PTFE was mixed with the HDDR-treated NdFeB the mixture was placed into the magnet die in between two punch pieces with polished, flat surfaces against the powder mixture to create flat parallel surfaces on the top and bottom of the magnet. Once pressed and ejected from the die the magnet required heating in a vacuum furnace at a rate of 5 ºC min -1 to 360 ºC and held for 5 minutes to cure the PTFE. The bonded magnet was then pulse magnetised before testing with a closed loop permeameter and a densitometer. Preparation of epoxy resin bonded magnets was not as simple as the mixing process utilised with PTFE. The epoxy resin was received in two parts, one being large resin crystals and the other as fine resin hardening powder. The resin and hardener were mixed in a 10:1 ratio resin to hardener in a glass beaker or petri dish. This mixture was then heated slowly on a hot plate in a carrier fluid such as industrial methylated spirit or cyclohexane, stirring 263
277 Chapter 11 Bonded Magnets continuously until the resin crystals have all dissolved. The NdFeB powder was then added in a ratio of 85:15 NdFeB to resin, and then mixed into the resin solution in order to coat every powder with the solution. The mixture was then removed from the hot plate, placed in a vacuum chamber and evacuated slowly to evaporate the carrier fluid. After evaporation the powder particles are agglomerated due to the coating of hardened epoxy resin during the drying process. Light grinding using a pestle and mortar removes the agglomeration, and then the coated powder particles were poured into a die. Once pressed the sample was ejected from the die and transferred to an oven and heated to 125 ºC for 2 hours to set the resin. This method has an advantage over PTFE in that the mixing of epoxy resin is homogenous as it coats each individual particle during the mixing and drying process. Figure 11.2 shows a representation of the coating of individual powder particles in epoxy resin. Uncoated NdFeB particle Solution containing resin, hardener and carrier fluid Coated NdFeB particle Figure Schematic representation of how the epoxy resin solution coats individual particles during the mixing process to get homogenous mixing throughout the powder 264

278 Chapter 11 Bonded Magnets Isotropic NdFeB Bonded Magnets Isotropic bonded magnets were pressed in a simple 10 mm diameter cylindrical die using the Specac uniaxial press without the application of an external magnetic field. The magnetic domains within the powder are randomly scattered throughout the magnet both before and after pressing giving no preferred direction of magnetisation. Three PTFE bonded magnets and three epoxy resin bonded magnets were produced and are shown lined up alongside each other in figure It can be observed that the three resin bonded magnets (left hand side) appear darker in colour than the PTFE bonded magnets as the particles are coated in the translucent resin. There also appears to be some bubbling on two of the epoxy resin bonded magnets possibly due to small pockets of air trapped under the epoxy resin layer which have expanded during heating. This is not evident in the PTFE bonded magnets as the particles have not been coated. Bubble affected surface Epoxy resin bonded PTFE bonded Figure Photograph of three isotropic epoxy resin bonded magnets (left) and three isotropic PTFE bonded magnets (right). 265
279 Chapter 11 Bonded Magnets The magnetic properties of the samples were measured first and then the densities of the samples due to the possibility of the diethylpthalate oil from the densitometer being absorbed by the magnet during density measurements. Table 11.1 show these measured properties for the five bonded magnets (not including the bubble affected epoxy resin bonded magnet) and the averages over the two sets of samples. Table Magnetic properties and density measurements of the isotropic bonded magnets Sample Remanence (mt) Coercivity (kam -1 ) Density (g cm -3 ) PTFE PTFE PTFE Average PTFE Epoxy Epoxy Average Epoxy It can be observed that the densities of the epoxy resin samples are higher than those of the PTFE bonded magnets. This was to be expected due to the epoxy resin bonded magnets containing a higher proportion of NdFeB (85% compared to 80% in PTFE bonded magnets). The maximum theoretical density of the bonded magnets is calculated by the following equation. 266
280 Chapter 11 Bonded Magnets where ρ max = maximum theoretical density Vf NdFeB = Volume fraction of NdFeB ρ NdFeB = density of NdFeB Vf Binder = Volume fraction of binder ρ Binder = density of binder For epoxy resin; ρ max = (7.5 * 0.85) + (1.1 * 0.15) = = 6.54 g cm -3 For PTFE; ρ max = (7.5 * 0.80) + (2.2 * 0.20) = = 6.44 g cm -3 The maximum density achieved in the epoxy resin bonded magnets was 6.13 g cm -3, which is 0.41 g cm -3 lower than the theoretical maximum, but the average density across the two samples was 6.08 g cm -3, 0.46 g cm -3 lower than the maximum. These low densities can be attributed to the possibility of an inefficient packing density of the resin coated powders within the bonded magnets. With randomly shaped and sized HDDR NdFeB particles it is very difficult to press them to leave zero porosity. The maximum density of the PTFE samples in this case was 5.80 g cm -3, which is 0.64 g cm -3 lower than the theoretical maximum. This is a similar drop in density as shown in the epoxy resin bonded magnets and can therefore be attributed to the random distribution of particle shapes and sizes across the magnet. The variation of density across the samples was also similar to the PTFE magnets. The magnetic properties of the bonded magnets however do not follow the pattern expected from the two types of binding agent. It was assumed that the resin bonded magnets would exhibit higher magnetic properties especially with regards to remanence as there is a higher proportion of NdFeB present (85% compared to 80%) within these magnet types. The 267
281 Chapter 11 Bonded Magnets actual remanence of the epoxy resin magnets averages at 37 mt lower than the average PTFE magnet remanence. The maximum remanence exhibited by the epoxy resin bonded magnets is 61 mt lower than the maximum remanence produced by the PTFE bonded magnets. On the other hand, both the average and maximum coercivity of the magnets was exhibited by the epoxy resin bonded magnets is as predicted. Zhang et al. (2009) demonstrated that increasing the compression pressure to 620 MPa (~45 tons) when processing epoxy resin bonded magnets made from melt spun NdFeB powder led to an increase in remanence due to increased sample density. The pressure used in Zhang s work is higher than the maximum pressure that can be achieved using the uniaxial press in the magnetic materials group (15 tons) and exceeds the rating of the die (10 tons). The local pressure applied on the magnet could be increased by using a smaller surface area die at the maximum applied pressure of the Specac press. The increased pressure would encourage a better compaction of the random shapes and sizes of HDDR powder particles in both the epoxy resin and PTFE magnets. The pressure used in this work may also be too low to liquefy the resin during uniaxial pressing as previously stated by Tattam (1996) and McCain (2012) where a pressure of 30 tons allowed for excellent densification of plate-like crushed melt spun ribbons coated with the epoxy resin. The demagnetisation quadrant of the hysteresis loops are shown in figure It can be observed that all of the magnets exhibit demagnetisation curves with poor squareness. The squareness is poor due to the magnets being isotropic rather than anisotropic. As the magnetic moments are randomly oriented throughout the magnet, the amount of field produced in the direction of testing by each of these moments varies significantly. Some of the moments will be perpendicular to the testing direction and so do not add to the total magnetisation and some are at a 45º angle for example, meaning the contribution can be reduced to sin 45º as 268

282 Chapter 11 Bonded Magnets measured using Pythagoras theorem. Not only is the magnetisation contribution of each moment different, the applied field required to demagnetise or flip that moment in the opposite direction also varies. Therefore each point on the demagnetisation curve represents the amount of these moments that have not been demagnetised by the applied field. In a perfectly aligned magnet, this line is horizontal and straight as all the moments will be demagnetised at the same point, the coercivity value. The fact that the demagnetisation curves in this case are not completely straight or linear suggests that the magnetic moment directions are not homogeneously spread throughout the magnets. Figure Demagnetisation quadrants of the isotropic bonded magnets. 269
283 Chapter 11 Bonded Magnets Anisotropic NdFeB Bonded Magnets The production of anisotropic bonded magnets was largely unsuccessful due to inefficiencies of the laboratory equipment. Poor compaction was achieved due to insufficient force applied by the hydraulic ram. The alignment of the compacts was also very poor as the field on the aligning press is insufficient to align the powders. The densities and magnetic properties of the anisotropic magnets were lower than those exhibited by the isotropic magnets. Work is currently underway to improve the aligning press to allow for production of highly dense bonded magnets with a strong alignment direction. 270
284 Chapter 12 Conclusions and Future Work Chapter 12 Conclusions and Future Work This study was aimed at exploring the possibility of recycling scrap NdFeB-type magnets using a combination of the hydrogen decrepitation process and the hydrogenation disproportionation desorption and recombination process. A continual increase in demand for NdFeB-type permanent magnets and the well-publicised rare-earth crisis have led to a heightened awareness of potential shortfalls and instabilities of supply. Recycling magnets from end-of-life consumer products has been identified as one way in which a stable supply can be maintained. Development of Microstructure Using a starting material of uncoated scrap sintered magnets of composition A (Nd 13.4 Dy 0.7 Fe 78.6 Al 0.7 Nb 0.4 B 6.2 (atomic %) with an oxygen content of 2665 ppm and traces of Pr 0.04 at%, Cu 0.04 at%, Mn 512 ppm, Si 427 ppm and N 90 ppm) it was possible to analyse the effect of different stages of the hydrogen decrepitation (HD) and hydrogenation disproportionation desorption and recombination (HDDR) reaction on the microstructure of the sample. Exposing the sintered magnet starting material to hydrogen at room temperature causes a 5% volume expansion due to hydrogen absorption, which leads to intergranular cracking and brittle fracture to form a hydrided powder known as the HD reaction. The hydrogen is desorbed from the material by heating in vacuum to the desired processing temperature for the start of the HDDR reaction. During the disproportionation stage of the HDDR reaction the hydrogen is initially absorbed along the grain boundaries starting at the particle surface and diffusing in towards the centre of the particle, which has 271
285 Chapter 12 Conclusions and Future Work also been shown in the literature to be the same for cast alloys. This absorption is followed by disproportionation of the grain boundary phase and triple points, however, oxidised triple points remain unreacted, which differs from previous work on cast materials. Sintered NdFeB has a much higher oxygen content than cast alloys by an order of magnitude as well as a smaller grain size with more triple points. Thus the potential for oxidation at triple points is much higher in sintered alloys than in cast alloys. The disproportionation reaction then diffuses in towards the centre of the matrix phase grains from the grain boundaries and from the centre of the disproportionated triple points until the entire particle has completed disproportionation. The direction of the disproportionation reaction movement into the grains has been imaged for the first time by stopping the disproportionation reaction part-way through and using high resolution backscattered electron microscopy. The fully disproportionated structure consists of a rod-like structure of NdH 2 surrounded by an α-fe matrix with finely dispersed Fe 2 B particles as previously shown in the literature. By reducing the hydrogen pressure towards vacuum the disproportionated mixture begins the recombination reaction, and hydrogen is desorbed from the sample. The recombination appears to initiate at random across the entire particle. NdH 2 from grain boundaries and triple points within the initial sintered microstructure redistribute around a fine Nd 2 Fe 14 B grain structure leaving regions of cavitation behind them which has previously been shown in cast alloys. It was shown that the oxidised triple points remain untransformed from the sintered microstructure and are present alongside the fine, redistributed Nd-rich grain boundary phase in the final HDDR processed microstructure which has not been previously reported. 272
286 Chapter 12 Conclusions and Future Work Equilibrium Point & Recombination The equilibrium point between disproportionation and recombination has been measured using mass flow controllers to determine the pressure at which hydrogen is absorbed by the matrix phase. The hydrogen absorption and disproportionation was identified as three exothermic reactions. The first reaction is attributed to the absorption of hydrogen by the Nd-rich grain boundary phase. The second exothermic peak is associated with absorption of hydrogen by the matrix phase and the third peak is attributed to the disproportionation of the matrix phase. The three exothermic peaks identified in this work confirmed work in the literature performed by differential scanning calorimetry on sintered alloys. It was found that low disproportionation pressures however, can lead to incomplete disproportionation, resulting in a large grained (>10 µm) microstructure which has also been shown previously but only for the processing of cast alloys. During the recombination stage there are two stages of hydrogen desorption. The first stage is the hydrogen desorbing from the disproportionated mixture, and the second is the hydrogen desorbing from the NdH 2 from the grain boundary phase, which is accompanied by an endothermic reduction in temperature. This is in agreement with previous work on cast alloys. It has been shown for the first time that the recombination of the Nd 2 Fe 14 B phase can be separated from the desorption of hydrogen from NdH 2 by recombining at pressures >300 mbar. Recombination hold times <25 minutes at 350 mbar led to incomplete recombination and poor magnetic properties of the resultant powder. Fast evacuation of hydrogen after completion of recombination results in higher remanence than slow hydrogen removal due to a reduction in over-processing and grain growth. The coercivity of samples processed at 910 ºC, 800 mbar disproportionation pressure and 350 mbar recombination pressure is very low due to the high processing temperature, under-processing and large grain size due to 273
287 Chapter 12 Conclusions and Future Work incomplete disproportionation and grain growth after completion of recombination. Both the incomplete recombination and the over-processed grain growth have been shown for the first time using backscattered scanning electron microscopy. Effect of HDDR Treatment Temperature The hydrogen absorption peaks during disproportionation were monitored for the first time using mass flow controllers and showed that the peak broadened with increasing reaction temperature, which indicated that the reaction rate is reduced as the temperature is increased. By completing the HD and HDDR reactions in-situ, the chance of oxidation was significantly reduced compared to loading in air. The samples processed in-situ initiated disproportionation at lower pressures than those loaded in air and processed at the same temperature, from which it could be deduced that the formation of oxides at triple points impedes the absorption of hydrogen. This is the first time that the effect of oxidation on the disproportionation reaction of sintered NdFeB has been demonstrated using mass flow controllers. The reaction finish points however, were almost identical for air-exposed and in-situ processed samples, which suggests that the disproportionation reaction is not kinetically controlled, as a reduction in initiation pressure would lead to a reduction in finish pressure as the pressure ramp rate was kept constant. Adapting the recombination stage by monitoring the recovery of temperature and level of vacuum (10-2 mbar) after the endothermic desorption associated with recombination significantly reduced the possibility of under-processing and incomplete recombination that was observed in chapter 7. For sintered starting materials of composition A, it was found that 880 ºC was the optimum processing temperature as a clear peak in remanence, coercivity and maximum energy product were achieved by samples processed in-situ and after air-transfer. 274
288 Chapter 12 Conclusions and Future Work Reproducibility and large batches HD-treated samples of composition A transferred into the HDDR rig in air result in a blackened oxidised coating after completion of the reaction. The oxidised powder exhibits very poor magnetic properties and effectively dilutes the magnetic properties of the sample. The magnetic properties of the HDDR processed powders vary depending on proportion of oxidised powder in the measured sample. Homogeneous mixing of the powdered sample could significantly reduce or eliminate this variation. There was very little variation in magnetic properties between HDDR treated particles smaller than and bigger than 100 µm. After careful removal of the oxidised powder from the powder bulk, there is very little variation in magnetic properties across a single batch. Processing 20 g, 50 g and 100 g batches shows very little variation in magnetic properties in terms of remanence and coercivity. Increasing the batch size to 400 g however, leads to large variations in magnetic properties due to a combination of incomplete recombination and the effect of the large endothermic reaction that occurs during recombination. The variation in magnetic properties when scaling up batch size has only previously been demonstrated for isotropic material produced from cast alloys which also showed small amounts of variation. The incomplete recombination reduces the coercivity due to the presence of soft magnetic iron in the disproportionated mixture nucleating reverse domains during magnetisation reversal. The remanence of samples from the 400 g batch is lower than samples from 20, 50 and 100 g batches due to a mixture of incomplete recombination and a reduction in anisotropy due to large endothermic temperature fluctuations during recombination. This effect of scaling up anisotropic HDDR processing has not been reported for recycling of sintered NdFeB. An adaptation to the HDDR system to compensate for temperature fluctuations would improve processing of large batches. 275
289 Chapter 12 Conclusions and Future Work Mixed Input Feeds Samples with different starting compositions react differently during hydrogen decrepitation. Samples with low Dy and zero Co absorb hydrogen over a broad peak, whereas samples containing 1.8 at% Dy and 5 at% Co absorb in one sharp peak accompanied by a large exothermic increase in temperature. This comparison has not previously been studied for processing of sintered NdFeB alloys. The initiation time of decrepitation is determined by surface roughness, not sample composition as it is not consistently reproducible. Input feeds containing 1.8 at % Dy and 5 at% Co require a higher disproportionation pressure than low Dy and low Co containing samples as Dy and Co stabilise the Nd 2 Fe 14 B phase against disproportionation, which has been previously demonstrated for cast alloys only using conventional HDDR. Increasing the disproportionation pressure for low Dy, Co- free samples reduces the remanence of the resultant powder due to over-processing. Mixed input feeds can be processed simultaneously by increasing disproportionation pressure to ensure complete disproportionation. The disproportionation of each mixed input feed can be used to identify the amount of each composition present in the mixture by looking at the hydrogen absorption traces. However, incomplete recombination can be observed in the batches of mixed compositions. A large variation of magnetic properties across the samples is attributed to a combination of over-processing of low Dy and Co containing input feed during disproportionation and changes in the recombination reaction temperature due to the endothermic nature of the reaction leading to incomplete recombination. This is the first time that the HDDR process has been used to process mixed input feeds that represent real scrap feeds for recycling and is an original piece of work. 276
290 Chapter 12 Conclusions and Future Work Bonded magnets Isotropic bonded magnets made from HD and HDDR recycled sintered NdFeB can be produced using epoxy resin or PTFE as binding agents. The epoxy resin method ensures each particle is coated due to mixing in a carrier fluid but requires a relatively long preparation and curing time. The PTFE bonding method requires very little preparation time however, inhomogeneous mixing does not ensure complete particle coating. The average density of the bonded magnets is ~0.6 g cm -3 lower than the theoretical maximum, which is attributed to the large range of particle shapes and sizes within the fully processed powder. Production of anisotropic magnets has been unsuccessful to date due to a combination of low hydraulic pressure in the ram system resulting in reduced pressing pressures and a poor alignment field. 277
291 Chapter 12 Conclusions and Future Work Future Work Improve the HDDR rig to allow increased control of pressures <300 mbar Improve the HDDR rig to compensate for temperature fluctuations during disproportionation and recombination Improve vacuum capabilities for better oxygen control Increase the volume capabilities for processing large batches Investigate effect of more compositional ranges and additives on HDDR processing of sintered magnets Improve mixing process for multi-composition input feeds TEM analysis on the triple points that remain unreacted throughout the HDDR process Analyse blackened and grey powders using techniques such as XRD, SEM and WDS to determine composition and phase presence Determine exact nucleation method for recombination to deduce whether kinetically or diffusion controlled Change dies for isotropic bonded magnets to allow higher compaction pressures Use lower viscosity binding agents to aid with densification Improve the aligning press to allow for production of high density anisotropic bonded magnets 278
292 Appendix Appendix Chapter 4 Materials and Methods Measurement Uncertainty Analysis for Permeameter and VSM Permeameter Measurements Source of Uncertainty ± % Probability distribution Divisor Standard Uncertainty Source of Uncertainty ± % Probability distribution Divisor Standard Uncertainty Measurement of H Measurement of Hc Pick up coil calibration 0.5 Normal Pick up coil calibration 0.5 Normal Integrator calibration (man spec) 1 Normal Integrator calibration (man spec) 1 Normal Repeatability 0.3 Rectangular Repeatability 0.5 Rectangular Zero-ing of external field 0.1 Rectangular Searching for Hc 0 Rectangular 3 0 Effect of temperature fluctuation 0.2 Normal Effect of temperature fluctuation 0.2 Normal Sum of squares 1.39 Sum of squares 1.54 Combined Uncertainty Assumed Normal Combined Uncertainty Assumed Normal Expanded Uncertainty Assumed Normal (k=2) Expanded Uncertainty Assumed Normal (k=2) Declared Uncertainty 2.40% Declared Uncertainty 2.50% at a confidence level of 95% at a confidence level of 95% Measurement of J Measurement of remanence Fluxmeter calibration (man. Spec.) 1 Normal Fluxmeter calibration (man. Spec.) 1 Normal Sample diameter 0.1 Normal Sample diameter 0.1 Normal Sample cross sectional area 0.1 Normal Sample cross sectional area 0.1 Normal Repeatability 0.3 Rectangular Repeatability 0.5 Rectangular Effect of temperature fluctuation 0.2 Normal Effect of temperature fluctuation 0.2 Normal Sum of squares 1.15 Sum of squares 1.31 Combined Uncertainty Assumed Normal Combined Uncertainty Assumed Normal Expanded Uncertainty Assumed Normal (k=2) Expanded Uncertainty Assumed Normal (k=2) Declared Uncertainty in J 2.20% Declared Uncertainty in Remanence 2.30% at a confidence level of 95% at a confidence level of 95% VSM Measurements Source of Uncertainty ± % Probability distribution Divisor Standard Uncertainty Source of Uncertainty ± % Probability distribution Divisor Standard Uncertainty Measurement of H Measurement of Hc Field Accuracy 0.05 Normal Field Accuracy 0.05 Normal Field Stability 0.05 Normal Field Stability 0.05 Normal Repeatability 0.15 Rectangular Repeatability 0.15 Rectangular Absolute Accuracy 0.2 Rectangular Absolute Accuracy 0.2 Rectangular Output Stability 0.05 Rectangular Output Stability 0.05 Rectangular Effect of Temperature Fuctuation 0.2 Rectangluar Effect of Temperature Fluctuation 0.2 Rectangular Sample Alignment (1/180ºC) Rectangular Sum of squares 0.11 Sum of squares Combined Uncertainty Assumed Normal Combined Uncertainty Assumed Normal Expanded Uncertainty Assumed Normal (k=2) Expanded Uncertainty Assumed Normal (k=2) Declared Uncertainty 0.70% Declared Uncertainty 0.70% at a confidence level of 95% at a confidence level of 95% Measurement of J Measurement of remanence Calibration Stability 0.01 Normal Calibration Stability 0.01 Normal Repeatability 0.15 Rectangular Repeatability 0.15 Rectangular Absolute Accuracy 0.2 Rectangular Absolute Accuracy 0.2 Rectangular Output Stability 0.05 Rectangular Output Stability 0.05 Rectangular Effect of Temperature Fluctuation 0.2 Rectangluar Effect of Temperature Fluctuation 0.2 Rectangular Sample Alignment (1/180ºC) Rectangular Sample Alignment (1/180ºC) Rectangular Sample Mass 0.1 Normal Sum of squares Sum of squares Combined Uncertainty Assumed Normal Combined Uncertainty Assumed Normal Expanded Uncertainty Assumed Normal (k=2) Expanded Uncertainty Assumed Normal (k=2) Declared Uncertainty in J 0.70% Declared Uncertainty in Remanence 0.70% at a confidence level of 95% at a confidence level of 95% Figure App
293 Appendix Chapter 8 - Effect of HDDR Treatment Demagnetisation curves for figure 8.5. Figure App.8.5A Figure App.8.5B 280
294 Appendix Figure App.8.5C Figure App.8.5D Figure App.8.5E Figure App.8.5F 281
295 Appendix Demagnetisation Curves for figure 8.9 Figure App.8.9A Figure App.8.9B Figure App.8.9C Figure App.8.9D 282
296 Appendix Figure App.8.9E Figure App.8.9F 283
297 Appendix Chapter 9 Reproducibility & Large Batches Demagnetisation Curves for Figure 9.3 Figure App.9.3A Figure App.9.3B 284
298 Appendix Figure App.9.3C Demagnetisation Curves for Figure 9.4. Figure App.9.4A Figure App.9.4B 285

299 Appendix Figure App.9.4C Figure App9.4D Figure App.9.4E Figure App.9.4F 286
300 Appendix Demagnetisation Curves for Figure 9.5 Figure App.9.5A Figure App.9.5B Figure App.9.5C 287

301 Appendix Demagnetisation Curves for Figure 9.6 Figure App.9.6A Figure App.9.6B Figure App.9.6C Figure App.9.6D 288
INTRODUCTION:- 1.Classification of magnetic material Diamagnetic
 INTRODUCTION:- Ferrites are ferromagnetic material containing predominantly oxides iron along with other oxides of barium, strontium, manganese, nickel, zinc, lithium and cadmium.ferrites are ideally suited
Glossary of Magnetic Terms
 AlNiCo Permanent magnets based upon alloys containing aluminum, nickel, cobalt, iron + additions. They are very stable materials and are not sensitive to moderate temperature changes or mildly corrosive
The use of hydrogen in the processing of permanent magnets: Future prospects
 The use of hydrogen in the processing of permanent magnets: Future prospects Andy Williams Dept of Metallurgy and Materials University of Birmingham UK Advanced Magnetic Materials and their Applications
Magnets. Fα1/d 2. Brief History
 Magnets Brief History The ancient Greeks (Magnesia Greece) and Chinese are credited as the first to find and use a naturally occurring iron ore called magnetite. The key to their discovery was that magnetite
Stephan Treml. Magnetic Separation -Basics- Product Manager Magnetic Systems. Product Purity. Greater Security. Added Value.
 S+S Separation and Sorting Technology GmbH Product Purity. Greater Security. Added Value. Stephan Treml Product Manager Magnetic Systems Magnetic Separation -Basics- Table of Content History of magnets...
INTRODUCTION TO MAGNETIC MATERIALS
 INTRODUCTION TO MAGNETIC MATERIALS Second Edition B. D. CULLITY University of Notre Dame С D. GRAHAM University of Pennsylvania 4>IEEE PRESS WILEY A JOHN WILEY & SONS, INC., PUBLICATION PREFACE TO THE
Electronic materials and components-inductive components
 Electronic materials and components-inductive components Inductive components make use of the voltage that is generated when a field changes either on the same piece of wire (self-induction) or in a nearby
Magnetism: a force of attraction or repulsion by magnetic materials. Copper, plastic, and glass attracted to magnets.
 Discuss What is a Magnet? Magnetism: a force of attraction or repulsion by magnetic materials. Copper, plastic, and glass attracted to magnets. Steel, iron, and nickel attracted to magnets. o These materials
NdFeB. Title Here. for High Temperature Motor Applications. Author Venue. Steve Constantinides. Date. with Dale Gulick
 NdFeB Title Here for High Temperature Motor Applications Author Venue Steve Constantinides Date with Dale Gulick SMMA Fall Technical Conference November 3-5, 24 1 Arnold Magnetic Technologies Topics Magnet
Phase Transitions Module γ-2: VSM study of Curie Temperatures 1 Instructor: Silvija Gradečak
 3.014 Materials Laboratory November 13 th 18 th, 2006 Lab week 3 Phase Transitions Module γ-2: VSM study of Curie Temperatures 1 Instructor: Silvija Gradečak Objectives: a) Understand magnetic and thermal
7. FERROMAGNETIC MATERIALS. aligned atomic dipoles
 7. FERROMAGNETIC MATERIALS 7.1 What are ferromagnets? Earlier, in Section 6.2, we considered the following visualization of atomic dipoles in a material in a uniform applied B field: aligned atomic dipoles
TRADE OF HEAVY VEHICLE MECHANIC
 TRADE OF HEAVY VEHICLE MECHANIC PHASE 2 Module 2 Basic Electricity/Batteries UNIT: 1 Table of Contents 1.0 Learning Outcome... 1 1.1 Key Learning Points... 1 2.0... 2 2.1 What is... 2 2.2 Classification
CONTENTS PART II. MAGNETIC PROPERTIES OF MATERIALS
 PART I. INTRODUCTION 1. CONCEPTS OF FERROMAGNETISM I Magnetic Field 1 Intensity of Magnetization and Magnetic Induction 2 Magnetization and Permeability Curves 3 Hysteresis Loop 4 Ferromagnetism, Paramagnetism
HOEGANAES INSULATED POWDER COMPOSITES CHARACTERISTICS AND ELECTROMAGNETIC APPLICATION GUIDELINES
 HOEGANAES INSULATED POWDER COMPOSITES CHARACTERISTICS AND ELECTROMAGNETIC APPLICATION GUIDELINES HOEGANAES INSULATED POWDER COMPOSITES INTRODUCTION The molecular field theory was developed nearly years
Making Materials Matter: Measuring Magnetism
 Making Materials Matter: Measuring Magnetism Introduction Magnets are critical for a whole variety of modern applications. Perhaps the most noticeable are in motors and generators, but they are also an
Rare Earth Magnets: Yesterday, Today And Tomorrow. John Ormerod Senior Technology Advisor Magnet Applications, Inc.
 Rare Earth Magnets: Yesterday, Today And Tomorrow John Ormerod Senior Technology Advisor Magnet Applications, Inc. Quotes About Research If we knew what we were doing, it wouldn t be called research. -
Sintering Effects on Structural and Magnetic Behaviours of NdFeB Magnets
 Armenian Journal of Physics, 2015, vol. 8, issue 4, pp. 185-190 Sintering Effects on Structural and Magnetic Behaviours of NdFeB Magnets Ishfaq Ahmad Shah 1, Tahir Abbas 1, Zaka Ullah 1*, Najam ul Hassan
Magnetism 1. In this presentation you will: explore how magnets can be used to investigate magnetism. Next >
 Magnetism 1 In this presentation you will: explore how magnets can be used to investigate magnetism Introduction Magnetism was recognized as a naturally occurring phenomenon by Greek philosophers as long
Ferromagnetic Transitions
 Ferromagnetic Transitions Module γ -3: Phase Transitions and Magnetic Properties Jorge Feuchtwanger Objectives: 1. understand the chemical order-disorder transition and how it alters magnetic properties,
Current Technology Status and Future Needs For Rare Earth Permanent Magnets For Industrial Applications. John Ormerod Magnet Applications, Inc.
 Current Technology Status and Future Needs For Rare Earth Permanent Magnets For Industrial Applications John Ormerod Magnet Applications, Inc. 1 Outline Markets And Applications PM Principles Back to Basics
Gravitational field Magnetic field
 L 27 Electricity & Magnetism [5] Magnetism Magnetism Magnets permanent magnets electromagnets the Earth s magnetic field magnetic forces applications 1 two sources of magnetism permanent magnets electromagnets
Nanomagnetism. R. A. Buhrman. Center for Nanoscale Systems (www.cns.cornell.edu) Cornell University
 Cornell University") Nanomagnetism R. A. Buhrman Center for Nanoscale Systems (www.cns.cornell.edu) Cornell University Magnetism! Before Nanoscience and Nanotechnology there was The nation that controls magnetism will control
Nanomagnetism R. A. Buhrman Center for Nanoscale Systems (www.cns.cornell.edu) Cornell University Magnetism! Before Nanoscience and Nanotechnology there was The nation that controls magnetism will control
Unit 7. Magnetism Electromagnetism Electromagnetic Induction
 Unit 7 Magnetism Electromagnetism Electromagnetic Induction 1 Magnetism Origin of the term magnetism The Ancient Greeks discovered a mysterious mineral which attracted iron, and would point North if it
Magnetism. L 27 Electricity & Magnetism [5] 29:006 EXAM 3 Wednesday April 11 Lectures 19 through 28
![Magnetism. L 27 Electricity & Magnetism [5] 29:006 EXAM 3 Wednesday April 11 Lectures 19 through 28](/thumbs/84/90587142.jpg "Magnetism. L 27 Electricity & Magnetism [5] 29:006 EXAM 3 Wednesday April 11 Lectures 19 through 28") 29:006 EXAM 3 Wednesday April 11 Lectures 19 through 28 29:006 FIAL EXAM FRIDAY MAY 11 3:00 5:00 PM I LR1 VA 1 L 27 Electricity & Magnetism [5] Magnetism Magnets permanent magnets Electromagnets The Earth
29:006 EXAM 3 Wednesday April 11 Lectures 19 through 28 29:006 FIAL EXAM FRIDAY MAY 11 3:00 5:00 PM I LR1 VA 1 L 27 Electricity & Magnetism [5] Magnetism Magnets permanent magnets Electromagnets The Earth
B H. Magnetic materials
 Magnetic materials In engineering applications the ferromagnets are used because of their high μ, which enable high magnetic induction to be obtained with only modest magnetic field. (Their ability to
Effect of Nb on The HDDR Behaviour and The magnetic Properties of NdFeB Alloys
 Garyounis University Press Journal of Science and Its Applications Vol. 1, No. 2, pp 79-101, September 2007 97 Effect of Nb on The HDDR Behaviour and The magnetic Properties of NdFeB Alloys F. M. Alyamani
Causes for residual magnetism on parts. Residual magnetism of steel products:
 Causes for residual magnetism on parts Residual magnetism of steel products: Physical background, causes, existing field configurations, hard magnetic spots, recurrence of magnetism, concentration effects
A comparison of chosen permanent magnets arrangements for high gradient magnetic fields generation
 A comparison of chosen permanent magnets arrangements for high gradient magnetic fields generation ALEŠ HÁLA Department of Electrical Engineering and Electronics University of Defence Kounicova 65, 612
PM Generators and the Magnet price development. Drivetrain concepts for wind turbines Bremen, 22.Oct Christian Contini, Dipl.-Ing.
 PM Generators and the Magnet price development Drivetrain concepts for wind turbines Bremen, 22.Oct.2012 Christian Contini, Dipl.-Ing. (FH) PM Generator Overview Magnet Price Development Alternatives to
MODULE 4.2 MAGNETISM PERMANENT MAGNETS VISUAL PHYSICS ONLINE
 VISUAL PHYSICS ONLINE MODULE 4.2 MAGNETISM PERMANENT MAGNETS Powerful magnets are essential components in motors and generators. Some electric motors and generators rely upon a combination of a permanent
Properties of Materials
 Properties of Materials Thermal Properties Thermal Conductivity Temperature Wall The Thermal Conductivity (k) is the measure of the ability of a material to transmit heat by conduction. The heat (Q) is
MAGNETISM GRADE 10 CAPS SUTHERLAND HIGH SCHOOL PHYSICAL SCIENCE R. BASSON
 MAGNETISM GRADE 10 CAPS SUTHERLAND HIGH SCHOOL PHYSICAL SCIENCE R. BASSON THE BEGINNING Greek shepherd found that the nails in his shoes and the metal tip in his staff was attracted to a black rock. This
MICROMAGNETISM AND THE MICROSTRUCTURE OF FERROMAGNETIC SOLIDS
 MICROMAGNETISM AND THE MICROSTRUCTURE OF FERROMAGNETIC SOLIDS HELMUT KRONMULLER MANFRED FÄHNLE Max-Planck-lnstitut fiir Metallforschung, Stuttgart, Germany CAMBRIDGE UNIVERSITY PRESS Acknowledgements page
Magnetism I. Physics 2415 Lecture 14. Michael Fowler, UVa
 Magnetism I Physics 2415 Lecture 14 Michael Fowler, UVa Today s Topics A bit more about RC circuits Magnets and compasses Magnetic fields from electric currents Force on an electric current in a magnetic
Permanent Magnet Options: How To Select The Optimum Solution For Your Application.
 Permanent Magnet Options: How To Select The Optimum Solution For Your Application. Dr. John Ormerod Senior Technology Advisor Magnet Applications, Inc. Presentation Outline Introductions. Major permanent
Lines of force shape pole
 Discuss What is a Magnet? Magnetism: a force of attraction or repulsion by magnetic materials. Are not Copper, plastic, and glass attracted to magnets. are Steel, cobalt, iron, and nickel attracted to
Chapter 1. Introduction Antiferromagnetic and Ferromagnetic Materials: Soft and Hard
 Introduction 1.1.- Antiferromagnetic and Ferromagnetic Materials: Soft and Hard Some magnetic phenomena, like the ability of certain materials to attract pieces of iron or the property of being oriented
Recycling of Nd-Fe-B magnets by hydrogen processing and resintering
 Recycling of Nd-Fe-B magnets by hydrogen processing and resintering E. Herraiz 1, M. Degri 1, A. Bradshaw 1, R.S. Sheridan 1, V.S.J. Mann 1, I.R. Harris 1, A. Lixandru 2,3, I. Poenaru 2,3, K. Guth 2, R.
Magnets. Permanent vs. Temporary Magnets. Characteristics. Name originates from the region of Magnesia, a part of Greece
 Magnets Name originates from the region of Magnesia, a part of Greece Location of the first found naturally occurring magnetic rocks lodestone Magnet: a material that produces an invisible magnetic field
THE EFFECT OF TIC ADDITION ON MAGNETIC PROPERTIES OF ATOMISED NDFEB PERMANENT MAGNETIC POWDER
 THE EFFECT OF TIC ADDITION ON MAGNETIC PROPERTIES OF ATOMISED NDFEB PERMANENT MAGNETIC POWDER M. H. Saleh, E.A. Othman, F. Ismail, P. Hussain, M. Mohammad AMREC, SIRIM BHD. Lot 34, Jalan Hi-Tech 2/3, Kulim
Nature of Magnetism. Figure B-1 Bohr s model of the atom. For application help: call Honeywell Sensing and Control 79
 Nature of Magnetism Magnetism is considered by some to be a mysterious phenomenon. This is not true, except insofar as the ultimate nature of gravity, electrostatic fields, matter, and radiation are also
EQ: How do magnets work, and can they be useful?
 EQ: How do magnets work, and can they be useful? Magnets can be man-made or are found naturally in a mineral called magnetite (a type of iron). There are two stories of how the first magnets were discovered:
glossary magnetglossary
 magnet Magnetism is a broad and well-researched science with a language of its own. Our magnet, culled from respected resources around the internet, is your one-stop shop for clear definitions of key magnet
8600 Series VSM Measurement Results
 86 Series VSM Measurement Results B. C. Dodrill.8.6.4.2 -.2 -.4 -.6 -.8-5 -25 25 5.2.15.1.5 -.5 -.1 -.15 -.2-15 -1-5 5 1 15 45 9 135 18 614.891.2243 www.lakeshore.com NOISE AND LOW MOMENT Figure 1a and
EHE TECHNICAL BULLETIN. Ferrimagnetic 1 materials for HF welding impeders. TB1010. History. Composition. Manufacturing Process
 BULLETIN EHE TECHNICAL TB1010 Ferrimagnetic 1 materials for HF welding impeders. There is now a wide variety of ferrite types available from several manufacturers around the world. Only a small number
THE INFLUENCE OF THE POSTSINTERING TREATMENT ON THE MAGNETIC PROPERTIES FOR (Nd,Dy)(Fe,Al)B PERMANENT MAGNETS
(Fe,Al)B PERMANENT MAGNETS") Romanian Reports in Physics, Volume 56, No. 3, P. 399-403, 2004 THE INFLUENCE OF THE POSTSINTERING TREATMENT ON THE MAGNETIC PROPERTIES FOR (Nd,Dy)(Fe,Al)B PERMANENT MAGNETS W. Kappel 1, Mirela-Maria Codescu
Romanian Reports in Physics, Volume 56, No. 3, P. 399-403, 2004 THE INFLUENCE OF THE POSTSINTERING TREATMENT ON THE MAGNETIC PROPERTIES FOR (Nd,Dy)(Fe,Al)B PERMANENT MAGNETS W. Kappel 1, Mirela-Maria Codescu
NEOREC(NEODYMIUM-IRON-BORON) MAGNETS
 MAGNETS") NEOREC(NEODYMIUM-IRON-BORON) MAGNETS Introduction... 1 Features/Applications... 2 / Characteristics Distribution... 3 Irreversible Demagnetization Characteristics... Magnet Structures/Magnetic Characteristics/
NEOREC(NEODYMIUM-IRON-BORON) MAGNETS Introduction... 1 Features/Applications... 2 / Characteristics Distribution... 3 Irreversible Demagnetization Characteristics... Magnet Structures/Magnetic Characteristics/
The Why & How of Magnets The sources of nearly all magnetic effects in matter are the electrons in atoms.
 The Why & How of Magnets The sources of nearly all magnetic effects in matter are the electrons in atoms. There are two ways in which electrons create magnetism: 1. Electrons around the nucleus and their
UNIT 11: ELECTROMAGNETISM. Content: Learning Aims: Initial Activities
 UNIT 11: ELECTROMAGNETISM Content: Unit 11 Electromagnetism 11.1. Magnets: natural and artificial 11.2. Magnetization 11.3. Poles: magnetic properties 11.4. Magnetic field 11.5. The compass 11.6. Electromagnet
The Effect of Magnetic Field on Oil Based Ferrofluid in Field Reversible Thermal Connector Interface
 American Journal of Energy and Power Engineering 2017; 4(6): 105-112 http://www.aascit.org/journal/ajepe ISSN: 2375-3897 The Effect of Magnetic Field on Oil Based Ferrofluid in Field Reversible Thermal
COBALT Essential to High Performance Magnetics
 COBALT Essential to High Performance Magnetics Robert Baylis Manager Industrial Minerals Research Roskill Information Services Ltd. London, UK Steve Constantinides Director of Technology Arnold Magnetic
Recycling of permanent magnets of WEEE
 Recycling of permanent magnets of WEEE Challenges and Innovation in Recycling Processes, June, 2-3 2015 Nour-Eddine Menad & A. Seron BRGM / Waste and Raw Material Unit Challenges and Innovation in Recycling,
11 th September 2009 Rare Earth Metals: Mine to Market
 11 th September 2009 Rare Earth Metals: Mine to Market Advanced Rare Earth Projects Advanced Rare Earth Projects Steenkampskraal (Rareco), South Africa REE Environmental Uses Wind Power Hybrid Vehicles
Magnets MR. BANKS 8 TH GRADE SCIENCE
 Magnets MR. BANKS 8 TH GRADE SCIENCE What is a magnet? A magnet is any material that attracts iron or other ferromagnetic materials. Magnets can be natural or man-made. Ferromagnetic material A Ferromagnetic
The Nature of Magnetis111
 The Nature of Magnetis111 What Do All Magnets Have in Common? 1. Obtain a bar magnet and a horseshoe magnet. 2. See how many paper clips you can make stick to different parts of each magnet. 3. Draw a
Rare earths: essential elements for the transition to a low-carbon economy. Koen Binnemans KU Leuven University of Leuven (Belgium)
") Rare earths: essential elements for the transition to a low-carbon economy Koen Binnemans KU Leuven University of Leuven (Belgium) Fossil carbon CO 2 emission Source: http://ec.europa.eu Source: www.ucsusa.org
Rare earths: essential elements for the transition to a low-carbon economy Koen Binnemans KU Leuven University of Leuven (Belgium) Fossil carbon CO 2 emission Source: http://ec.europa.eu Source: www.ucsusa.org
Preparation of NdFe 10.5 V 1.5 N x powders with potential as high-performance permanent magnets
 J. Phys. D: Appl. Phys. 31 (1998) 282 286. Printed in the UK PII: S0022-3727(98)84246-0 Preparation of NdFe 10.5 V 1.5 N x powders with potential as high-performance permanent magnets Jinbo Yang, Bo Cui,
EEC Terminology Guide
 EEC Terminology Guide 1:5 --- An intermetallic compound comprised of two or more elements including Sm and Co. 1:5 is the atomic ratio between rare earth elements (Sm and Gd) and the transition metal,
Just doing our bit to help make better cars. High-performance thin-shape anisotropic magnets FB13B / FB14H
 Just doing our bit to help make better cars. High-performance thin-shape anisotropic magnets FB13B / FB14H Making a giant leap toward slimmer ferrite magnets Magnet usage is considered a barometer of the
Maximum Energy Products (MGOe) 10 Maximum Energy Products (kj/m ) 3
 10 Maximum Energy Products (kj/m ) 3") 60 Maximum Energy Products (MGOe) 480 400 320 240 160 80 0 50 40 30 20 10 0 Maximum Energy Products (kj/m ) 3 Guiding principles which led to the new magnets: Old Transition New Guiding principle Alnico
60 Maximum Energy Products (MGOe) 480 400 320 240 160 80 0 50 40 30 20 10 0 Maximum Energy Products (kj/m ) 3 Guiding principles which led to the new magnets: Old Transition New Guiding principle Alnico
I think it is a deficiency in the Amateur Radio syllabus that questions are not asked on magnetism.
 Reading 8 Ron Bertrand VK2DQ http://www.radioelectronicschool.com MAGNETISM There are no questions in either the NAOCP or AOCP exam about magnetism. You are justified then in asking why we are doing this
Industrial developmentof materials forsustainable development(magnets + magneto-caloric materials) M. Katter
 M. Katter") Industrial developmentof materials forsustainable development(magnets + magneto-caloric materials) M. Katter 11.09.08 PowderMetallurgy the industrialproduction route forhighly efficient magnetic parts
Industrial developmentof materials forsustainable development(magnets + magneto-caloric materials) M. Katter 11.09.08 PowderMetallurgy the industrialproduction route forhighly efficient magnetic parts
Rare Earth-Transition Metal Compounds: Magnetism and Applications E. Burzo Faculty of Physics, Babes-Bolyai University Cluj-Napoca, Romania
 Rare Earth-Transition Metal Compounds: Magnetism and Applications E. Burzo Faculty of Physics, Babes-Bolyai University Cluj-Napoca, Romania The rare-earth or yttrium (R) transition metal (M) compounds
Peculiarity of Pr-containing permanent magnets
 Peculiarity of Prcontaining NdFe FeB permanent magnets ERA_NET_RUS Development of LowTemperature Hard Magnetic Materials and HighCurrent HighField FeBased Superconductors for Innovative Technologies Russian
Magnetism and Field Theory
 Magnetism and Field Theory Section 1: Introduction In this lesson you will describe the domain theory of magnetism with special reference to dipoles state the Law(s) of magnetic forces explain how the
Keywords: Pr-based alloys; magnetic materials; hydrides; magnetic properties
 Materials Science Forum Vols. 591-593 (2008) pp 96-101 Online available since 2008/Aug/19 at www.scientific.net (2008) Trans Tech Publications, Switzerland doi:10.4028/www.scientific.net/msf.591-593.96
SPH3U UNIVERSITY PHYSICS
 SPH3U UNIVERSITY PHYSICS ELECTRICITY & MAGNETISM L (P.548-552) Activity: INSTRUCTIONS A. Cover a bar magnet with a sheet of acetate. Carefully sprinkle iron filings around the bar magnet onto the acetate
Magnetostriction Theory and Applications of Magnetoelasticity
 Magnetostriction Theory and Applications of Magnetoelasticity Etienne du Tremolet de Lacheisserie Döcteur es Sciences Physiques С, Directeur de Recherche Laböratöi/e" de. Jvlagnetisme "Louis Neel" Centre
HYDROGEN DECREPITATION (HD), HISTORY AND APPLICATIONS IN THE PRODUCTION OF PERMANENT MAGNETS
, HISTORY AND APPLICATIONS IN THE PRODUCTION OF PERMANENT MAGNETS") International Journal of Advanced Research in Engineering and Technology (IJARET) Volume 7, Issue 5, September-October 2016, pp. 37 44, Article ID: IJARET_07_05_005 Available online at http://www.iaeme.com/ijaret/issues.asp?jtype=ijaret&vtype=7&itype=5
International Journal of Advanced Research in Engineering and Technology (IJARET) Volume 7, Issue 5, September-October 2016, pp. 37 44, Article ID: IJARET_07_05_005 Available online at http://www.iaeme.com/ijaret/issues.asp?jtype=ijaret&vtype=7&itype=5
Chapter 8 Nanoscale Magnetism
 Chapter 8 Nanoscale Magnetism 8.1 Characteristic length scales 8.2 Thin films 8.3 Thin film heterostructures 8.4 Wires and needles 8.5 Superparamagnetism 8.6 Bulk nanostructures TCD March 2007 1 One nanoscale
Texture and properties - II
 Texture and properties - II Texture and Hall-Petch strength The Hall-Petch equation 0 k d - ½ where, 0 = k = d = lattice frictional stress locking parameter average grain size modifies for textured polycrystals
Bonded Magnets: Material and Process Update. Dr. John Ormerod Senior Technology Advisor Magnet Applications, Inc.
 Bonded Magnets: Material and Process Update Dr. John Ormerod Senior Technology Advisor Magnet Applications, Inc. Presentation Outline Introduction Permanent Magnet Basics Bonded Magnet Overview New Materials
Enhanced Nucleation Fields due to Dipolar Interactions in Nanocomposite Magnets
 Enhanced Nucleation Fields due to Dipolar Interactions in Nanocomposite Magnets Johann Fischbacher, Simon Bance, Lukas Exl, Markus Gusenbauer, Harald Oezelt, Franz Reichel and Thomas Schrefl St. Poelten
Structural and Magnetic Properties of Neodymium - Iron - Boron Clusters
 University of Nebraska - Lincoln DigitalCommons@University of Nebraska - Lincoln Mechanical (and Materials) Engineering -- Dissertations, Theses, and Student Research Mechanical & Materials Engineering,
Magnetic Properties. WHY STUDY the Magnetic Properties of Materials? FIRST PAGES. Chapter
 1496T_c20_76-113 10/31/05 16:31 Page 76 Chapter 20 Magnetic Properties P hotomicrographs of an iron single crystal, showing magnetic domains and their change in shape as a magnetic field (H) is applied.
Magnetism and Geomagnetism: Basics and Concepts
 Magnetism and Geomagnetism: Basics and Concepts Introduction: If you go by the term Geomagnetism, it consists of two segments. Geo means Earth and Magnetism means a property of a substance (for example
Magnetic Properties of Electrodeposited Nanocrystalline Ni-Fe alloys
 Magnetic Properties of Electrodeposited Nanocrystalline Ni-Fe alloys Minghe Wang Supervisor: Dr. Marek Niewczas 701 Graduate Seminar 18 th September, 2012 Origin of the magnetism Only atoms with partially
History of the Magnet:
 Magnets History of the Magnet: More than 2,000 years ago, people living in Magnesia, Greece, discovered an unusual rock. The rock attracted materials that contained iron. The rock they found contained
Rare Earth Permanent Magnets: Raw Materials, Magnets and Opportunities. S. R. Trout
 Rare Earth Permanent Magnets: Raw Materials, Magnets and Opportunities S. R. Trout Outline Background Raw Materials Rare Earth Magnets Applications Final Thoughts Background SmCo 5 1976 Pittsburgh Background
中国磁源材料有限公司 China Magnets Source Material Limited
 中国磁源材料有限公司 China Magnets Source Material Limited Brief Introduction of CMS Magnets Set up in 1990, China Magnets Source Material Limited (CMS Magnets) specializes in research and development, production
Solidification and Crystallisation 5. Formation of and control of granular structure
 MME 345 Lecture 08 Solidification and Crystallisation 5. Formation of and control of granular structure Ref: [1] A. Ohno, The Solidification of Metals, Chijin Shokan Co. Ltd., 1976 [2] P. Beeley, Foundry
Permanent Magnets
 Permanent Magnets 2010-2020 By Walter T. Benecki Terry K. Clagett Stanley R. Trout A professionally bound book designed to be a resource for every sector of the Global Permanent Magnet Industry including
Why Rare Earth Prices are Likely to Continue Their Upward Trend
 Why Rare Earth Prices are Likely to Continue Their Upward Trend Magnetics 2007 Conference April 4-5, 2007 Chicago, Illinois Presented by Walter T. Benecki Consultant to the Worldwide Magnetics Industry
THE INTERNATIONAL JOURNAL OF SCIENCE & TECHNOLEDGE
 THE INTERNATIONAL JOURNAL OF SCIENCE & TECHNOLEDGE Analysis of Fuel and Exhaust Gases of SI Engine by Using Magnet V. A. Jundale Assistant Professor, SRES, College of Engineering, Kopargaon, Maharashtra,
Lecture 12: High Temperature Alloys
 Part IB Materials Science & Metallurgy H. K. D. H. Bhadeshia Course A, Metals and Alloys Lecture 12: High Temperature Alloys Metallic materials capable of operating at ever increasing temperatures are
Leadership in Soft Magnetic Alloys
 Leadership in Soft Magnetic Alloys Carpenter Technology Corporation offers a wide selection of soft magnetic alloys to meet your material specifications. Choose from high permeability alloys, shielding
01 Introduction to the Course. Introduction to Metallurgy and Materials. Welcome to MME131: January 2018 Term
 Welcome to MME131: Introduction to Metallurgy and Materials January 2018 Term A. K. M. B. Rashid Professor, Department of MME BUET, Dhaka 01 Introduction to the Course Topics to Cover Why study materials
MODULE 4.2 MAGNETISM MAGNETIC PROPERTIES OF MATERIALS VISUAL PHYSICS ONLINE
 VISUAL PHYSICS ONLINE MODULE 4.2 MAGNETISM MAGNETIC PROPERTIES OF MATERIALS If we try to magnetize samples of brass, iron, glass, etc, in a current-carrying solenoid, only some materials show any magnetic
CHAPTER 8 THE d- and f- BLOCK ELEMENTS
 CHAPTER 8 THE d- and f- BLOCK ELEMENTS SYNOPSIS : Iron, copper, silver and gold are among the transition elements. The names transition metals and inner transition metals are often used to refer to the
Magnetic properties of stainless steels. Dr M.Mantel R&D Center Ugitech Fr. Schmolz&Bickenbach Group
 Magnetic properties of stainless steels Dr M.Mantel R&D Center Ugitech Fr. Schmolz&Bickenbach Group PCV EXPO MOSCOW October 2009 SUMMARY 1. How an electro-valve functions 2. Magnetism and ferromagnetism
SOLID STATE
 SOLID STATE Short Answer Questions: 1. Derive Bragg s equation? Ans. Bragg s equation: W.H. Bragg has proposed an equation to explain the relation between inter planar distance (d) and wave length ( λ
Electrochemical response of permanent magnets in different solutions
 Electrochemical response of permanent magnets in different solutions G. Gaona-Tiburcio, F. Almeraya-Calderón, J. G. Chacón-Nava, J. A. Matutes-Aquino, A. Martínez-Villafañe Abstract Materials for permanent
Neutron radiation damage study and cost estimate of a hybrid magnet for the XFEL
 Neutron radiation damage study and cost estimate of a hybrid magnet for the XFEL Fredrik Hellberg and Anders Hedqvist MSL-08-1 8 September 2008 Manne Siegbahn Laboratory Stockholm University Contents 1
Rare Earth Elements or REEs: Strategic Elements of Future
 Rare Earth Elements or REEs: Strategic Elements of Future REEs are naturally occurring, and include Lanthanides (lanthanum [La] through lutetium [Lu]), and Yttrium (Y) (which behaves like the Lanthanides).
Switching characteristics of submicron cobalt islands
 Switching characteristics of submicron cobalt islands R. D. Gomez a) and M. C. Shih Department of Electrical Engineering, University of Maryland, College Park, Maryland 20742 R. M. H. New IBM Almaden Research
Temperature time profile this determines the grain growth, i.e. their final size in the order of some µm, and the properties of grain boundaries.
 Custom Services for Magnetic Components A user guide to soft magnetic materials (part 3 of 4) Ferrites Soft magnetic ferrites are principally a ceramic material, i.e. sintered grains of non metallic (semiconducting)
Ph.D. Admission 20XX-XX Semester X
 Ph.D. Admission 20XX-XX Semester X Written Examination Materials Science & Engineering Department, IIT Kanpur Date of Examination: XX XXXX 20XX Timing: XX:XX XX:XX XX Application# Please read these instructions
Nickel-based pigments the versatile alternatives
 Nickel-based pigments the versatile alternatives Dr. Tony Hart Hart Coating Technology, Brierley Hill, West Midlands, U.K. Metallic pigments have, for a number of decades, provided an essential tool in
Humankind has used iron products since at least 1200 B.C. Even though
 Metallography of Steels Interpretation of Structure and the Effects of Processing Hubertus Colpaert Updated and Translated by André Luiz V. da Costa e Silva Copyright 2018 ASM International All rights
Structural and magnetic characterization of Nd-based Nd-Fe and Nd-Fe-Co-Al metastable alloys D I S S E R T A T I O N
 Structural and magnetic characterization of Nd-based Nd-Fe and Nd-Fe-Co-Al metastable alloys D I S S E R T A T I O N for the partial fulfillment of the requirements for the academic degree of Doctor rerum