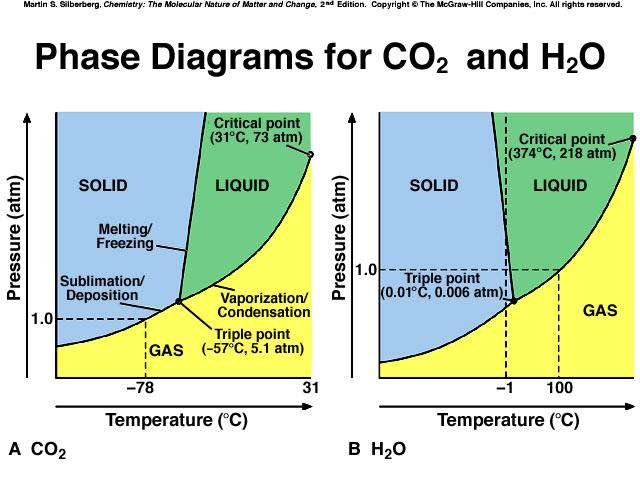
Phase Diagrams of Pure Substances Predicts the stable phase as a function of P total and T. Example: water can exist in solid, liquid and vapor
|
|
|
- Clarissa Newman
- 6 years ago
- Views:
Transcription
1 PHASE DIAGRAMS Phase a chemically and structurally homogenous region of a material. Region of uniform physical and chemical characteristics. Phase boundaries separate two distinct phases. A single phase system is called homogeneous. A system with two or more phases is called heterogeneous. Phase Diagram a graphic representation showing the phase or phases present for a given composition, temperature and pressure. Component the chemical elements which make up the alloy. Solvent atoms: primary atomic species. Host atoms Solute atoms: the impurities. Normally the minor component Solubility Limit Maximum concentration of solute atoms that may dissolve in the solvent to form a solid solution. The excess of solute forms another phase of different composition. Example: water sugar
2 Phase Diagrams of Pure Substances Predicts the stable phase as a function of P total and T. Example: water can exist in solid, liquid and vapor phases, depending on the conditions of temperature and pressure. Characteristic shape punctuated by unique points. Phase equilibrium lines Triple Point (three different phases of water in equilibrium) Critical Point Example: In the pressure temperature (PT) phase diagram of water there exists a triple point at low pressure (4.579 torr) and low temperature ( o C) where solid, liquid and vapor phases of water coexists. Vaporization Line Liquid and vapor coexists Freezing Line Liquid and solid coexist. Sublimation Line Solid and vapor coexist

3 Phase Any portion including the whole of a system, which is physically homogeneous within it and bounded by a surface so that it is mechanically separable from any other portions.
4
5 Gibbs Phase Rule From thermodynamic considerations, J.W. Gibbs ( American physicist University of Yale) derived the following equation: P + F C + 2 Where P number of phases which coexists in a given system F degrees of freedom C number of components in the system 2 one can vary temperature and pressure F 0 zero degrees of freedom. Neither P or T can be change (a point invariant point) F 1 one degree of freedom. One variable (P or T) can be changed independently (a line) F 2 two degrees of freedom. Two variables (P or T) can be changed independently (an area).
6 Schematic unary phase diagram for magnesium, showing the melting and boiling temperatures at one atmosphere pressure. C 1 for pure magnesium Point A: P 1 for pure liquid phase 2+CF+P 2+1F+1 F2 degrees of freedom change pressure and temperature in liquid Phase. Point B: P 2 for liquid and solid 2+CF+P 2+1F+2 F1 degrees of freedom change pressure or temperature (and the other variable is dependent to stay on the line).
7 Point X: P 3 (liquid, solid and vapor coexist) 2+CF+P 2+1F+3 F0 degrees of freedom pressure and temperature are fixed at the the single point called the triple point.
8 Example For pure substance where P and T can be changed P + F C Pure substance in a triple point, then C 1 (one component) P 3 (number of phases that coexist) The value of F is zero (zero degrees of freedom) the three phases coexist in a point. and For pure substance where P and T can be changed P + F Pure substance in a freezing line, then C 1 (one component) coexist) and P 2 (number of phases that The value of F is one (one degree of freedom) the two phases (solid and liquid) coexist in a line.
9 Solubility: The amount of one material that will completely dissolve in a second material without creating a second phase. Unlimited solubility: When the amount of one material that will dissolve in a second material without creating a second phase is unlimited. Limited solubility When only a maximum amount of a solute material can be dissolved in a solvent material.


10 Solid Solution:

11 Solid solution strengthening Increasing the strength of a metallic material via the formation of a solid solution. Dispersion strengthening Strengthening, typically used in metallic materials, by the formation of ultra fine dispersions of a second phase. The effects of several alloying elements on the yield strength of copper. Resistance to dislocation motion (loss in ductility)


12 Microstructure The structure observed under a microscope Al Brake more than one phase Iron chromium alloy one phase (solid solution)
13 Phase Equilibria Free energy: a function of the internal energy of a system Equilibrium: a system is at equilibrium if its free energy is at a minimum Phase equilibrium: for a system which has more than one phase Phase Diagram is a diagram with T and Composition as axes. They define the stability of the phases that can occur in an alloy system at constant pressure (P). The plots consist of temperature (vertical) axis and compositional (horizontal) axis. Constitution: is described by (a) the phases present (b) the composition of each phase (c) the weight fraction of each phase
14 Isomorphous Phase Diagrams Binary phase diagram A phase diagram for a system with two components (C2). Ternary phase diagram A phase diagram for a system with three components (C3). Isomorphous phase diagram A phase diagram in which components display unlimited solid solubility. Liquidus temperature The temperature at which the first solid begins to form during solidification. Solidus temperature The temperature below which all liquid has completely solidified. Freezing range between the liquidus and solidus.
15 Binary isomorphous systems Binary alloy: A mixture of two metals is called a binary alloy and constitute a two component system. Each metallic element in an alloy is called a separate component. [Sometimes a compound is considered a component, (e.g., iron carbide)] Isomorphous System: In some metallic systems, the two elements are completely soluble in each other in both the liquid and solid states. In these systems only a single type of crystal structure exists for all compositions of the components (alloy) and therefore it is called isomorphous system.
16 Example: Binary Isomorphous System (Cu Ni) T<1085 o C: Cu & Ni are mutually soluble in solid state complete solubility both have the same FCC structures, atomic radii and electronegativities are nearly identical similar valences isomorphous
 the composition of each phase (c) the weight fraction of each")
17 Interpretation of Phase Diagrams Constitution: is described by (a) the phases present (b) the composition of each phase (c) the weight fraction of each phase
18
19 (a) Phases Present Point A: at T1100 o C 60wt% Ni 40wt% Cu Only phase is present Point B: at T 1250 o C 35wt%Ni 65wt% Cu Both & liquid phases are present at equilibrium (b) Composition of each phase Single phase: Point A: 60wt%Ni 40%Cu alloy at 1100 o C

20 Two phase region: Tie line: across the twophase region at the temperature of the alloy Point B: T1250 o C Composition of Liquid phase: C L 31.5wt%Ni 68.5%Cu Composition of phase: C 42.5wt%Ni 57.5wt%Cu
21 (c) Weight fraction of each phase Single phase: 100% Ex: Point A: 100% phase Two phase region: Ex: Point B LEVER RULE (Inverse Lever Rule) L L o L o L L C C C C W C C C C W S R R W S R S W + +
22 Example: Point B: C 0 35wt%Ni C 42.5%, C L 31.5% 68% or % or L s o s L L s L o c c c c W c c c c W Volume fraction For an alloy consisting of and β phases, the volume fraction of the phase is defined as β β β β β β β β β ρ ρ ρ ρ ρ ρ v v v W v v v W V V v v v V ;, 1 Then, the weight fractions are Where ν and ν β are the volumes of and β β β ρ W ρ W ρ W V + β β β β β ρ W ρ W ρ W V +
23 Derivation of the lever rule 1) All material must be in one phase or the other: 2) Mass of a component that is present in both phases equal to the mass of the component in one phase + mass of the component in the second phase: 3) Solution of these equations gives us the Lever rule. W + W L W c + W c L L 1 c o W c c o c c L L W L c c c c o L
24 Equilibrium Cooling Development of Microstructure in Isomorphous Alloys Example: 35wt%Cu 65wt%Ni system Slow cooling from point a to point e
25 a: 1300 o C: complete liquid with 35wt%Cu- 65wt%Ni b: ~1260 o C: first solid begin to form (-46wt%Ni) c: ~1250 o C: -43wt%Ni, L- 32wt%Ni d:~1220 o C: last liquid to solidify e: 35wt%Cu 65wt%Ni solid phase
26 Nonequilibrium Cooling Development of Microstructure in Isomorphous Alloys Fast cooling Compositional changes require diffusion
27 Diffusion in the solid state is very slow. The new layers that solidify on top of the existing grains have the equilibrium composition at that temperature Formation of layered (cored) grains. Tie line method to determine the composition of the solid phase is invalid. The tie line method works for the liquid phase, where diffusion is fast. Solidus line is shifted to the right (higher Ni contents), solidification is complete at lower T, the outer part of the grains are richer in the low melting component (Cu). Upon heating grain boundaries will melt first. This can lead to premature mechanical failure.
28 Complete solidification occurs at lower temperature and higher Nickel concentration than equilibrium Solid can t freeze fast enough: solidus line effectively shifted to higher Ni concentrations. Shift increases with faster cooling rates, slower diffusion
29 Mechanical properties of isomorphous alloys Solid solution strengthening

30 The mechanical properties of coppernickel alloys. Copper is strengthened by up to 60% Ni and nickel is strengthened by up to 40% Cu.

31 Solidification of a Solid Solution Alloy Segregation The presence of composition differences in a material, often caused by insufficient time for diffusion during solidification.

32 Non Equilibrium Solidification and Segregation Coring Chemical segregation in cast products, also known as microsegregation or interdendritic segregation. Homogenization heat treatment The heat treatment used to reduce the microsegregation caused during nonequilibrium solidification. Macrosegregation The presence of composition differences in a material over large distances caused by nonequilibrium solidification.
33 Invariant Points in Binary Systems Binary alloys two components at ambient pressure. Gibbs rule states that P + F If three phases coexists (P 3), they coexist at a point (zero degrees of freedom the invariant point, at a specific temperature and chemical composition Types of invariant points: eutectic, eutectoid, peritectic peritectoid, monotectic etc.
34 Five of the Most Important Three Phase Reactions (Invariant Points) in Binary Diagrams eutectic: Liquid/solid reaction eutectoid: solid/solid reaction

35 1150 o C: The in between point is at 15% B. δ + L are present above the point, γ is present below. The reaction is: δ + L γ, a peritectic 920 o C: This reaction occurs at 40% B: L1 γ + L2 a monotectic 750 o C: This reaction occurs at 70% B: L γ + β, a eutectic 450 o C: This reaction occurs at 20% B: γ + β, a eutectoid 300 o C: This reaction occurs at 50% B: + β μ or a peritectoid
36 Eutectic Systems The simplest kind of system with two solid phases is called a eutectic system. A eutectic system contains two solid phases at low temperature. These phases may have different crystal structures, or the same crystal structure with different lattice parameters. Examples: Pb(FCC) and Sn (tetragonal) solder systems Fe (BCC) and C (graphite hexagonal) cast irons Al (FCC) and Si (diamond cubic) cast aluminum alloys Cu(FCC) and Ag(FCC) high temperature solder
37 Cu/Ag Eutectic System Copper and Silver are both FCC, but their lattice parameters and atomic radii are very different, so they have limited solubility in the solid state. There are two solid stable phases and β, and at high temperatures there is a eutectic reaction where the solids, β and the liquid coexist. Heating L( CE ) ( CE ) + β ( CβE ) Cooling Hypoeutectic alloy An alloy composition between that of the lefthand side end of the tie line defining the eutectic reaction and the eutectic composition. Hypereutectic alloys An alloy composition between that of the righthand side end of the tie line defining the eutectic reaction and the eutectic composition.
38 Cu Ag System Cu: phase Ag: β phase Eutectic means easily melted in Greek Point E: invariant point (eutectic point) BG line: isotherm line
39 AB & FG: Solidus line BC & GH: Solvus line AE & EF: Liquidus line BEG: Solidus line, isotherm line T E : eutectic isotherm
40 Eutectic isotherm Invariant or eutectic point
41 Eutectic Reaction: For copper silver system: L Eutectic or invariant point Liquid and two solid phases co exist in equilibrium at the eutectic composition C E and the eutectic temperature T E. Eutectic isotherm horizontal solidus line at T E. L Heating ( C ) ( C ) + β ( C ) E Cooling Heating ( 71.9wt% Ag) ( 8.0wt% Ag) + β ( 91.2wt% Ag) Cooling E βe
42 Binary Eutectic System Eutectic reaction transition from liquid to mixture of two solid phases, + β at eutectic concentration C E. At most two phases can be in equilibrium. Three phases (L,, β) may be in equilibrium only at a few points along the eutectic isotherm. Single phase regions are separated by 2 phase regions.
43 Binary Eutectic System Compositions and relative amounts of phases are determined from the same tie lines and lever rule, as for isomorphous alloys demonstrate A B C
44 Example For Point C: 40wt%Sn 60wt%Pb alloy at 150 o C a) What are the phases present? b) What are the compositions of the phases present? c) Mass fraction? d) Volume fraction at 150 o C? Knowing that the densities of Pb and Sn are and 7.24g/cm 3, respectively
45 a) At C, and β phases coexist b) Draw Tie Line at 150 o C: For phase: C 10% 10wt%Sn 90wt%Pb For β phase: C β 98% 98wt%Sn 2wt%Pb C
46 c) Mass fraction: d) volume fraction: where β β β β C C C C W C C C C W β β β β ρ ρ ρ ν ν ν V V W W W V cm g cm g cm g C C cm g cm g cm g C C Pb Pb Sn Sn Pb Pb Sn Sn ρ ρ ρ ρ ρ ρ β β
47 L L+ Development of microstructure in eutectic alloys (I) Several types of microstructure formed in slow cooling an different compositions. Cooling of liquid lead/tin system at different compositions. In this case of lead-rich alloy (0-2 wt% of tin) solidification proceeds in the same manner as for isomorphous alloys (e.g. Cu-Ni) that we discussed earlier.
48 L Development of microstructure in eutectic alloys (II) +L +β At compositions between room temperature solubility limit and the maximum solid solubility at the eutectic temperature, β phase nucleates as the solid solubility is exceeded at solvus line.
49 Development of microstructure in eutectic alloys (III) Solidification at the eutectic composition (I) No changes above eutectic temperature, T E. At T E liquid transforms to and β phases (eutectic reaction). L +β


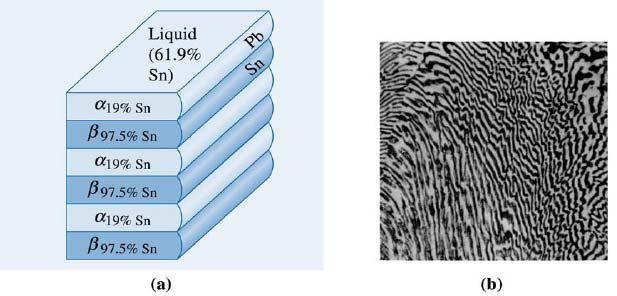
50 Development of microstructure in eutectic alloys (IV) Solidification at the eutectic composition (II) Compositions of and β phases are very different eutectic reaction involves redistribution of Pb and Sn atoms by atomic diffusion. Simultaneous formation of and β phases results in a layered (lamellar) microstructure:called eutectic structure. Formation of eutectic structure in lead tin system. Dark layers are leadreach phase. Light layers are the tin reach β phase.
51 Development of microstructure in eutectic alloys (V) Compositions other than eutectic but within the range of the eutectic isotherm Primary phase is formed in the + L region, and the eutectic structure that includes layers of and β phases (called eutectic and eutectic β phases) is formed upon crossing the eutectic isotherm.
52 L +L +β

53 Development of microstructure in eutectic alloys (VI) Microconstituent element of microstructure having a distinctive structure. For case described on previous page, microstructure consists of two microconstituents, primary phase and the eutectic structure. Although the eutectic structure consists of two phases, it is a microconstituent with distinct lamellar structure and fixed ratio of the two phases.
54 Compositions of and β phases are very different eutectic reaction involves redistribution of Pb and Sn atoms by atomic diffusion. Simultaneous formation of and β phases results in a layered (lamellar) microstructure:called eutectic structure. Formation of eutectic structure in lead tin system. Dark layers are leadreach phase. Light layers are the tinreach β phase.
55 Relative amounts of microconstituents? Eutectic microconstituent forms from liquid having eutectic composition (61.9 wt% Sn) Treat the eutectic as if it were a separate phase and apply lever rule to find relative fractions of primary phase (18.3wt% Sn) and eutectic structure (61.9wt% Sn): W e W P ( P + Q) Q ( P + Q)... eutectic... primary Terminal solid solution: a solid solution that exists over a composition range extending to either composition extremity of a binary phase diagram.
56

57 (a) A hypoeutectic lead tin alloy. (b) A hypereutectic lead tin alloy. The dark constituent is the lead rich solid, the light constituent is the tin rich solid β, and the fine plate structure is the eutectic (x400).

58 The effect of the chemical composition and strengthening mechanism on the tensile strength of lead tin alloys.

59 Eutectic colonies and interlamellar spacing
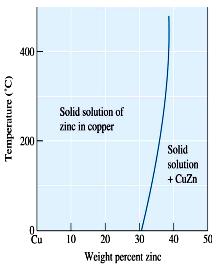
60 Equilibrium Diagrams Having Intermediate Phases or Compounds Copper-zinc Intermediate solid solution: β γ δ ε and η: two terminal solid solution β, γ, δ, & ε are intermediate phases
61 Intermetallic Compounds Ex: magnesiumlead phase diagram: Intermetallic compound: Mg 2 Pb can exist by itself only at the precise composition of 19wt%Mg 81wt%Pb
62 Eutectoid Reaction (Invariant Point E at 560 o C) Copper zinc δ cooling heating γ + ε Eutectoid reaction
63 Peritectic Reaction (Invariant Point P at 598 o C) Copper zinc δ + L cooling heating ε Peritectic reaction
Cu/Ag Eutectic System
 Eutectic Systems The simplest kind of system with two solid phases is called a eutectic system. A eutectic system contains two solid phases at low temperature. These phases may have different crystal structures,
Chapter 9 Phase Diagrams. Dr. Feras Fraige
 Chapter 9 Phase Diagrams Dr. Feras Fraige Chapter Outline Definitions and basic concepts Phases and microstructure Binary isomorphous systems (complete solid solubility) Binary eutectic systems (limited
Phase Diagrams. Phases
 Phase Diagrams Reading: Callister Ch. 10 What is a phase? What is the equilibrium i state t when different elements are mixed? What phase diagrams tell us. How phases evolve with temperature and composition
CHAPTER 9: PHASE DIAGRAMS
 CHAPTER 9: PHASE DIAGRAMS ISSUES TO ADDRESS... When we combine two elements... what equilibrium state do we get? In particular, if we specify... --a composition (e.g., wt%cu - wt%ni), and --a temperature
The Solubility Limit
 Phase Diagrams When we combine two elements... what equilibrium state do we get? In particular, if we specify... --a composition (e.g., wt%cu - wt%ni), and --a temperature (T) then... How many phases do
PHASE EQUILIBRIUM P + F = C + 2
 PHASE EQUILIBRIUM Component: is either pure metal and/or compound of which an alloy is composed. They refer to the independent chemical species that comprise the system. Solid Solution: It consists of
Metallic Materials-Phase Diagrams
 Engineering Alloys Metals and alloys have many useful engineering properties and so have wide spread application in engineering designs. Iron and its alloys (principally steel) account for about 90 percent
Cu-Ag phase diagram Brazil s map
 Phase Diagrams [9] Cu-Ag phase diagram Brazil s map 1> Some important definitions Component - chemically recognizable species (Fe and C in carbon steel, H2O and NaCl in salted water). A binary alloy contains
Chapter 9: Phase Diagrams
 Chapter 9: Phase Diagrams When we combine two elements... what equilibrium state do we get? In particular, if we specify... --a composition (e.g., wt% Cu - wt% Ni), and --a temperature (T ) then... How
PHASE DIAGRAMS. IE-114 Materials Science and General Chemistry Lecture-10
 PHASE DIAGRAMS IE-114 Materials Science and General Chemistry Lecture-10 Importance of Phase Diagrams There is a strong correlation between microstructure and mechanical properties. Phase diagrams provides
Chapter 10. Phase Diagrams
 Chapter 10 Phase Diagrams Chapter 10 Terminology and Unary System Phase Diagrams Issues to Address... When we combine two elements... what equilibrium state do we get? In particular, if we specify... --a
ENGR 151: Materials of Engineering LECTURE #15: PHASE DIAGRAMS
 ENGR 151: Materials of Engineering LECTURE #15: PHASE DIAGRAMS TENSILE TESTING VIDEO https://www.youtube.com/watch?v=-qukvzo2jse PROPERTIES OF ISOMORPHOUS ALLOYS Solid solution strengthening For Ni-Cu
The Science and Engineering of Materials, 4 th ed Donald R. Askeland Pradeep P. Phulé. Chapter 8 Solid Solutions and Phase Equilibrium
 The Science and Engineering of Materials, 4 th ed Donald R. Askeland Pradeep P. Phulé Chapter 8 Solid Solutions and Phase Equilibrium Objectives of Chapter 8 The goal of this chapter is to describe the
Equilibrium phase diagram of metallic alloy
 Equilibrium phase diagram of metallic alloy Motivation New structure, concentration (mixing level) (at what temperature? for how long? ) Phase Diagrams - Introduction. Many materials systems can exist
Introduction of Materials Materials Science SScience
 材料科學導論 Introduction of Materials Science 許正興國立聯合大學電機工程學系 1. Introduction of Materials Science and Engineering 2. Atomic Structure and Bonding 3. Crystal Structures and Crystal Geometry 4. Solidification,
Schematic representation of the development of microstructure. during the equilibrium solidification of a 35 wt% Ni-65 wt% Cu alloy
 Schematic representation of the development of microstructure during the equilibrium solidification of a 35 wt% Ni-65 wt% Cu alloy At 1300 ºC (point a) the alloy is in the liquid condition This continues
12/3/ :12 PM. Chapter 9. Phase Diagrams. Dr. Mohammad Abuhaiba, PE
 Chapter 9 Phase Diagrams 1 2 Learning Objectives 1. Isomorphous and eutectic phase diagrams: a. label various phase regions b. Label liquidus, solidus, and solvus lines 2. Given a binary phase diagram
Phase Diagrams, Solid Solutions, Phase Strengthening, Phase Transformations
 Phase Diagrams, Solid Solutions, Phase Strengthening, Phase Transformations Components and Phases Components: The elements or compounds that are mixed initially (Al and Cu). Phases: A phase is a homogenous,
ENGR 151: Materials of Engineering LECTURE #14: PHASE DIAGRAMS
 ENGR 151: Materials of Engineering LECTURE #14: PHASE DIAGRAMS ANNOUNCEMENTS Midterm #2 Monday, May 1. Review on Wednesday, April 26. Chapters 4, 6, 7, 8 TERMINOLOGY Phase: Homogeneous portion of a system
Chapter 11: Phase Diagrams
 Chapter 11: Phase Diagrams ISSUES TO ADDRESS... When we combine two elements... what is the resulting equilibrium state? In particular, if we specify... -- the composition (e.g., wt% Cu - wt% Ni), and
CHAPTER9. Phase Diagrams Equilibrium Microstructural Development
 CHAPTER9 Phase Diagrams Equilibrium Microstructural Development The microstructure of a slowly cooled eutectic soft solder ( 38 wt%pb wt % Sn) consists of a lamellar structure of tin-rich solid solution
CHAPTER 9 PHASE DIAGRAMS
 CHAPTER 9 PHASE DIAGRAMS PROBLEM SOLUTIONS 9.14 Determine the relative amounts (in terms of mass fractions) of the phases for the alloys and temperatures given in Problem 9.8. 9.8. This problem asks that
but T m (Sn0.62Pb0.38) = 183 C, so this is a common soldering alloy.
 = 183 C, so this is a common soldering alloy.") T m (Sn) = 232 C, T m (Pb) = 327 C but T m (Sn0.62Pb0.38) = 183 C, so this is a common soldering alloy. T m (Au) = 1064 C, T m (Si) = 2550 C but T m (Au0.97Si0.03) = 363 C, so thin layer of gold is used
T m (Sn) = 232 C, T m (Pb) = 327 C but T m (Sn0.62Pb0.38) = 183 C, so this is a common soldering alloy. T m (Au) = 1064 C, T m (Si) = 2550 C but T m (Au0.97Si0.03) = 363 C, so thin layer of gold is used
Slide 1. Slide 2. Slide 3. Chapter 10: Solid Solutions and Phase Equilibrium. Learning Objectives. Introduction
 Slide 1 Chapter 10: Solid Solutions and Phase Equilibrium 10-1 Slide 2 Learning Objectives 1. Phases and the phase diagram 2. Solubility and solid solutions 3. Conditions for unlimited solid solubility
Two Components System
 Two Components System Three independent variables: T, P, compositions In general, constant pressure (fixed parameter). P+F=C+1 Simple Eutectic System The binary eutectic phase diagram explains the chemical
MAE 212: Spring 2001 Lecture 14 PHASE DIAGRAMS AND EQUILIBRIUM MICROSTRUCTURES N. Zabaras
 ME 212: Spring 2001 Lecture 14 PHSE DIGRMS ND EQUILIRIUM MICROSTRUCTURES N. Zabaras For more details on the topic read Chapter 9 of the Materials Science for Engineers by J. Shackelford, pp. 304 353. lso
Copyright The McGraw-Hill Companies, Inc. Permission required for reproduction or display. Phase Diagram
 SE104 Structural Materials Phase Diagram Dr. Yu Qiao Department of Structural Engineering, UCSD Introduction Phase: A region in a material that differs in structure and function from other regions. Phase
Modeling Diffusion: Flux
 Modeling Diffusion: Flux Flux (#/area/time): J = 1 A dm dt Directional Quantity y Jy kg atoms m 2 or s m 2 s Jx Jz x z Flux can be measured for: --vacancies and interstitials --host (A) atoms --impurity
CHAPTER 9: PHASE DIAGRAMS
 CHAPTER 9: PHASE DIAGRAMS ISSUES TO ADDRESS... When we combine two elements... what equilibrium state do we get? In particular, if we specify... --a composition (e.g., wt%cu - wt%ni), and --a temperature
ENGINEERING COUNCIL CERTIFICATE LEVEL ENGINEERING MATERIALS C102 TUTORIAL 3 THERMAL EQUILIBRIUM (PHASE) DIAGRAMS
 DIAGRAMS") ENGINEERING COUNCIL CERTIFICATE LEVEL ENGINEERING MATERIALS C102 TUTORIAL 3 THERMAL EQUILIBRIUM (PHASE) DIAGRAMS UNIT OUTCOMES On successful completion of the unit the candidate will be able to: 1. Recognise
ENGINEERING COUNCIL CERTIFICATE LEVEL ENGINEERING MATERIALS C102 TUTORIAL 3 THERMAL EQUILIBRIUM (PHASE) DIAGRAMS UNIT OUTCOMES On successful completion of the unit the candidate will be able to: 1. Recognise
Engineering materials
 1 Engineering materials Lecture 6 Metal and Alloys Phase Diagrams 2 Metals and alloys Some metals may have more than one crystal structure, a phenomenon known as polymorphism ( 同質異性 ), when found in elemental
Binary phase diagrams
 inary phase diagrams inary phase diagrams and ibbs free energy curves inary solutions with unlimited solubility Relative proportion of phases (tie lines and the lever principle) Development of microstructure
The Stabilities of phase
 The Stabilities of phase What is a phase? A phase is a form of matter that is uniform throughout in chemical composition and physical state Example Fig 1. White phosphorus Fig 2.Black phosphorus Fig 3.
Phase diagrams. R.D.Makwana,IT,NU. R.D.Makwana,IT,NU
 Phase diagrams Phase?? Phase is region throughout which all properties of material are essentially uniform Uniform region of a system which has uniform physical and chemical characteristics Phase diagram?
the Phase Diagrams Today s Topics
 MME 291: Lecture 04 Interpretation of the Phase Diagrams Prof. A.K.M.B. Rashid Department of MME BUET, Dhaka Today s Topics Interpretation of phase diagrams Development of microstructures during equilibrium
solvent: component of a solution present in the greatest amount in alloy.
 Phase Equilibrium Diagrams:- Phase equilibrium diagram is a graphic relationship between temperature and weight ratios of elements and alloys contribute to the built of the diagram. Phase diagrams provide
Phase Diagrams. Today s Topics
 MME 291: Lecture 05 Eutectic Type Phase Diagrams Prof. A.K.M.B. Rashid Department of MME BUET, Dhaka Today s Topics Binary eutectic systems with partial miscibility Nomenclatures and invariant reaction
Material Properties and Phase Diagrams
 PY2M20 Material Properties and Phase Diagrams ecture 5 P. Stamenov, PhD School of Physics, TCD PY2M20-5 Phase Diagrams - Introduction How much can be done with pure elemental compounds? How many combinations
Chapter 10: Phase Diagrams
 hapter 10: Phase Diagrams Show figures 10-1 and 10-3, and discuss the difference between a component and a phase. A component is a distinct chemical entity, such as u, Ni, NiO or MgO. A phase is a chemically
Binary phase diagrams
 inary phase diagrams inary phase diagrams and ibbs free energy curves inary solutions with unlimited solubility Relative proportion of phases (tie lines and the lever principle) Development of microstructure
Chapter 9: Phase Diagrams
 Chapter 9: Phase Diagrams IUE TO ADDE... Common types of phase diagrams Isomorphous Eutectic Others Phase diagram and microstructure evolution Chapter 9-1 What is a phase? What is a component? Class Exercise
TALAT Lecture Phase Diagrams. 14 pages, 13 Figures. Basic Level
 TALAT Lecture 1203 Phase Diagrams 14 pages, 13 Figures Basic Level prepared by M H Jacobs * Interdisciplinary Research Centre in Materials The University of Birmingham, UK (Based on approach adopted by
Why do cocktail ice served in expensive restaurants are clear whereas the ice formed in your refrigerator is cloudy?
 Phase Diagrams Why do cocktail ice served in expensive restaurants are clear whereas the ice formed in your refrigerator is cloudy? What is a solder alloy? What is the best composition for solder? How
Phase diagrams (cont.) and the Fe-C system
 and the Fe-C system") Phase diagrams (cont.) and the Fe-C system Solidification: Pro-eutectic vs Eutectic Pro-eutectic solidification Ideal liquid, uniform distribution Solid Pb(Sn) () nucleates Solubility limit leads to Sn
Phase diagrams (cont.) and the Fe-C system Solidification: Pro-eutectic vs Eutectic Pro-eutectic solidification Ideal liquid, uniform distribution Solid Pb(Sn) () nucleates Solubility limit leads to Sn
CHAPTER 10 PHASE DIAGRAMS PROBLEM SOLUTIONS
 CHAPTER 10 PHASE DIAGRAMS PROBLEM SOLUTIONS Solubility Limit 10.1 Consider the sugar water phase diagram of Figure 10.1. (a) How much sugar will dissolve in 1000 g of water at 80 C (176 F)? (b) If the
Chapter 11: Phase Diagrams. Phase Equilibria: Solubility Limit
 Temperature ( C) Water ugar 217/1/4 Chapter 11: Phase Diagrams IUE TO ADDRE... When we combine two elements... what is the resulting equilibrium state? In particular, if we specify... -- the composition
In their simplest form, steels are alloys of Iron (Fe) and Carbon (C).
 and Carbon (C).") Iron-Carbon Phase Diagram Its defined as:- A map of the temperature at which different phase changes occur on very slow heating and cooling in relation to Carbon content. is Isothermal and continuous cooling
Iron-Carbon Phase Diagram Its defined as:- A map of the temperature at which different phase changes occur on very slow heating and cooling in relation to Carbon content. is Isothermal and continuous cooling
Introduction to the phase diagram Uses and limitations of phase diagrams Classification of phase diagrams Construction of phase diagrams
 Prof. A.K.M.B. Rashid Department of MME BUET, Dhaka Concept of alloying Classification of alloys Introduction to the phase diagram Uses and limitations of phase diagrams Classification of phase diagrams
Lecture 7: Solid State Reactions Phase Diagrams and Mixing
 Lecture 7: Solid State Reactions Phase Diagrams and Mixing Prof Ken Durose, Univ of Liverpool Text book for this lecture: Callister Materials Science and Engineering Learning objectives 1.Solid state reactions
Introduction to phase diagrams
 ASM Phase Diagram Database Diagram No. 901229 Department of Physics and Astronomy Introduction to phase diagrams William Meier Physics 590B Fall 2018 Outline Part 1 Introduction and basics Part 2 Fundamental
Alloys & Their Phase Diagrams. مرجع علمى مهندسى مواد
 Alloys & Their Phase Diagrams Objectives of the class Gibbs phase rule Introduction to phase diagram Practice phase diagram Lever rule Important Observation: One question in the midterm Gibbs phase rule
www-materials.eng.cam.ac.uk/typd
 Part IB Paper 3: MATERIALS Examples Paper 3/1: TEACH YOURSELF PHASE DIAGRAMS This examples paper forms part of an interactive online resource Teach Yourself Phase Diagrams which is available at: www-materials.eng.cam.ac.uk/typd
Materials Engineering. Phase transformation Phase diagrams
 Materials Engineering Phase transformation Phase diagrams Phase Transformation Why is it important for us? o Temperature, chemical composition and pressure can change the properties of materials o Understanding
the Phase Diagrams Today s Topics
 MME 291: Lecture 03 Introduction to the Phase Diagrams Prof. A.K.M.B. Rashid Department of MME BUET, Dhaka Today s Topics Concept of alloying Classification of alloys Introduction to the phase diagram
J = D C A C B x A x B + D C A C. = x A kg /m 2
 1. (a) Compare interstitial and vacancy atomic mechanisms for diffusion. (b) Cite two reasons why interstitial diffusion is normally more rapid than vacancy diffusion. (a) With vacancy diffusion, atomic
There are many types of alloying systems which they are:
 Phase Equilibrium Diagrams:- Phase equilibrium diagram is a graphic relationship between temperature and weight ratios of elements and alloys contribute to the built of the diagram. Where Phase is a uniform
Phase diagrams wt% of carbon in Fe microstructure of a lead tin alloy of eutectic composition
 Phase diagrams 0.44 wt% of carbon in Fe microstructure of a lead tin alloy of eutectic composition Primer Materials For Science Teaching Spring 2018 28.6.2018 What is a phase? A phase may be defined as
Lecture 3: Solutions: Activities and. Phase Diagrams
 Lecture 3: Solutions: Activities and Lecture plan: Phase Diagrams 21-09-2010 Gibbs phase rule vapour composition two-component phase diagrams phase diagrams in material science: microstructures in isomorphous
MSE 513 Homework #1 Due Jan. 21, 2013
 Reading: My class notes, pgs. 22-27. http://www1.asminternational.org/asmenterprise/apd/help/help.aspx Introduction to Phase diagrams, particularly: o Common terms o Binary diagrams o Features of phase
Chapter 9 Heat treatment (This chapter covers selective sections in Callister Chap. 9, 10 &11)
") Chapter 9 Heat treatment (This chapter covers selective sections in Callister Chap. 9, 10 &11) Study theme outcomes: After studying this chapter, students should or should be able to: - know and understand
Chapter 9 Heat treatment (This chapter covers selective sections in Callister Chap. 9, 10 &11) Study theme outcomes: After studying this chapter, students should or should be able to: - know and understand
Material Science. Prof. Satish V. Kailas Associate Professor Dept. of Mechanical Engineering, Indian Institute of Science, Bangalore India
 Material Science Prof. Satish V. Kailas Associate Professor Dept. of Mechanical Engineering, Indian Institute of Science, Bangalore 560012 India Chapter 6. Phase Diagrams Learning objectives: - To understand
Solidification & Binary Phase Diagrams II. Solidification & Binary Phase Diagrams II
 Module 19 Solidification & inary Phase Diagrams II ecture 19 Solidification & inary Phase Diagrams II 1 NPTE Phase II : IIT Kharagpur : Prof. R. N. hosh, Dept of Metallurgical and Materials Engineering
The internal structure of a material plays an important part on its mechanical properties.!
 Phase Diagrams The internal structure of a material plays an important part on its mechanical properties.! There is a strong correlation between micro structure and mechanical properties. Definitions Component!
Fe-Fe 3 C phase diagram is given on the last page of the exam. Multiple choices (2.5 points each):
:") Materials Science and Engineering Department MSE 200, Exam #3 ID number First letter of your last name: Name: No notes, books, or information stored in calculator memories may be used. Cheating will be
Materials Science and Engineering Department MSE 200, Exam #3 ID number First letter of your last name: Name: No notes, books, or information stored in calculator memories may be used. Cheating will be
LN Introduction to Solid State Chemistry. Lecture Notes No. 10 PHASE EQUILIBRIA AND PHASE DIAGRAMS
 3.091 Introduction to Solid State Chemistry Lecture Notes No. 10 PHASE EQUILIBRIA AND PHASE DIAGRAMS * * * * * * * * * * * * * * * * * * * * * * * * * * * * * * * * * * * * * * * * * * * * * * * * * Sources
MME292 Metallic Materials Sessional
 Department of Materials and Metallurgical Engineering angladesh University of Engineering and Technology, Dhaka MME292 Metallic Materials Sessional July 2016 Term Experiment 2 Construction and Interpretation
Phase change processes for material property manipulation BY PROF.A.CHANDRASHEKHAR
 Phase change processes for material property manipulation BY PROF.A.CHANDRASHEKHAR Introduction The phase of a material is defined as a chemically and structurally homogeneous state of material. Any material
Phase Transformations in Metals Tuesday, December 24, 2013 Dr. Mohammad Suliman Abuhaiba, PE 1
 Ferrite - BCC Martensite - BCT Fe 3 C (cementite)- orthorhombic Austenite - FCC Chapter 10 Phase Transformations in Metals Tuesday, December 24, 2013 Dr. Mohammad Suliman Abuhaiba, PE 1 Why do we study
Development of Microstructure in Eutectic Alloys
 CHAPTER 10 PHASE DIAGRAMS PROBLEM SOLUTIONS Development of Microstructure in Eutectic Alloys 10.16 Briefly explain why, upon solidification, an alloy of eutectic composition forms a microstructure consisting
Module 23. Iron Carbon System I. Lecture 23. Iron Carbon System I
 Module 23 Iron Carbon System I ecture 23 Iron Carbon System I 1 NPTE Phase II : IIT Kharagpur : Prof. R. N. Ghosh, Dept of Metallurgical and Materials Engineering Keywords : Ferrite (), Austenite (), Ferrite
Material Properties and Phase Diagrams
 PY2M20 Material Properties and Phase Diagrams Lecture 6 P. Stamenov, PhD School of Physics, TCD PY2M20-6 Microstructures in Eutectic ti Systems: I C o < 2 wt% Sn Result: - at extreme ends - polycrystal
Teach Yourself: Phase Diagrams and Phase Transformations
 Teach Yourself: Phase Diagrams and Phase Transformations Hugh Shercliff and Mike Ashby 5 th Edition, March 2009, Cambridge This Booklet is also found in Materials: Engineering, Science, Processing and
Phase Equilibria. Reading: West 7
 Phase Equilibria Reading: West 7 430 PHASE DIAGRAMS Also called equilibrium or constitutional diagrams Plots of temperature vs. pressure, or T or P vs. composition, showing relative quantities of phases
HOMEWORK 6. PROJECT WORK READINGS
 : materials science & solid state chemistry HOMEWORK 6. PROJECT WORK By the end of this week, your team may have a pretty good idea of where the project is heading, and your materials processing and analysis
Pre-Course Reading for ESI s Solidification Course
 Pre-Course Reading for ESI s Solidification Course A. B. Phillion, J. Dantzig The primary goal of ESI s Solidification Course is to relate material properties and solidification processing conditions to
Phase Diagrams & Phase Tranformation
 ep-16 Phase Diagrams & Phase Tranformation Microstructure - Phases Ferrite Cementite EM micrograph x magnification Plain C steel containing.44 wt. % C Basic Definitions Alloy: A metallic substance that
Thermal Analysis phase diagrams
 Thermal Analysis phase diagrams R W McCallum Ames Laboratory And Materials Science and Engineering Why Phase Diagrams Thermal analysis gives us information about phase transitions which are the lines on
CHAPTER 9 PHASE DIAGRAMS PROBLEM SOLUTIONS
 CHAPTER 9 PHASE DIAGRAMS PROBLEM SOLUTIONS 9.17 A 90 wt% Ag-10 wt% Cu alloy is heated to a temperature within the β + liquid phase region. If the composition of the liquid phase is 85 wt% Ag, determine:
Two Metals Completely Soluble in the Liquid State and Completely Insoluble in the solid state
 Two Metals Completely Soluble in the Liquid State and Completely Insoluble in the solid state Technically, no two metals are completely insoluble in each other. However, in some cases the solubility is
From sand to silicon wafer
 From sand to silicon wafer 25% of Earth surface is silicon Metallurgical grade silicon (MGS) Electronic grade silicon (EGS) Polycrystalline silicon (polysilicon) Single crystal Czochralski drawing Single
ME 254 MATERIALS ENGINEERING 1 st Semester 1431/ rd Mid-Term Exam (1 hr)
") 1 st Semester 1431/1432 3 rd Mid-Term Exam (1 hr) Question 1 a) Answer the following: 1. Do all metals have the same slip system? Why or why not? 2. For each of edge, screw and mixed dislocations, cite
1 st Semester 1431/1432 3 rd Mid-Term Exam (1 hr) Question 1 a) Answer the following: 1. Do all metals have the same slip system? Why or why not? 2. For each of edge, screw and mixed dislocations, cite
5 a l l o y i n g b e h av i o r
 has dissolved in A to form a substitutional solid solution (igure 5.1b). It can be said also that this is a single-phase alloy. The word phase simply implies that the crystal structure and the alloy composition
Phase diagrams are diagrammatic representations of the phases present in a
 Chapter 4 What is a binary phase diagram? Phase diagrams are diagrammatic representations of the phases present in a system under specified equilibrium conditions, most often composition, temperature and
The Iron Iron Carbide (Fe Fe 3 C) Phase Diagram
 Phase Diagram") The Iron Iron Carbide (Fe Fe 3 C) Phase Diagram Steels: alloys of Iron (Fe) and Carbon (C). Fe-C phase diagram is complex. Will only consider the steel part of the diagram, up to around 7% Carbon. University
The Iron Iron Carbide (Fe Fe 3 C) Phase Diagram Steels: alloys of Iron (Fe) and Carbon (C). Fe-C phase diagram is complex. Will only consider the steel part of the diagram, up to around 7% Carbon. University
Binary Phase Diagrams - II
 Binary Phase Diagrams - II Note the alternating one phase / two phase pattern at any given temperature Binary Phase Diagrams - Cu-Al Can you spot the eutectoids? The peritectic points? How many eutectic
Metallurgy in Production
 In the Name of Allah University of Hormozgan Metallurgy in Production First semester 95-96 Mohammad Ali Mirzai 1 Chapter 6 : the iron carbon phase diagram 2 The Iron-Carbon Alloy Classification 3 The Iron-Carbon
26 Phase Diagram For Binary Alloys. Contents 2.1. INTRODUCTION SYSTEM, PHASES, STRUCTURAL CONSTITUENTS AND EQUILIBRIUM...
 26 Contents 2.1. INTRODUCTION... 27 2.2. SYSTEM, PHASES, STRUCTURAL CONSTITUENTS AND EQUILIBRIUM... 28 2.3. PHASE DIARGAM... 29 2.4. PHASE RULE (GIBBS RULE)... 31 2.5. TIME-TEMPERATURE COOLING CURVE...
PHASE DIAGRAMS UNDERSTANDING BASICS THE. Edited. F.C. Campbell. Materials Park, Ohio The Materials Information Society.
 PHASE DIAGRAMS UNDERSTANDING THE BASICS Edited by F.C. Campbell The Materials Information Society ASM International Materials Park, Ohio 44073-0002 www.asm i nternational.org Phase Diagrams Understanding
Metallurgy of Aluminum Die Casting Alloys EC 305 Dave Neff
 Metallurgy of Aluminum Die Casting Alloys EC 305 Dave Neff Dave Neff OUTLINE Where aluminum comes from Why alloys are useful Alloy designation and nomenclature Specific roles of alloy elements Properties
Teach Yourself Phase Diagrams
 Teach Yourself Phase Diagrams H.R. Shercliff, G.J. McShane, D. Delamore (Adapted from Ashby M.F., Shercliff H.R. & Cebon D., Materials: Engineering, Science, Processing and Design) Table of Contents PART
Solidification: basics and beyond Equilibrium and nonequilibrium solidification
 Solidification: basics and beyond Equilibrium and nonequilibrium solidification Prof. Dmitry Eskin BCAST NETCENG, 2015 1 Types of solidification reactions Equilibrium solidification 2 Gibbs phase rule
FUNDAMENTALS OF METAL ALLOYS, EQUILIBRIUM DIAGRAMS
 FUNDAMENTALS OF METAL ALLOYS, EQUILIBRIUM DIAGRAMS Chapter 5 5.2 What is a Phase? Phase is a form of material having characteristic structure and properties. More precisely: form of material with identifiable
[CLICK] [CLICK] [CLICK] [CLICK] [CLICK] [CLICK] [CLICK] [CLICK] [CLICK] [CLICK] [CLICK]
![[CLICK] [CLICK] [CLICK] [CLICK] [CLICK] [CLICK] [CLICK] [CLICK] [CLICK] [CLICK] [CLICK]](/thumbs/79/79522651.jpg "[CLICK] [CLICK] [CLICK] [CLICK] [CLICK] [CLICK] [CLICK] [CLICK] [CLICK] [CLICK] [CLICK]") A major principle of materials science is that PROPERTIES are related to STRUCTURE. A material s structure is only partly described by reporting the composition. You must also report the phases, composition
A major principle of materials science is that PROPERTIES are related to STRUCTURE. A material s structure is only partly described by reporting the composition. You must also report the phases, composition
Mohammad Anwar Karim Id :
 Department of Mechanical and Industrial Engineering ME 8109 Casting and Solidification of Materials EFFECTS OF RAPID SOLIDIFICATION ON MICROSTRUCTURE AND PROPERTIES OF AL, MG & TI ALLOYS Winter 2012 Presented
INSTITUTE OF AERONAUTICAL ENGINEERING (Autonomous) Dundigal, Hyderabad
 Dundigal, Hyderabad") INSTITUTE OF AERONAUTICAL ENGINEERING (Autonomous) Dundigal, Hyderabad -500 043 MECHANICAL ENGINEERING TUTORIAL QUESTION BANK Course Name METALLURGY AND MATERIAL SCIENCE Course Code AME005 Class III Semester
INSTITUTE OF AERONAUTICAL ENGINEERING (Autonomous) Dundigal, Hyderabad -500 043 MECHANICAL ENGINEERING TUTORIAL QUESTION BANK Course Name METALLURGY AND MATERIAL SCIENCE Course Code AME005 Class III Semester
Phase Behavior. Callister P. 252 Chapter 9
 Phase Behavior Callister P. 252 Chapter 9 1 Chalcolithic Era (7000 BC) (Copper Working) Bronze Age Copper and Arsenic (3000 BC) Ores from same site or Copper and Tin Alloys (2000 BC times vary around world)
(a) Put names on the phases and show what phases that are in equilibrium in the different areas of the phase diagram.
 Put names on the phases and show what phases that are in equilibrium in the different areas of the phase diagram.") Sett 5 Theme: Phase diagrams The tasks are cut from earlier exams. Task 1 Assume that the phases in the binary diagram under in Fig. 1. has such a minor solid solubility that they can be represented by
Sett 5 Theme: Phase diagrams The tasks are cut from earlier exams. Task 1 Assume that the phases in the binary diagram under in Fig. 1. has such a minor solid solubility that they can be represented by
Introduction to Phase Diagrams*
 ASM Handbook, Volume 3, Alloy Phase Diagrams H. Okamoto, M.E. Schlesinger and E.M. Mueller, editors Copyright # 2016 ASM International W All rights reserved asminternational.org Introduction to Phase Diagrams*
Engineering Materials and Processes Lecture 9 Equilibrium diagrams
 Lecture 9 Equilibrium diagrams Equilibrium diagrams Reference Text Higgins RA & Bolton, 2010. Materials for Engineers and Technicians, 5th ed, Butterworth Heinemann Section Ch 9 Additional Readings Callister,
Simulation of Solute Redistribution during Casting and Solutionizing of Multi-phase, Multi-component Aluminum Alloys
 Simulation of Solute Redistribution during Casting and Solutionizing of Multi-phase, Multi-component Aluminum Alloys F. Yi,* H. D. Brody* and J. E. Morral** * University of Connecticut, Storrs, CT 6269-336