ORIENTATION DEPENDENCE OF DISLOCATION STRUCTURE EVOLUTION OF ALUMINUM ALLOYS IN 2-D AND 3-D COLIN CLARKE MERRIMAN
|
|
|
- Georgiana Bryan
- 6 years ago
- Views:
Transcription
1 ORIENTATION DEPENDENCE OF DISLOCATION STRUCTURE EVOLUTION OF ALUMINUM ALLOYS IN 2-D AND 3-D By COLIN CLARKE MERRIMAN A thesis submitted in partial fulfillment of the requirements for the degree of: MASTER OF SCIENCE IN MATERIALS SCIENCE AND ENGINEERING WASHINGTON STATE UNIVERSITY School of Mechanical and Materials Engineering AUGUST 2007
2 To the Faculty of Washington State University: The members of the Committee appointed to examine the thesis of COLIN CLARKE MERRIMAN find it satisfactory and recommend that it be accepted. Chair ii
3 ACKNOWLEDGEMENTS I would like to express my deepest respect and gratitude to my advisor Dr. David P. Field for providing me the expert guidance, insight, vision, patience and tremendous help with the presented research. A special thanks Dr. Pankaj Trivedi and Scott Lindeman for their guidance, input, and assistance, without it I would have been lost while programming. I would also like to thank Dr. Hasso Weiland, Randy Burgess, and Julie Smith who are recognized for providing assistance in several areas. Lastly, Dr. Sergey Medyanik and Dr. David Bahr for their time and service as my master s committee members. My deepest gratitude is offered to Northrop Grumman and Alcoa Technical Center for their support of this research. iii
4 ORIENTATION DEPENDENCE OF DISLOCATION STRUCTURE EVOLUTION OF ALUMINUM ALLOYS IN 2-D AND 3-D ABSTRACT by Colin Clarke Merriman, M. S. Washington State University August 2007 Chair: David Field A proper understanding of the relationships that connect deformation, microstructural evolution and dislocation structure evolution is required to extend service lifetime of components, reduce the manufacturing costs, and improve product quality. This requires significant efforts in performing accurate analysis of undeformed and deformed microstructure and identifying the microstructural response to an applied stress, be it in compression tension, or fatigue. Current models are based on observed phenomenology of the process and therefore fail to predict microstructural response of a material beyond a given set of known parameters. Current research is aimed towards making contribution in the areas of (i) microstructural characterization, (ii) understanding the influence of various microstructural parameters on the evolution of dislocation structures and (iii) on relating the physically measurable microstructural parameters to stress response. In a continuing effort to improve characterization of the dislocation structures of materials the local orientation gradient in deformed polycrystalline samples is examined by the collection of electron back-scatter patterns. Along with the lower bound calculation of the excess dislocation content (planar dataset), a 3-D excess dislocation density calculation is introduced, for serial section datasets, to better understand the bulk microstructural response. In addition, the iv
5 excess dislocation density dependence on step size is examine to determine if there is proper step size to be used to for the excess dislocation density calculation. Microstructural evolution during small and large strain channel die deformation of aluminum alloy (AA) 1050 and AA 7050 T7541 was investigated using SEM techniques. From this the orientation dependence of dislocation structures was examined through the initial texture of the material and the plotting of excess dislocation content and Taylor factor in orientation space. It was observed that the Taylor factor and the initial texture has an influence on the deformation behavior and dislocation evolution of aluminum. Neighboring grains (including lattice orientation and dislocation content) and precipitate morphologies also were observed to play a significant role in the microstructural and dislocation response. The observed difference in the evolution of dislocation structures of AA 1050 and AA 7050 T7541 were attributed to their varying manufacturing parameters and differing alloy content. v
6 TABLE OF CONTENTS Page ACKNOWLEDGEMENTS iii ABSTRACT iv LIST OF TABLES ix LIST OF FIGURES x CHAPTERS 1. INTRODUCTION Effects of Microstructure Grain Size Effect Solid Solution Strengthening Strain Hardening Precipitation Hardening Crystalline Defects Dislocations Observations of Dislocations Outline of the Current Research References EXCESS DISLOCATION DENSITY CALCULATIONS FROM LATTICE CURVATURE: A COMPARISON OF 2-D AND 3-D DENSITIES vi
7 2.1 Introduction: Excess Dislocation Density: Experimental Procedures: Results: Discussion: Conclusions: References: ORIENTATION DEPENDENCE OF DISLOCATION STRUCTURE EVOLUTION DURING COLD ROLLING OF ALUMINUM Abstract: Introduction: Experimental Details: Results Discussion: Conclusions: References: ORIENTATION DEPENDENCE OF DISLOCATION STRUCTURE EVOLUTION OF AA Abstract: Introduction: vii
8 4.3 Experimental Details: Results Discussion: Conclusions: References: CONCLUSIONS SUGGESTIONS FOR FUTURE WORK APPENDIX A. 3-D EXCESS DISLOCATION DENSITY CALCULATION C++ CODE viii
9 LIST OF TABLES Page Table 1.1: Slip systems for FCC Crystals [13] Table 2.1: Excess dislocation density data for Figure 2.5 and Table 2.2: Excess dislocation density data for Figure 2.9 and Table 2.3: Excess dislocation density for AA 7050 sample and Cu single crystal dependence of step size (µm) Table 3.1: Excess dislocation density evolution data for AA 1050 in channel die deformation from undeformed state through 30% deformation for sample 1 and sample 3 by orientation. Dislocation cell size evolution from undeformed through 30% deformation Table 4.1: Excess dislocation density evolution data for AA 7050 T7451 in channel die deformation from undeformed state through 15% deformation by orientation. Dislocation cell size evolution from undeformed through 15% deformation ix
10 LIST OF FIGURES Page Figure 1.1: Stereographic unit triangle showing five different types of dislocation boundaries (labeled A E) formed in tensile deformed polycrystalline aluminum [4] Figure 1.2: Schematic showing the influence of cold work on strength and ductility of material [9] Figure 1.3: Schematic showing progressive movement of a dislocation through a 2-D crystal lattice [13] Figure 1.4: Schematics showing (a) edge dislocation and (b) screw dislocation in simple cubic lattice [13] Figure 2.1: Diffraction from lattice planes, indicating the geometry that leads to the derivation of Bragg s law Figure 2.2: Schematic showing the formation of Kikuchi pattern using EBSD in SEM [1] Figure 2.3: Graphical representation of calculation of excess dislocation density. The 2-D calculation assumes lattice curvature in 3 rd dimension is zero and only accounts for the curvature to the right and below the current. The 3-D calculation takes into account all points surrounding the current point Figure 2.4: Channel die deformation setup showing pseudo-internal surface (polished surface) Figure 2.5: ODF of AA 7050 T7 showing a cube texture along with a strong orientation at {110}<221> x
11 Figure 2.6: Serial section 2 (left) and 3 (right) for AA 7050 T7541 (Sample 1) deformed in channel die compression to a 5% height reduction at a strain rate of ~ 5.5x10⁻³ s -1. The 3-D average excess dislocation density was 1786x10 12 m -2 and the 2-D density was 946x10 12 m Figure 2.7: 2-D excess dislocation density map for serial section 2 (left) and 3 (right) for Sample 1. The average 2-D excess dislocation density was 958x10 12 m -2 and 942x10 12 m -2 respectively Figure 2.8: 3-D excess dislocation density map for serial section 2 (left) and 3 (right) for Sample 1. The average 3-D excess dislocation density was 1851x10 12 m -2 and 1722 x10 12 m -2 respectively Figure 2.9: 3-D OIM dataset of AA 7075 T651, 29 serial sections comprise the 14 µm thick dataset Figure 2.10: Excess dislocation density maps for the 3-D OIM dataset of AA 7075 T651, 29 serial sections comprise the 14 µm thick dataset with and average 3-D excess dislocation density of 3063 x10 12 m -2 and an average 2-D density of 1924 x10 12 m Figure 2.11: Excess dislocation density plotted with slice depth for comparison of 2-D and 3-D Figure 2.12: Orientation maps of AA 7050 T7541 deformed in channel die compression to a 10% height reduction at a strain rate of ~ 5.5x10⁻³ s -1 showing the declining grain definition as step size increases. Maps obtained using4 step sizes of 2, 10, 20 and 40 µm with an excess dislocation density of 174x10 12 m -2, 32.59x10 12 m -2, 20x10 12 m -2, and 10x10 12 m -2, from left to right xi
12 Figure 2.13: Orientation maps showing a variation of the lattice orientation indicating the dislocation structure. Maps obtained using step sizes of 0.2, 5, and 20 with an excess dislocation density of 1409x10 12 m -2, x10 12 m -2, and 33x10 12 m -2, from left to right Figure 2.14: Average excess dislocation density as a function of EBSD step size. The dashed line indicates the expected slope if noise is the only contribution to the measurement Figure 3.1: ODF of undeformed material showing a weak cube orientation with some retained brass Figure 3.2: Orientation images, from left to right, of undeformed (a), 5% (b), 10% (c), 15% (d), and 20% (e) reduction Figure 3.3: Excess dislocation density maps for the orientation images shown in Figure 3.2. Black areas are the lowest density (10 11 m -2 ) areas and regions of low confidence data while the lighter areas are the regions of highest excess dislocation density (10 15 m -2 ) Figure 3.4: Excess dislocation density and dislocation cell size for each deformation step. Excess dislocation density increases with increasing deformation while dislocation cell size decreases Figure 3.5 and 3.6: Excess dislocation density by orientation (left), initially the {001} increases at small strains more than the {011} and {111}, by a true strain of the {011} and {111} have increased to a greater density than the {001}. Excess dislocation density by orientation (right), {011} and {111} show an increase in excess dislocation density faster than the {001} grains do for true strain steps of xii
13 Figure 3.7: ODF of undeformed material of 2 µm scan shows the texture for a local area only Figure 3.8: Excess dislocation density plotted in orientation space for 20% deformed material. The {011}<122> orientation shows the strongest dislocation density for the local area Figure 4.1: ODF of undeformed material contains a combination of cube texture and fcc rolling texture, showing a weak β fiber. Scatter occurs as the β fiber approaches the rotated cube orientation {001}<110> along with the rotated cube orientation while no {111}<uvw> component is observed in ϕ 2 = Figure 4.2: Orientation images, from left to right, of undeformed (a), 5% (b), 10% (c), and 15% (d) reduction Figure 4.3: Excess dislocation density maps for the orientation images shown in Figure 2. Black areas are the lowest density (10 11 m -2 ) areas and regions of low confidence data while the lighter areas are the regions of highest excess dislocation density (10 15 m -2 ) Figure 4.4: Excess dislocation density and dislocation cell size for each deformation step. Excess dislocation density increases with increasing deformation while dislocation cell size decreases Figure 4.5: Excess dislocation density by orientation, initially the {011} start with a very high dislocation density due to the manufacturing process. Both {001} and {111} grains show a fairly linear increase throughout the deformation process, while the {011} jump significantly after 5% deformation xiii
14 Figure 4.6: Excess dislocation density plotted in ODF space. Initially fairly even distribution with a slight peak at an orientation of {110}<111> in the undeformed state. As deformation increases excess dislocation density increases steadily along the {111}<uvw> fiber Figure 4.7: Taylor factor plotted in orientation space for the undeformed material. A good correlation between regions of high Taylor factor >4.0 and regions of high excess dislocation density exist xiv
15 Dedication This thesis is dedicated to my family xv
16 CHAPTER 1 INTRODUCTION High performance components in aerospace applications are designed to aid in the reduction of manufacturing costs and extend the service lifetime of the airframe. Commercial, private, and military aerospace programs have driven a need for lighter and tougher materials, which has lead to a significant increase in the development and use of advanced structural materials. In addition, the prevalence of computer aided design (CAD) and finite element analysis (FEA) software combined with analytical tools for examining the microstructure and new methods of extrapolating material properties have increased our ability and need to tailor materials to specific applications. The transportation market has been turning more and more to light weight materials such as aluminum alloys to achieve significant weight-savings and achieve greater fuel economy. Modern military and commercial airframes in active service consist of 80% aluminum by weight. Aluminum is an essential material in manufacturing and is used for its excellent combination of properties, including low density, high-strength, corrosion-resistance, high electrical and thermal conductivity, and fatigue life. The United States aluminum industry is the world s largest, producing about $39.1 billion in products and exports and processing over 23 billion pounds of metal [1]. Top markets for the aluminum industry are transportation, packaging (i.e. beverage cans), and construction. Aluminum alloys used in structural applications are over-designed to ensure a high factor of safety, which leads to a significant increase in the cost of manufacturing. Typically this is done because of lack of proper understanding of how the initial microstructure 1
17 affects the deformation response of the material. Therefore, a proper understanding of the relationships that connect processing conditions, microstructural evolution and mechanical properties is required to optimize the processing parameters, reduce alloy content and improve product quality. 1.1 Effects of Microstructure During the manufacturing process of aluminum alloys, materials are subjected to a wide range of strain, strain rate and temperature. Since deformation induced during such processing is quite heterogeneous, materials possess a variety of microstructures and properties [2-3]. The initial microstructure of a material plays a critical role in defining the mechanical response of material during deformation and in the evolution of post deformation microstructure. Parameters that influence evolution of microstructure during deformation can be divided into two categories: processing parameters (strain, strain rate, temperature, ect.) and microstructural parameters (dislocation structures, precipitate morphologies, texture, grain size and shape, ect.). The evolution of dislocation boundaries in Al using TEM has shown that there is a strong correlation between evolution of dislocation boundaries and the grain orientation [4]. Figure 1.1 shows that different dislocation structures form in grains with different orientation. The difference between these five regions (marked A E) lies in the slip systems that are active. The microstructure and resulting properties of a metal are dynamic in behavior and may be altered by external forces such as applied loads, thermal changes, and chemical environments. Microstructural parameters such as grain size, solid solution morphology, precipitate morphology, dislocation structures etc., can be altered to achieve desired properties. The ability of a metal to plastically deform depends on the ability of dislocations to move, so restricting 2
18 dislocation motion makes the material stronger. Below is a brief review on some general strengthening mechanisms achieved by altering microstructure: Figure 1.1: Stereographic unit triangle showing five different types of dislocation boundaries (labeled A E) formed in tensile deformed polycrystalline aluminum [4] Grain Size Effect The yield strength of most crystalline solids increases with decreasing grain size. Quantitatively it is described by the Hall-Petch equation: 1/ 2 σ y = σ 0 + kd (1.2) where σ 0 is the yield strength of single crystal, k is a material constant, and D is the average grain size of the material [5-6]. For yielding of a material to occur throughout the sample it is necessary for the plastic strain to propagate from one grain to next. This means that the stress concentrations that build up at the ends of the first slip band must be sufficient to start yielding in the second grain. The intensity of the stress at the tip of the slip band is dependent on the applied stress, resulting in materials with large grain sizes typically having lower yield strengths. 3
19 1.1.2 Solid Solution Strengthening The introduction of solute atoms into solid solution in a solvent-atom lattice produces an alloy which is stronger than the pure metal. There are various ways solute atoms interact with dislocations: elastic interaction, modulus interaction, stacking-fault interaction, electrical interaction, short-range order interaction, long-range order interaction. The resistance to dislocation motion that constitutes solid-solution strengthening can come from one or more of these factors. In solid solutions of FCC metals the hardening is often linearly proportional to the concentration of solute atoms at low concentrations [7] Strain Hardening Strain hardening is an important industrial process that is used to harden metals by increasing the dislocation density. A high rate of strain hardening implies mutual obstruction of dislocations gliding on intersecting systems. This can come through the interaction of stress fields of the dislocation, the interactions which produce sessile locks, and through the interpenetration of one slip system by another which results in the formation of dislocation jogs. The strength contribution of dislocation structures to the macroscopic flow stress is often represented by an Orowan type equation [8]: σ = σ (1.3) 1/ αgbρ where, σ is the macroscopic flow stress, σ 0 is the friction stress, α is a constant, G is the shear modulus, b is the Burger s vector and ρ is the dislocation density. Figure 1.2 is the schematic showing the influence of cold working on yield stress and ductility of material. It can be seen that with increase in amount of cold work yield stress increases but ductility decreases. 4
![Figure 1.2: Schematic showing the influence of cold work on strength and ductility of material [9]. 1.1.4 Precipitation Hardening Precipitation hardening or age hardening is produced by solution treating, quenching, and aging an alloy.](/docs-images/76/73360357/images/20-0.jpg "The second phase precipitate remains in solid solution at elevated temperature but precipitates upon aging at a lower temperature.")
20 Figure 1.2: Schematic showing the influence of cold work on strength and ductility of material [9] Precipitation Hardening Precipitation hardening or age hardening is produced by solution treating, quenching, and aging an alloy. The second phase precipitate remains in solid solution at elevated temperature but precipitates upon aging at a lower temperature. There are several ways in which fine particles can act as barrier to dislocations. They can act as impenetrable particles through which the dislocations can move only by sharp changes in curvature of the dislocation line. Alternatively they can act as coherent particles through which a dislocation can pass, but only at stress levels greater than those required to move dislocations through the matrix phase. The degree of strengthening from second phase particles depends on the morphology of particles in the matrix such as size distribution, inter-particle spacing, size and shape of particles and volume fraction. 5
21 1.2 Crystalline Defects Crystalline materials exhibit long-range order in the position and stacking sequence of atoms. Crystalline structures consist of a three dimensional arrangement of lattice points in space, where each lattice point has identical surroundings. Associated with each lattice points is a single atom or group of atoms, depending on the solid under consideration. When a crystal deviates from perfect periodicity with regard to its atomic configuration, it is termed as a defect or imperfection. These defects can be classified into the following groups: Point Defects (Zero Dimensional): Localized disruptions of the lattice only one or several atoms are called point defects. This includes impurity atoms (substitutional or interstitial) or the absence of an atom (vacancy). Line Defects (One Dimensional): Line defects are defective regions of the crystal that extend through the crystal along a line. The most important line defect is the dislocation. The dislocation is the defect responsible for the phenomena of slip, by which most metals plastically deform. Planar Defects (Two Dimensional): Planar defects occupy higher spatial volume than point or line defects. These include grain boundaries, interfaces, stacking faults and twin boundaries. Bulk Defects (Three Dimensional): Such volume defects are formed by concentration of point or line defects and occupy a spatial volume in 3 dimensions. These include precipitates, voids and cracks and usually occur during processing of materials. 6
22 1.2.1 Dislocations The concept of a dislocation was first introduced independently by Orowan [10], Polanyi [11] and Taylor [12] to explain the discrepancy between the observed and theoretical shear strength of metals. They showed that the motion of dislocations through a crystal lattice requires less stress than the theoretical stress and the movement of the dislocations produces a step at the free surface. Figure 1.3 is the schematic of the movement of a dislocation through a lattice such that one atomic bond is broken at a time [13]. Figure 1.3: Schematic showing progressive movement of a dislocation through a 2-D crystal lattice [13]. A dislocation is characterized by its Burger s vector (b), which is a scalar magnitude. The Burger s vector is typically equal to the interatomic vector in the glide plane, or at least a small lattice vector. Dislocations of this type are called perfect dislocations. In certain cases, it is also possible to have a Burger s vector equal to a fraction of a repeat lattice vector. The dislocation is then an imperfect or partial dislocation, and the original lattice structure is not preserved when 7
23 the dislocation line is crossed. For example in FCC metals, perfect dislocations of type a/2<110> can decompose into two partial dislocations to minimize the energy e.g. _ a _ a a The two basic types of dislocations are edge dislocations and 6 6 screw dislocations. Figure 1.4 shows a visual representation of an edge dislocation (left) and a screw dislocation (right). The shear displacements associated with plastic deformation occur primarily by the movement of dislocations. Planes on which dislocations move is called slip plane and the direction is called the slip direction. The slip planes and direction are those of highest atomic density. The only prerequisite for a plane to be a slip plane is that it contains both the Burger s vector and line direction. For edge dislocations, since the Burger s vector is normal to the line vector, there exists a unique slip plane in which they are able to move. For screw dislocations however, there exist multiple feasible slip planes, as the Burger s vector and line direction are parallel to each other. Plastic deformation in crystalline solids is inhomogeneous and usually occurs by sliding of blocks of the crystal over one another along definite slip planes and in definite slip directions. Every dislocation then produces slip in a specific direction (parallel to the Burger s vector) and moves on a specific slip plane. Each crystal structure thus has a definite set of slip planes and directions (also known as slip systems). Slip planes in FCC metals are {111} and slip directions are <110> (shown in Figure 1.5 and Table 1.1) [13]. Macroscopic slip is observed on a given system when the resolved shear stress reaches the critical value for the onset of dislocation motion, i.e., a stress high enough to overcome the lattice resistance to dislocation motion. The critical resolved shear stress is the value of the resolved shear stress that occurs at the onset of 8
24 Figure 1.4: Schematics showing (a) edge dislocation and (b) screw dislocation in simple cubic lattice [13]. dislocation motion and is the same for all similar slip systems in a crystal. A single crystal subjected to a shear stress can deform extensively with slip on only a single slip system. However in polycrystalline materials, since all grains are oriented differently, each will respond differently when subjected to a shear stress. And if each grain deforms differently, then the region around grain boundaries is subject to complex shape changes if we demand stress and strain continuity to be maintained between grains. According to Taylor, to achieve arbitrary shape change it is necessary to have five independent slip systems operative [14]. 1.3 Observations of Dislocations Various techniques have been used over the years to observe dislocations. Almost all experimental techniques for detecting dislocations utilize the strain field around the dislocation to increase its effective size. These techniques can be divided into two categories: those using a chemical reaction with the dislocation and those utilizing a physical change at the dislocation 9
25 Table 1.1: Slip systems for FCC Crystals [13]. Slip System Slip Plane Slip Direction A2 - Critical system (1 1 1) [1-1 0] A6 - Critical system (1 1 1) [0 1-1] A3 - Critical system (1 1 1) [1 0-1] D1 - Cross-slip system (-1 1 1) [1 1 0] D6 - Cross-slip system (-1 1 1) [0 1-1] D4 - Cross-slip system (-1 1 1) [1 0 1] B2 - Coplanar system (1 1-1) [1-1 0] B5 - Coplanar system (1 1-1) [0 1 1] B4 - Primary system (1 1-1) [1 0 1] C1 - Conjugate system (1-1 1) [1 1 0] C5 - Conjugate system (1-1 1) [0 1 1] C3 - Conjugate system (1-1 1) [1 0-1] site. The chemical methods include etch pit techniques and precipitation techniques. Methods based on the physical structure of the dislocation site include electron microscopy and X-ray diffraction. Etch pit techniques employ the use of a chemical etchant, which forms a pit around the dislocation sites because of the strain field surrounding the dislocation. Advantages of this technique include its relative ease of use and that it can be applied to bulk samples. However this technique cannot be employed for samples with high dislocation densities and care should be 10
26 taken that the pits are formed only at the dislocation sites. Another similar method is to form a visible precipitates along the dislocation line. This technique is called dislocation decoration and involves adding a small amount of impurity to form a precipitate after heat treatment. Even though it is possible to see the internal structure of dislocation lines, this technique is not used extensively with metals but is used extensively in semi-conductors. X-ray microscopy can also be used for detecting dislocations but is not widely used because of low resolution of the techniques, about 10 5 dislocations/cm 2. Transmission electron microscopy (TEM) is the most powerful technique for studying dislocations in solids. Thin samples of ~1000Å are electro-polished to make it electron transparent. Individual dislocations can be observed because the intensity of the diffracted beam is altered by the strain field of the dislocation. However, since the information is obtained only from the small volume of sample, this technique does not provide statistically reliable information. Also it is possible to alter the defect structure during sample preparation of the thin films. The technique used in the current investigation provides indirect information about dislocation structure is electron back scatter diffraction (EBSD) and will be discussed further in Chapter 2 [15]. 1.4 Outline of the Current Research Constitutive models are typically phenomenological in nature, with stress-strain behavior measured and fitted to state variables that have little to do with the actual microstructure. By more fully characterizing the microstructure this data can be included and explicitly defined in models. The ultimate goal of this project was to provide experimental data in support of a continuing effort to model excess dislocation density evolution on aluminum alloys. The current 11
27 research is focused on development of tools for quantitative understanding of microstructureproperty relationship and improved characterization technique that can include sufficient information for models. Following are the outline and general objectives of the current research: Chapter 2 introduces strategies to define and image local orientation gradients in deformed crystalline materials in 2-D and 3-D. Information about the local lattice curvature obtained from EBSD data is used to generate 2-D and 3-D maps showing spatial distribution of scalar parameters that represent local orientation gradient. Chapter 3 covers the orientation dependence of dislocation structure evolution during small and large strains at room temperature deformation of AA A new strategy for plotting the excess dislocation density in orientation space is introduced. Chapter 4 covers the orientation dependence of dislocation structure evolution during small and large strains at room temperature deformation of AA The strategy for plotting the excess dislocation density in orientation space is expanded and compared directly to the Taylor factor, also being plotted in orientation space. Chapter 5 summarizes conclusions of the current research. Chapter 6 contains suggestions for future work. 12
28 1.5 References [1]. (2007) [2]. T.J. Turner, M.P. Miller, N.R. Barton, Mech. Mat. 34 (2002) [3]. O. Engler, M.-Y. Huh, C.N. Tome, Metal. Mater. Trans. 31A 9 (2000) [4]. G. Winther, Mat. Sci. Eng. A (2001) [5]. E.O. Hall, Proc. Phys. Soc. London 643 (1951) 747. [6]. N.J. Petch, J. Iron. Steel Inst. London 173 (1953) 25. [7]. G.E. Dieter, Mechanical Metallurgy (McGraw-Hill 1986, 3 rd Edition). [8]. H. Mecking, U.F. Kocks, Acta Metall. 29 (1981) [9]. W.D. Callister Jr., Materials Science and Engineering: An Introduction (John Wiley 1999, 5th Edition). [10]. E.Z. Orowan, Z. Phys. 89 (1934) 605. [11]. M.Z. Polanyi, Z. Phys., 89 (1934) 660. [12]. G.I. Taylor, Proc. R. Soc. London 145A (1934) 362. [13]. D. Hull, D.J. Bacon, Introduction to Dislocations, (Elsevier, London, UK, 2001). [14]. G.I. Taylor, J. Inst. Met. 62 (1938) 307. [15]. B.L. Adams, S.I. Wright, K. Kunze, Met. Trans. 24A (1993)
 is an SEM-based technique used to obtain local surface information on the crystallographic character of the bulk material.")
29 CHAPTER 2 EXCESS DISLOCATION DENSITY CALCULATIONS FROM LATTICE CURVATURE: A COMPARISON OF 2-D AND 3-D DENSITIES 2.1 Introduction: Electron-backscatter diffraction (EBSD) is an SEM-based technique used to obtain local surface information on the crystallographic character of the bulk material. EBSD is a convergent beam technique whereby an electron diffraction pattern is formed by coherently backscattered electrons diffracted by planes matching the Bragg condition, λ = 2d sinθ (2.1) where λ is the wavelength of the electron beam, d is the interplanar spacing for a given set of lattice planes and θ is the Bragg angle shown in Figure 2.1. Figure 2.1: Diffraction from lattice planes, indicating the geometry that leads to the derivation of Bragg s law. 14
30 The collection of an electron backscatter diffraction pattern (EBSP) is carried out by tilting a polished sample to an angle of 70 inside the SEM chamber. When the electrons interact with the sample material, they are inelastically scattered in all directions beneath the surface of the material. As a result there are some electrons that satisfy the Bragg angle for every plane in the crystal. These electrons are elastically scattered as they exit the specimen surface, to form the contrast observed in EBSD patterns. Because the electrons travel from the source in all directions, for each set planes for which the Bragg condition is satisfied, the diffracted beams lie on the surface of a cone whose axis is normal to the diffracted plane. Those cones intersect with a phosphor screen placed in front of the specimen and give rise to the pattern shown in Figure 2.2. Each pair of cones, whose intersection with the phosphor screen produces nearly parallel sets of lines, is termed a Kikuchi band. An image analysis technique, called a Hough transform, is used to detect Kikuchi bands. The Hough transform is given by ρ = x cosθ + y sinθ, which integrates intensity along all possible straight lines, reducing all lines in real space to a single point defined by (ρ,θ) in Hough space. Usually automated indexing of EBSD patterns is done using sophisticated software algorithms. The whole process from start to finish can take less than seconds. One major advantage of the EBSD technique is that measurements can be performed on a large sample area and thus statistically reliable orientation information can be obtained. Resolution of the technique is dependent upon the SEM type and atomic number of the metal. In modern FEG-SEM microscopes an angular resolution is about 0.5 o and spatial resolution is 20 nm is possible. 15
![Figure 2.2: Schematic showing the formation of Kikuchi pattern using EBSD in SEM [1]](/docs-images/76/73360357/images/31-0.jpg ". 2.1.")
31 Figure 2.2: Schematic showing the formation of Kikuchi pattern using EBSD in SEM [1] Excess Dislocation Density: During plastic deformation of polycrystalline materials, individual grains do not rotate as a unit but are sometimes subdivided into crystallites rotating independently of one another to accommodate the imposed strain. The reason for grain fragmentation is that the number and selection of simultaneously acting slip systems differs between neighboring volume elements within a grain. This leads to differences in lattice rotations between neighboring elements within a grain when the material is strained. Depending upon the crystal lattice orientation of the grain and its interaction with near neighbors, grains could develop a well defined cell-block structure of similar lattice orientation but rotating at differing rates and sometimes in differing directions. In some instances the lattice rotation rate within a grain changes in a continuous fashion, thus developing long range orientation gradients. Irrespective of the type of grain subdivision, excess dislocations accommodate small lattice rotations. The concept of excess dislocations was first introduced by Nye [2] and further developed by Ashby [3]. During deformation it can be seen that since individual grains do not deform independently of one another, excess dislocations are produced at the grain boundaries to maintain lattice continuity. Nye's tensor, α, is a ij 16
32 representation of a dislocation with Burger s vector i and line vector j. In Nye's original formulation of the dislocation tensor, dislocation density was described as a number density of lines piercing a plane. The tensor was defined in the following manner: α = nb t (2.2) ij i j where n was the number density of dislocation lines with Burger s vector, b, crossing a unit area normal to their unit tangent line vector, t. The discretized Burger s vector, b, and tangent line vectors, t, form n-pairs of geometric dislocation properties. We can extend Equation 2.2 suggested by Nye, to relate the dislocation density tensor, α, to the dislocations present in the neighborhood for any crystal structure with the relation, K i= 1 i i ( b z ) i α = ρ (2.3) where, the dislocation dyadic represents a geometrical definition of dislocation i having Burger s vector b i and slip plane normal direction z i. The sum is over all the dislocations present and ρ i is the scalar dislocation density of dislocation i. Considering continuously-distributed dislocations, Nye's tensor quantifies a special set of dislocations whose geometric properties are not canceled by other dislocations in the crystal. Any dislocation structure that makes no contribution to the dislocation density tensor, such as a dislocation dipole, is termed statistically stored dislocations. Statistically stored dislocations are formed by statistical mutual trapping of dislocations such as dislocation dipoles. A more detailed description of excess and statistically stored dislocations is given by Arsenlis and Parks [4]. Assuming a minimal effect from elastic strain gradients, any crystallite containing non-zero dislocation density tensor components necessarily contains lattice curvature that can be quantified by spatially specific orientation measurements. Such measurements are inherent to automated EBSD scans of crystalline materials. Thus we can relate 17
33 the difference in orientation (or misorientation) between two neighboring data points to the Nye dislocation density tensor by the equation: α (2.4) ij = e ikl g jl, k Since the dislocation density tensor has 9 components it is possible, using a linear simplex method, to determine a set of densities of 9 dislocation types which minimizes the total dislocation content. One disadvantage of using this technique is that it does not take into account all the types of dislocations that could contribute to lattice curvature. This limitation could be overcome by using a normal equation lower bound method (as shown by El-Dasher et al. [5]) where Equation 2.3 for FCC materials could be reduced to: α = A ρ (2.5) l lk k where, k = 1, 18 and l = 1, 9 and matrix A represents a component of the dislocation dyadic. We can apply L 2 minimization method to Equation 2.5 and compute the densities of all 18 dislocations using the following equation [6]: ρ ED = T 1 ( AA ) α T A (2.6) There exist 36 distinct dislocations that can be used to account for slip in face centered cubic crystals, this may be reduced to 18 geometrically distinct dislocations (+b, -b): 6 screw and 12 edge. In the current analysis the assumption that pure edge and pure screw dislocations are only present and the code has been developed to determine the densities of 18 total dislocation types (12 pure edge and 6 pure screw dislocations). Aluminum alloys possess cubic crystal symmetry with any given orientation g having 24 geometrically equivalent orientations. Thus to obtain consistent orientation measurements all measured crystal orientations are reduced to 18
34 symmetrically equivalent orientations such that the point to point misorientation angle is minimized. Historically the orientation measurements were done on a two dimensional plane of material, resulting in no information about the orientation gradient in the third dimension (zdirection). Thus it was assumed that the orientation gradient in the third dimension was zero, shown in Equation 2.7. g13 y g13 x g12 g x y 11 g 23 y g 23 x g 22 g 21 x y g 33 y g 33 (2.7) x g g x y An accurate determination of dislocation density tensor α requires the information about the orientation gradient in all the three dimensions shown in Equation 2.8 and shown graphically in Figure 2.3. g y g z g x g z g x g y g 23 y g z g x g z g x g y g 33 y g 31 z g 32 x g 32 z g 33 (2.8) x g 31 y The updated code (Appendix A) has been expanded to include both the 2-D and 3-D dislocation density tensor calculation. In addition, to determine an accurate estimate of excess dislocation density when analyzing polycrystalline materials, it is important to ignore the high angle misorientations (i.e. grain boundaries). The current code, shown in Appendix A, accomplishes this by assigning points with >10 misorientation an excess dislocation density zero. For data obtained on a single plane, the assumption is made that there is no curvature in the direction normal to the section plane, and the measurement becomes a lower bound of excess dislocation 19
35 content to accommodate the observed curvature in the lattice. The inherent uncertainty in orientation determination using automated EBSD techniques is on the order of 0.5 degrees. This measurement noise can result in artificially large measured dislocation densities for small distances between neighboring measurement points, since the dislocation density is obtained directly from the curvature tensor equation 2.9, = θ i κ ij (2.9) x j where the denominator is generally the step size of the EBSD scan. To avoid such difficulty, the data must either be filtered through a smoothing algorithm, or the step size should be selected so that the proper measurement is obtained. The purpose of this chapter is to expand upon the analysis of the local orientation gradient in deformed metals from 2-D planar datasets to 3-D volumetric datasets to determine the density of excess dislocations from lattice curvature measurements. In addition, a determination, in the absence of data smoothing, of what step size should be used to obtain a reasonable estimate of excess dislocation density. 20
36 Figure 2.3: Graphical representation of calculation of excess dislocation density. The 2-D calculation assumes lattice curvature in 3 rd dimension is zero and only accounts for the curvature to the right and below the current. The 3-D calculation takes into account all points surrounding the current point. 2.2 Experimental Procedures: One sample of polycrystalline AA 7050 T7451 was deformed and characterized using EBSD. The sample was taken from the quarter plane (t/4 section) of the material and machined to final dimensions of 10 x 20 x 7.5 mm. No further heat treatment was conducted, leaving the material in the as received condition. The sample was deformed at room temperature using channel die compression to a 5% height reduction at a strain rate of ~ 5.5x10⁻³ s -1 to simulate cold rolling of aluminum shown if Figure
37 This die imposes a nominally plane strain deformation gradient on the metal similar to that experienced by the aluminum passing through a rolling mill. To avoid problems associated with frictional conditions on the surfaces, the analysis surface is a pseudo-internal interface wherein the specimen is split in two and the mating surfaces are prepared by a fine metallographic polish before deformation [7]. Four serial sections were produced by Hewlett-Packard in Corvallis, Oregon. A second sample dataset was provided by Alcoa Technical Center which consisted of 29 serial section slices of an AA 7075 T651 fatigue specimen. Characterization of the channel die deformed sample was done using a FEI Strata DB 235 with a Schottkey source field-emission gun and Magnum ion column. The data analysis was Figure 2.4: Channel die deformation setup showing pseudo-internal surface (polished surface). performed with in house software that had been modified to include the calculation of the dislocation density tensor and the ability to perform this calculation across multiple datasets simultaneously. The 4 dataset serial sections from the channel die deformed AA 7050 (sample 1) 22
38 contained ~244,000 points and a volume of 2500 µm 3, the step sized used for these datasets was 0.25 µm with each focused ion beam (FIB) milling process removing 0.25 µm of material. While the 29 dataset serial sections from the fatigue AA 7075 specimen (sample 2) contained 1.45 million points and a volume of µm 3, the step size used for these datasets was 0.20 µm with each FIB milling process removing 0.50 µm of material. A second sample of AA 7050 T7451 (sample 3) was taken from the quarter plane (t/4 section) of the material and machined to final dimensions of 10 x 20 x 7.5 mm and was left in the as received condition. The sample was deformed at room temperature using channel die compression to a 10% height reduction at a strain rate of ~ 5.5x10⁻³ s -1 to simulate cold rolling of aluminum. The same 0.40 mm 2 area was scanned using a Schottkey source field-emission scanning electron microscope to collect EBSD patterns at step sizes raging from 0.1 µm to 40 µm. In addition, a single crystal copper specimen with the <2 9 20> direction aligned with the deformation axis, was compressed 10%. EBSD scans were performed using step sizes ranging from 0.1 µm to 100 µm on a polished surface taken from the interior of the specimen. All scans were made near the central part of the prepared surface so as to avoid any edge or surface effects with the compression direction vertical on the images. Data analysis was performed using the aforementioned in house software to calculate the excess dislocation content and determine the effect of step size on the excess dislocation density. The software was set with the following parameters: grain tolerance angle 2 o, minimum grain size 5 steps. 23
39 2.3 Results: Sample 1 and sample 3 arrived in the form of 100 mm thick hot rolled plate. The texture of the AA 7050 samples contains a combination of cube texture and an fcc rolling texture, showing a weak β fiber as show in the orientation distribution function (ODF) in Figure 2.5. Scatter occurs as the β fiber approaches the rotated cube orientation {001}<110> along with the rotated cube orientation with no {111}<uvw> component being observed in ϕ 2 = 45 [8]. In addition, there is a strong cube orientation component present {001}<100> and brass component{110}<112> as shown in ϕ 2 = 0. Figure 2.6 shows the 2 nd and 3 rd serial section of sample 1. Figure 2.7 shows the 2-D excess dislocation density maps generated from the same data represented in the orientation images shown in Figure 2.6. Figure 2.8 shows the 3-D Figure 2.5: ODF of AA 7050 T7 showing a cube texture along with a strong orientation at {110}<221>. 24


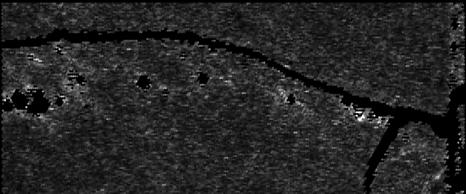
40 Figure 2.6: Serial section 2 (left) and 3 (right) for AA 7050 T7541 (Sample 1) deformed in channel die compression to a 5% height reduction at a strain rate of ~ 5.5x10⁻³ s -1. The 3-D average excess dislocation density was 1786x10 12 m -2 and the 2-D density was 946x10 12 m -2. excess dislocation density maps generated from the same data represented in the orientation images shown in Figure 2.6 in a planar format. White areas are regions of high excess dislocation density while black regions are grain boundaries or data filtered out by the software. The gray scale indicates black for regions of excess dislocation density less than m -2 to white for densities of m -2 on a linear scale. Table 2.1 shows all pertinent data calculated for the 2-D and 3-D excess dislocation density. The first and fourth slice of the 3-D dataset are ignored due to there only being one other dataset present for the calculation, resulting in an artificially low density. 25

 and 3")


41 Figure 2.7: 2-D excess dislocation density map for serial section 2 (left) and 3 (right) for sample 1. The average 2-D excess dislocation density was 958x10 12 m -2 and 942x10 12 m -2 respectively. Figure 2.8: 3-D excess dislocation density map for serial section 2 (left) and 3 (right) for sample 1. The average 3-D excess dislocation density was 1851x10 12 m -2 and 1722 x10 12 m -2 respectively. 26
42 Table 2.1: Excess dislocation density data for Figure 2.5 and 2.6. Table 2.1 AA 7050 Channel Die Sample Serial Section 2-D EDD* (10 12 m -2 ) 3-D EDD* (10 12 m -2 ) Numerical Average * - Excess dislocation density Sample 2 is shown in a 3-D graphical representation in Figure 2.9. Figure 2.10 shows the 3-D graphical representation of the excess dislocation density calculated from the data shown in Figure 2.9. Table 2.2 shows the data for the 29 serial sections in 2- D and 3-D with Figure 2.11 showing that data presented in Table 2.2. White areas are regions of high excess dislocation density while the voids are grain boundaries or data filtered out by the software. The gray scale indicates black for regions of excess dislocation density less than m -2 to white for densities of m -2 on a linear scale. 27


43 Figure 2.9: 3-D OIM dataset of AA 7075 T651, 29 serial sections comprise the 14 µm thick dataset. 28


44 Figure 2.10: Excess dislocation density maps for the 3-D OIM dataset of AA 7075 T651, 29 serial sections comprise the 14 µm thick dataset with and average 3-D excess dislocation density of 3063 x10 12 m -2 and an average 2-D density of 1924 x10 12 m -2. Figure 2.11: Excess dislocation density plotted with slice depth for comparison of 2-D and 3-D. 29
45 Table 2.2: Excess dislocation density data for Figure 2.9 and Table 2.2 AA 7075 Fatigue Sample Serial Section Scan Depth (µm) 2-D EDD* (10 12 m -2 ) 3-D EDD* (10 12 m -2 ) Numerical Average * - Excess dislocation density 30


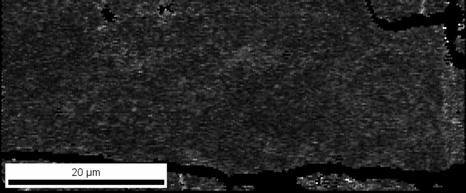
46 Four chosen scans of sample 3 and the Cu single crystal completed at various step sizes are shown in Figure 2.12 and Figure 2.13 to illustrate decreasing grain definition as step size increases. This has an effect upon the excess dislocation density, as step size increases, excess dislocation density decreases, shown in Figure 2.14 with the corresponding data in Table 2.3 for sample 3 and the copper single crystal. Staker and Holt used TEM imaging techniques to measure the dislocation density in a Cu specimen deformed 10% in tension to be 118x10 8 cm -2 [9]. Figure 2.12: Orientation maps of AA 7050 T7541 deformed in channel die compression to a 10% height reduction at a strain rate of ~ 5.5x10⁻³ s -1 showing the declining grain definition as step size increases. Maps obtained using step sizes of 2, 10, 20 and 40 µm with an excess dislocation density of 174x10 12 m -2, 32.59x10 12 m -2, 20x10 12 m -2, and 10x10 12 m -2, from left to right. 31


47 Figure 2.13: Orientation maps showing a variation of the lattice orientation indicating the dislocation structure. Maps obtained using can step sizes of 0.2, 5, and 20 with an excess dislocation density of 1409x10 12 m -2, x10 12 m -2, and 33x10 12 m -2, from left to right. Similar results were obtained by Heuser using neutron scattering techniques who measured 1.9x10 10 cm -2 at 16% compression of Cu single crystals [10]. A comparison of Figure 2.11 with measured values of the dislocation density as quoted from the literature shows order of magnitude agreement with the EBSD measured densities from step sizes of µm. 32
48 Figure 2.14: Average excess dislocation density as a function of EBSD step size. The dashed line indicates the expected slope if noise is the only contribution to the measurement. 33
49 Table 2.3: Excess dislocation density for AA 7050 sample and Cu single crystal dependence of step size (µm). Table 2.3 EDD Dependence on Step Size Step Size AA 7050 EDD* (10 12 m -2 ) Copper EDD* (10 12 m -2 ) * - Excess dislocation density 34
50 2.4 Discussion: For sample 1 the first and fourth serial sections have no excess dislocation density because there is only one neighboring dataset, this results in a value of zero for all orientations. The second and third serial sections show approximately twice the density in 3-D when compared to the 2-D, ~1786x10 12 /m -2 and ~950x10 12 /m -2 respectively. The current 3-D code calculates the density by dividing the points into two groups, 1 st group right, down, and below points, 2 nd group left, up, and above points, and the misorientation is averaged between 1 st group and 2 nd group, shown in Equation y g z + 1 g 2 y g g z (2.10) Another point that should be noted when comparing the 3-D and 2-D excess dislocation maps is the grain boundaries for the 3-D maps are much larger. The misorientation filters (>10 ) were expanded from 2-D to 3-D, resulting in points from above and below the current point to be taken into account examined prior to the calculation. The consequence is more data points are assigned a value of zero. Sample 2 s results agreed with that of sample 1, showing an average 3-D excess dislocation density of 3063x10 12 /m -2 and average 2-D density of 1924x10 12 /m -2. This dataset also proved the validity of the software on datasets with 20+ serial sections and the ability to use existing software to display the data in a graphical form. In the absence of data smoothing, it seems reasonable to adopt the dislocation cell diameter as the step size of the EBSD scan in order to measure excess dislocation content. This minimizes the contribution of the orientation measurement uncertainty and offers the best chance to obtain reasonable data. A priori knowledge of the character of the dislocation distribution is 35
51 required in that a reasonable step size can be estimated from the expected dislocation cell size to obtain a proper measurement of excess dislocation content in deformed crystals. In addition, it was observed in the 3-D datasets that the spacing between the serial sections influences the excess dislocation density in the same manor as varying the step size in 2-D datasets. One would conclude that understanding the bulk character of the material would be crucial to determining an appropriate slice depth for serial sectioning. Assuming that statistically the microstructure is the same in all three dimensions it would be reasonable to apply the same slice depth as step size, however, if a focused ion beam is employed, this would be unreasonable for samples with large dislocation cell diameters but could be accomplished by mechanical polishing. 2.5 Conclusions: Two samples of Al 7050 were deformed in channel die compression to a 5% height reduction. One sample had four serial sections of EBSD data collected through OIM and FIB milling. An average 3-D excess dislocation density of 1786x10 12 m -2 was calculated while the average 2-D density was 946x10 12 m -2. An AA 7075 sample dataset collected from tensile fatigue specimen with 29 serial sections provided by Alcoa Technical Center showed an average 3-D excess dislocation density of 3063x10 12 m -2 and an average 2-D density of 1924x10 12 m -2. The second AA 7050 sample and a single crystal copper dataset were used to show the influence of step size of the excess dislocation density. It was observed as the step size was decreased (i.e. 1 µm 0.2 µm) the excess dislocation density increased following a power law curve. Also for 3-D calculations the spacing between serial sections has the same effect as increasing or decreasing the step size. The same trends were observed in polycrystalline and single crystal datasets. 36
52 2.6 References: [1]. S.I. Wright, Electron Backscatter Diffraction in Materials Science, ed. A.J. Schwartz, M. Kumar, and B.L. Adams (Kluwer Academic/Plenum Publishers, New York 2000). [2]. J.F. Nye, Acta Metall. 1, (1953) 153. [3]. M.F. Ashby, Phil. Mag. 21, (1970) 399. [4]. A. Arsenlis, D.M. Parks, Acta Mat. 47, (1999) [5]. B.S. El-Dasher, B.L. Adams, A.D. Rollett, Scripta Mat. 48, (2003) 141. [6]. G.B. Dantzig, Linear Programming and Extensions (Princeton University Press) [7]. S. Panchanadeeswaran, R.D. Doherty, R. Becker, Acta Mater. 44 (1996) [8]. O. Engler, M.-Y Huh, C.N. Tome, Metall. Mater. Trans. A, 31A (2000) [9]. M.R. Staker, D.L. Holt, Acta Metall. 20 (1972) 569. [10]. B.J. Heuser, Appl. Cryst. 27 (1994)
53 CHAPTER 3 ORIENTATION DEPENDENCE OF DISLOCATION STRUCTURE EVOLUTION DURING COLD ROLLING OF ALUMINUM 3.1 Abstract: A well-organized dislocation structure forms in many polycrystalline metals during plastic deformation. This structure is described qualitatively with no explanation of the quantitative characterization. In this work, the evolution of dislocation structure in commercial purity aluminum is described by means of the excess dislocation density and by quantitative characterization of the cell structure as seen on a plane surface. The measurements were performed on a pseudo-internal surface of a split specimen deformed by channel die deformation. The results show a clear dependence of cell structure formation on orientation of the crystallite with respect to the imposed deformation gradient with the largest excess dislocation density occurring in grains of {011}[122] orientation for plane strain deformation. Neighboring grain and non-local effects are shown to be of importance in the type of dislocation structures that evolve. 3.2 Introduction: Evolution of dislocation structures and dislocation-dislocation interactions control the deformation response of polycrystalline materials. As deformation increases in a material, grains 38
54 begin to break into volume elements that decrease in size with increasing strain. These volume elements are characterized by two different types of boundaries, incidental dislocation boundaries and geometrically necessary boundaries. Incidental dislocation boundaries (IDB) form by the random trappings of dislocations and geometrically necessary boundaries (GNB) form between regions with one or more different operating slip systems to accommodate the accompanying difference in lattice rotation [1]. These boundaries contain both statistically stored dislocations (redundant, +b -b), which do not contribute significantly to a net lattice rotation, and excess dislocations (non-redundant, often termed geometrically necessary dislocations) that contribute to the net lattice rotation [2-4]. It has been observed by various authors that the character of dislocation structures formed is a function of the lattice orientation with respect to the imposed deformation gradient [5-7]. The presence of these deformation gradients in a material give rise to a lattice rotation θ and a net Burger s vector resulting in a rotation. The purpose of the present work is to obtain experimental data of dislocation structure evolution using electron back-scatter diffraction (EBSD), in support of the development of a three dimensional crystal plasticity model to describe the deformation behavior of aluminum alloys. Basic to this model is the concept that the material behavior is controlled by the motion and interaction of excess dislocations. The evolution of dislocation density depends on the divergence of dislocation fluxes associated with the inhomogeneous nature of plasticity in crystals [8-9]. Dislocation structure evolution during cold deformation of fcc polycrystals has been extensively investigated over the past couple of decades with primary emphasis on a qualitative description of the evolving structures and their relation to mechanical properties [10-15]. In the present experiments a channel die is used to simulate cold rolling of aluminum. This die imposes a nominally plane strain deformation gradient on the metal similar to that 39
55 experienced by the aluminum passing through a rolling mill. To avoid problems associated with frictional conditions on the surfaces, the surface scanned was a pseudo-internal interface wherein the specimen is split in two and the mating surfaces are prepared by a fine metallographic polish before deformation [16]. This surface is suitable for characterization by electron backscatter diffraction at various steps through the deformation process because it is protected from the majority of the shear deformation characteristic of the specimen surfaces in channel die deformation. 3.3 Experimental Details: Commercial purity polycrystalline aluminum (Al 1050) was obtained as industrially hotrolled thick plate (~50 mm thick). Four samples were prepared with dimensions of 30 x 35 x 10 mm 3 and cross rolled at room temperature to a reduction of 40%. The samples were then machined to final dimensions of 11 x 22 x 7.5 mm 3. They were annealed for 1.5 hours at 450 C to obtain a relatively dislocation free recrystallized structure. Two of the samples were deformed at room temperature by channel die compression in true strain increments of ~0.05 to a 30% height reduction at a strain rate of ~5.5x10⁻³ s -1. The other two samples were deformed in true stain increments of ~0.005 to a 5% height reduction at a strain rate of ~ 5.5x10⁻³ s -1. This form of plain strain deformation was used to impose the idealized deformation seen in rolling. TEFLON film was placed between the two samples and the samples and the die walls to prevent galling. EBSD analysis was performed using a Schottkey source field-emission scanning electron microscope. Prior to channel die deformation an 80 mm 2 area was scanned using a 25 µm step size to collect the initial texture. All subsequent scans were of the same 0.85 mm 2 area with a 2 µm step size. The scans were centered in the middle of the sample to exclude edge effects and any anomalous effects created by the punch or the die. The smaller step size was used in this area 40
56 to obtain local information about point to point misorientation within grains allowing for calculation of excess dislocation density, dislocation cell size, and local orientation distribution of dislocations. Black regions in orientation images are regions with low confidence index (CI<0.2) data. The black regions in excess dislocation density images are either bad data or regions of low dislocation density. Misorientations of 5 or greater are ignored, so data points along grain boundaries generally have a low apparent dislocation density. The data analysis was performed with software similar to TSL OIM Analysis 5.1, but that had been modified to include calculation of the dislocation density tensor. The software was set with the following parameters: grain tolerance angle 2 o, minimum grain size 5 steps. All averages are number averages which translate directly to averages of the grain area owing to the principle of DeLesse and the measurement strategy where data points are taken over a regular hexagonal array. Taylor factors for the given orientations were calculated using the family of active slip systems for FCC metals ({111}<1-10>) and the plane strain deformation gradient; σ xx = 1, σ zz = -1, σ yy = σ xy = σ xz = σ yz = 0. The combined expected error of the hardware and software used in these calculations was ~1.35 x 10 6 m -2. This was calculated by taking the uncertainty in the EBSD pattern measurement from point to point (0.5º), assuming that both points are actually of the same orientation. A file with this data was then generated and run through the excess dislocation density function to determine the density. A value was also calculated using the simple relation between lattice curvature and the content of parallel edge dislocations of the same sign (θ = b/d, such as for a low angle boundary) assuming the same parameters as the dataset (2 µm step size). The calculated dislocation content for this determination was 1.23 x 10 6 m -2 while the software returned a value of 1.48 x 10 6 m
57 3.4 Results The texture resulting from cross rolling and recrystallization of the Al 1050 samples was a weak cube orientation {001}<100> with some retained brass texture{110}<112> as shown in the constant ϕ 2 cross section crystallite orientation distribution function (ODF) in Figure 3.1. Figure 3.2 shows the progression of orientation images obtained from a given area of one of the samples from the undeformed state to a state of 20% height reduction, the 25% and 30% height reduction maps are not shown because the samples were repolished showing a different region. The undeformed orientation image shows a recrystallized structure with a large variation in grain size most likely a result of the processing of the sample. No lattice curvature is apparent in the undeformed material. The Taylor factor was calculated for {001}<100> orientations to be 2.4 for the given deformation state, while {011}<01-1> and {111}<01-1> grains each had a Taylor 42


58 Figure 3.1: ODF of undeformed material showing a weak cube orientation with some retained brass. factor of ~4.0. This would indicate that the {011} and {111} grains should not deform until the {001} grains had hardened sufficiently to initiate slip in the grains of higher Taylor factor. Ultimately the higher Taylor factor grains would have a higher excess dislocation density due to the increased slip necessary for unit strain in these grains. On the other hand the {001} grains should initially deform easily resulting in a higher excess dislocation density but as the samples proceed through large deformation steps the excess dislocation density should not increase as rapidly as the {011} and {111} type grains. This is because the low Taylor factor means that 43


59 these grains are soft in relation to the neighboring structure and will deform first, resulting in an increased dislocation density. As these harden due to the cold work, the grains with a higher Figure 3.2: Orientation images, from left to right, of undeformed (a), 5% (b), 10% (c), 15% (d), and 20% (e) reduction. Taylor factor will deform. Because of the increased Taylor factor these require more dislocation motion per unit strain to deform, therefore the density will increase at a more rapid rate than in these grains with a lower Taylor factor. This trend was observed experimentally when the excess dislocation density was calculated. Neighboring grains influence this behavior by constraints imposed upon deformation of softer grains by load shielding from grains of higher Taylor factor, resulting in dislocation density evolution to be less predictable for these regions. Figure 3.3 shows the excess dislocation density maps generated from the same data represented as the orientation images shown in Figure 3.2. White areas are regions of high excess 44


.")


60 dislocation density while black regions are grain boundaries or bad data filtered out by the software. The gray scale indicates black for regions of excess dislocation density less than m -2 to white for densities of m -2. Regions of highest density occur where grain to grain Figure 3.3: Excess dislocation density maps for the orientation images shown in Figure 3.2. Black areas are the lowest density (10 11 m -2 ) areas and regions of low confidence data while the lighter areas are the regions of highest excess dislocation density (10 15 m -2 ). interaction is the greatest, resulting in hard grains deforming very little while imposing greater deformation on the soft grains. As the excess dislocation density increases there is more dislocation-dislocation interaction, resulting in an increasingly well-defined grain substructure. The undeformed material is free of significant dislocation structure and the dislocation cell size was calculated to be the same as the grain size. Subsequent dislocation cell sizes decreased with each deformation step and the excess dislocation density increased as shown in Figure 3.4 and Table 3.1, which was calculated using in-house software from lattice curvature data, collected 45
61 using EBSD. With respect to specific orientations for small deformation steps, incrementally the {001} grains increase the most initially but are over-taken in excess dislocation density around a true strain of shown in Figure 3.5. This trend continues through the rest of the deformation Figure 3.4: Excess dislocation density and dislocation cell size for each deformation step. Excess dislocation density increases with increasing deformation while dislocation cell size decreases. steps with the highest density being in the higher Taylor Factor {011} and {111} grains as shown in Figure 3.6. The dislocation cell size with respect to crystal orientation does not follow a distinct trend and seems to be complicated by grain to grain interaction, while ultimately {111} grains deformed with the highest average lattice curvature, the {001} grains with an initially larger grain size than {011} grains showed a greater reduction rate in average cell size. At 15% deformation {011) density drops below that of the {111} density due to the local nature of the 46
62 data resulting in a lower number of data points for the specific deformation step. The prior deformation step and the subsequent step have significantly more data points due to grains rotating to {011} orientation to accommodate the local strain. Table 3.1: Excess dislocation density evolution data for AA 1050 in channel die deformation from undeformed state through 30% deformation for sample 1 and sample 3 by orientation. Dislocation cell size evolution from undeformed through 30% deformation. Table 3.1 Sample 1 & 3 Excess Dislocation Density Deformation EDD* (10 12 m -2 ) Cell Size (um) 001 GND (10 12 m -2 ) 011 GND (10 12 m -2 ) 111 GND (10 12 m -2 ) 0% % % Sample 3 Sample 1 1.5% % % % % % % % % % % % % * - Excess dislocation density 47
63 Figure 3.5 and 3.6: Excess dislocation density by orientation (left), initially the {001} increases at small strains more than the {011} and {111}, by a true strain of the {011} and {111} have increased to a greater density than the {001}. Excess dislocation density by orientation (right), {011} and {111} show an increase in excess dislocation density faster than the {001} grains do for true strain steps of Once the excess dislocation density has been calculated it is possible to plot dislocation density in orientation space. Figure 3.7 shows the ODF of the undeformed material taken from the initial 2 µm step size scan. This ODF appears significantly different than that shown in Figure 3.1 but is the same material in the same deformation state, it is simply a small subset of the grains from the initial ODF scan. The excess dislocation density was determined from these grains and can be plotted as a scalar value in orientation space resulting in a plot that shows the 48


64 orientations containing the highest excess dislocation density. Figure 3.8 shows the excess dislocation density plot after 20% compressive deformation. The undeformed excess dislocation Figure 3.7: ODF of undeformed material of 2 µm scan shows the texture for a local area only. plot shows a fairly evenly distributed excess dislocation density across all orientations, which is to be expected in a recrystallized material. On the other hand, the 20% deformation excess dislocation plot shows a wide variety of behaviors with the highest intensity regions at an orientation near {011}<122>. 49


65 Figure 3.8: Excess dislocation density plotted in orientation space for 20% deformed material. The {011}<122> orientation shows the strongest dislocation density for the local area. 3.5 Discussion: Evolution of excess dislocation content at a given position in the polycrystal depends upon the crystallite lattice orientation and initial local lattice curvature. However, the effects of grain to grain interactions, grain size effects, and other local and non-local material properties that are dependent upon processing could make this kind of determination far more complicated than it initially appears. It should be noted that in the data presented above, all grains having a {001} pole aligned with the axis of compression in the channel die deformation are included in the plots as {001} 50
66 grains. The same applies to {110} and {111} grains. This generalization was made because of the relatively few number of grains in the data sets used for this analysis. Granted that the Taylor factor can change significantly based on in-plane rotation of the grains. However, in the case of these orientations for plane strain deformation, the Taylor factor is generally smaller for {001} grains than for {110} or {111} grains regardless of in-plane orientation. Because of this, the results are generally applicable to grains of each pole orientation aligned with the compression axis even though the Taylor factor varies for grains included as having the same pole direction. The excess dislocation density follows an appropriate trend showing that for small deformation steps the {001} grains initiate deformation as predicted by the Taylor factor. Both the {011} and {111} grains in the large deformation steps show the highest excess dislocation content which is introduced at larger strains and agrees with excess dislocation trends. As the dislocation density increases and dislocation-dislocation interactions become more prevalent, the grains begin to break up into volume elements to accommodate the macroscopic plastic strain through the operation of multiple slip systems. This results in the decreasing diameter of these volume elements and an increasing misorientation between each element. As these subgrains become more well-defined and orientation spreading occurs during deformation, grains of similar orientation should behave in a similar manner, ignoring grain to grain interactions. This would result in specific orientations of higher excess dislocation density which maybe plotted in orientation space for a visual representation of the data. The Taylor factor for the orientation with the highest observed excess dislocation content, {011}[122], is a quite high value of 4.62 and lies near the orientation {011}[011], which has the highest Taylor factor possible (4.90) for this deformation gradient. It appears that on average, 51
67 the Taylor factor is a reasonable predictor of excess dislocation content. This is consistent with findings of other researchers who have used x-ray line broadening techniques, microhardness measurements, or TEM observations to obtain a measure of dislocation structure or stored energy in deformed polycrystals [17-20]. The excess dislocation density data plotted in orientation space for this paper was for a local region (570 x 1707 µm) of the material and is not representative of the entire material. For this type of plot to be representative of the bulk material and not a specific region, a large number of grains would need to be included (>1000 grains) [21]. Also it should be noted that to minimize noise in the excess dislocation density calculation, EBSD scan step sizes should be used that are approximately that of the subgrain or cell size diameter resulting in the misorientation between the subgrains to be calculated. 3.6 Conclusions: Two samples of Al 1050 were deformed in channel die compression to simulate idealized plain strain deformation seen in rolling. One sample was deformed in strain increments of ~ while the other sample was deformed in strain increments of ~0.05. The small strain sample initially showed a greater incremental increase in {001} type grains, while the {011} and {111} type grains finally accumulated a greater number of excess dislocations at a true strain of The large strain sample showed a continuation of this trend with {011} and {111} grains having the higher excess dislocation content. The strains from both samples that correlate to one another are within about 10% and show similar trends. The dislocation content was then plotted in orientation space to show the distribution of dislocations in order to identify the highest excess 52
68 dislocation density, which occurred at positions of highest Taylor Factor. For this data set, the highest excess dislocation density was measured in grains of {011}[122] orientation. 53
69 3.7 References: [1] D. Kuhlmann-Wilsdorf, N. Hansen, Scripta Metall. Mater. 25 (1991) [2] W. Pantleon, Acta Mater. 46 (1998) [3] W. Pantleon, Mater. Sci. Eng. A (1997) [4] W. Pantleon, Mater. Sci. Eng. A (2001) [5] D.P Field, H. Weiland, Mat. Sci. Forum (1994) [6] P. Trivedi, D.P. Field, H. Weiland, Int. J. of Plasticity 20 (2004) [7] G. Winther, X. Huang, N. Hansen, Acta Mater. 48 (2000) [8] A. Arsenlis, D.M. Parks, R. Becker, and V.V. Bulatov, J. Mech. Phys. Sol, 52 (2004) [9] E. Kroner, Appl. Mech. Rev. 15 (1962) 599. [10] B. Bay, N. Hansen, D. Kuhlmann-Wilsdorf, Mater. Sci. Eng. A113 (1989) [11] D. Kuhlmann-Wilsdorf, Mater. Sci. Eng. A113 (1989) [12] N. Hansen, Mater. Sci. Tech. 6 (1990) [13] D.A. Hughes, N. Hansen, Mater. Sci. Tech. 7 (1991) [14] B. Bay, N. Hansen, D.A. Hughes, D. Kuhlmann-Wilsdorf, Acta metal. mater. 40 (1992) [15] D.A. Hughes, N. Hansen, Metall. Trans. 24A (1993) [16] S. Panchanadeeswaran, R.D. Doherty, R. Becker, Acta Mater. 44 (1996)
70 [17] J.S. Kallend and Y.C. Huang, Proc. Seventh International Conference on Textures of Materials, Netherlands Soc. For Materials Science, 1984, pp [18] D.D. Sam and B.L. Adams, Metall. Trans. 17A (1986) [19] S.F. Castro, J. Gallego, F.J.G. Landgraf, and H.-J. Kestenbach, Mat. Sci. Eng. A, 427 (2006) [20] N. Hansen, X. Huang, W. Pantleon and G. Winther, Phil. Mag. 86 (2006) [21] H.J. Bunge, Matls. Sci. Forum (1994)
71 CHAPTER 4 ORIENTATION DEPENDENCE OF DISLOCATION STRUCTURE EVOLUTION OF AA Abstract: A well-organized dislocation structure forms in many polycrystalline metals during plastic deformation. This structure is often described qualitatively without regard to quantitative characterization. In this work, the evolution of dislocation structure in aluminum alloy T7451 is described by means of the excess dislocation density and by quantitative characterization of the cell structure as seen on a plane surface. The measurements were performed on a pseudo-internal surface of a split specimen deformed by channel die deformation. The results show a clear dependence of cell structure formation on orientation of the crystallite with respect to the imposed deformation gradient with the largest excess dislocation density occurring in grains of the {001}<110>, {112}<111>, and {112}<110> orientations for plane strain deformation. Neighboring grain, precipitates, and non-local effects are shown to be of importance in the type of dislocation structures that evolve. 4.2 Introduction: Aluminum alloy 7050-T7451 was developed in the 1970 s to provide an alloy for the thick section airframe parts that require high yield strength, high toughness, and good corrosion resistance (bulkheads, wingspars, ect.). The manufacturing process, direct chill casting, 56
72 homogenization, hot rolling, solution heat treatment, quenching, stretching, and aging, result in a gradients of all the properties of the alloy across the thickness length scale [1-2]. This mechanical and physical anisotropy manifest themselves in through thickness by gradients in the crystallographic texture and a gradient in the second phase constituent particles (Al 2 CuMg, MgZn 2, ect.). The Al 2 CuMg particles are brittle and easily crack and or debond from the aluminum matrix providing a site for a catastrophic failure to begin [3-4]. These particles also provide sites for, upon recrystallization, grains to nucleate forming a gradient in the grain size through the thickness of the plate. Recrystallized grains are typically much larger with the majority occurring in the quarter plane of the plate (T/4). Nanoscale precipitates harden the alloy system, but do not contribute to the material strengthening anisotropy because the matrix and precipitates share many of the same habit planes [5]. But due to constituent concentration gradients there can be variations on the number of particles present in the through thickness of the material. Evolution of dislocation structures through interactions of dislocations with particles, solutes, and other dislocations controls the deformation response of polycrystalline aluminum alloys. As deformation increases in a material, grains begin to break into volume elements that decrease in size with increasing strain. These volume elements are characterized by two different types of boundaries, incidental dislocation boundaries and geometrically necessary boundaries. Incidental dislocation boundaries (IDB) form by the random trappings of dislocations and geometrically necessary boundaries (GNB) form between regions with one or more different operating slip systems to accommodate the accompanying difference in lattice rotation [6]. These boundaries contain both statistically stored dislocations (redundant, +b -b), which do not contribute significantly to a net lattice rotation, and excess dislocations (non-redundant, often 57
73 termed geometrically necessary dislocations) that contribute to the net lattice rotation [7-9]. It has been observed by various authors that the character of dislocation structures formed is a function of the lattice orientation with respect to the imposed deformation gradient [10-12]. The presence of these deformation gradients in a material give rise to a lattice rotation θ and a net Burgers vector resulting in a rotation. The purpose of the present work is to obtain experimental data of dislocation structure evolution, in support of the development of a three dimensional crystal plasticity model to describe the deformation behavior of aluminum alloys. Basic to this model is an explicit evolution of dislocation density on all slip systems and the concept that the material behavior is controlled by the motion and interaction of excess dislocations [13]. The evolution of dislocation density depends on the divergence of dislocation fluxes associated with the inhomogeneous nature of plasticity in crystals [14]. Dislocation structure evolution during cold deformation of FCC polycrystals has been extensively investigated over the past couple of decades with primary emphasis on a qualitative description of the evolving structures and their relation to mechanical properties [15-20]. 4.3 Experimental Details: Aluminum alloy 7050-T7451 was obtained as industrially hot-rolled thick plate (~100 mm thick). Two samples were taken from the quarter plane (t/4 section) of the material and machined to final dimensions of 10 x 20 x 7.5 mm. No further heat treatment was conducted leaving the material in the as received condition. In the present experiments a channel die is used to simulate cold rolling of aluminum. This die imposes a nominally plane strain deformation gradient on the metal similar to that experienced by the aluminum passing through a rolling mill. To avoid problems associated with frictional conditions on the surfaces, the analysis surface is a 58
74 pseudo-internal interface wherein the specimen is split in two and the mating surfaces are prepared by a fine metallographic polish before deformation [21]. This surface is suitable for characterization by electron backscatter diffraction at various steps through the deformation process because it is protected from the majority of the shear deformation characteristic of the specimen surfaces in channel die deformation. Two samples were deformed at room temperature by channel die compression in true strain increments of ~0.05 at a strain rate of ~5.5x10⁻³ s -1, while the other two samples were deformed in true stain increments of ~0.005 at a strain rate of ~5.5x10⁻³ s -1. This form of plain strain deformation was used to impose the idealized deformation seen in rolling. TEFLON film was placed between the two samples and the samples and the die walls to prevent galling. At a strain of ~0.10 the samples that were deformed in strain increments of ~0.05 were reduced in size to 10 x 15 x7.5 mm to lower the force need to deform the material. However, due to the load capacity of the testing system the maximum attainable strain in these tests was a strain of ~0.15. EBSD analysis was performed using a Schottkey source field-emission scanning electron microscope. Prior to channel die deformation an 80 mm 2 area was scanned using a 40 µm step size to collect the initial texture. All subsequent scans were of the same 0.94 mm 2 area with a 2 µm step size. Scans of 0.2 µm step size were taken within the 0.94 mm 2 area to confirm the dislocation cell size. The scans were centered in the middle of the sample to minimize edge effects and any anomalous effects created by the punch or the die. The smaller step size was used in this area to obtain local information about point to point misorientation within grains allowing for calculation of excess dislocation density, dislocation cell size, and local orientation distribution of dislocations. Black regions in orientation images are regions with low confidence index (CI<0.2) data. The black regions in excess dislocation density images are either bad data or 59
75 regions of low dislocation density. Misorientations of 5 or greater are ignored, so data points along grain boundaries generally have a low apparent dislocation density. For the excess dislocation content and Taylor factor plotted in orientation space the same 80 mm 2 area was scanned to accurately represent the bulk material. Scans were completed at 15 µm. The data analysis was performed with in house software that had been modified to include the calculation of the dislocation density tensor. The software was set with the following parameters: grain tolerance angle 2 o, minimum grain size 5 steps. All averages are number averages which translate directly to averages of the grain area owing to the principle of DeLesse and the measurement strategy where data points are taken over a regular hexagonal array. Taylor factors for the given orientations were calculated using the family of active slip systems for FCC metals ({111}<1-10>) and the plane strain deformation gradient; σ xx = 1, σ zz = -1, σ yy = σ xy = σ xz = σ yz = Results The as received material was in the form of 100 mm thick hot rolled plate. The texture of the AA 7050 samples contains a combination of cube texture and an fcc rolling texture, showing a weak β fiber as show in the orientation distribution function (ODF) in Figure 4.1. Scatter occurs as the β fiber approaches the rotated cube orientation {001}<110> along with the rotated cube orientation while no {111}<uvw> component is observed in ϕ 2 = 45 [22]. In addition to the shear texture there is a strong cube orientation component present {001}<100> and brass component{110}<112> as shown in ϕ 2 = 0. Figure 4.2 shows the progression of orientation images obtained from a given area of one of the samples from the undeformed state to a state of 60


76 15% reduction. The undeformed orientation image shows a hot-rolled structure with a large variation in dislocation Figure 4.1: ODF of undeformed material contains a combination of cube texture and fcc rolling texture, showing a weak β fiber. Scatter occurs as the β fiber approaches the rotated cube orientation {001}<110> along with the rotated cube orientation while no {111}<uvw> component is observed in ϕ 2 = 45. cell size along the grain boundaries due to the manufacturing process of the sample. There is a significant amount of lattice curvature present in the undeformed material. The Taylor factor was calculated for {001}<100> orientations to be 2.22 for the given deformation state, while the{011}<1-12> was 3.07 and the {111}<01-1> grain had a Taylor factor of This would 61
, 5% (b), 10% (c), and 15% (d) reduction.")


77 indicate that the {011} and {111} grains should not deform until the {001} grains had hardened sufficiently to initiate slip in the grains of higher Taylor factor. Ultimately the higher Taylor Figure 4.2: Orientation images, from left to right, of undeformed (a), 5% (b), 10% (c), and 15% (d) reduction. factor grains would have a higher excess dislocation density due to the increased slip necessary for unit strain in these grains. On the other hand the {001} grains should initially deform easily resulting in a higher excess dislocation density but as the samples proceed through large deformation steps the excess dislocation density should not increase as rapidly as the {011} and {111} type grains. This is because the low Taylor factor means that these grains are soft in relation to the neighboring structure and will deform first, resulting in an increased dislocation density. As these harden due to the cold work, the grains with increased Taylor factor will deform. Because of the increased Taylor factor these require more dislocation motion per unit strain to deform, therefore the density will increase at a more rapid rate than in these grains with a lower Taylor factor. This trend was observed experimentally when the excess dislocation 62
78 density was calculated. Neighboring grains influence this behavior by constraints imposed upon deformation of softer grains by load shielding from grains of higher Taylor factor, resulting in dislocation density evolution to be less predictable for these regions. Figure 4.3 shows the excess dislocation density maps generated from the same data represented in the orientation images shown in Figure 4.2. White areas are regions of high excess dislocation density while black regions are grain boundaries or data filtered out by the software. The gray scale indicates black for regions of excess dislocation density less than m -2 to white for densities of m -2 on a linear scale. Regions of highest density occur in the {112}<uvw> orientations in the undeformed material and continue to have the highest densities throught the deformation process. Grain to grain interaction produces local regions of high dislocation densities that appear planar and are parallel to the RD. While in a previous study [23] the samples were recrystallized and comparatively dislocation free, 2 x m -2, these samples have been hot rolled and aged resulting in a highly deformed and polygonized initial structure with wide variations in dislocation cell sizes, especially along grain boundaries. Initially the hard grains deform very little while imposing greater deformation on the soft grains. As the excess dislocation density increases there is particle (MgZn 2 ) dislocation interaction and dislocation-dislocation interaction, resulting in an increasingly well-defined grain substructure. Subsequent dislocation cell sizes decreased with each deformation step and the excess dislocation density increased as shown in Figure 4.4 and Table
 areas and regions of low confidence data while the")


79 Figure 4.3: Excess dislocation density maps for the orientation images shown in Figure 2. Black areas are the lowest density (10 11 m -2 ) areas and regions of low confidence data while the lighter areas are the regions of highest excess dislocation density (10 15 m -2 ). With respect to specific orientations for small deformation steps, incrementally the {001} grains increase the most through a true strain of At a true strain of 0.05 through 0.1 the {011} grains significantly increase in excess dislocation content shown in Figure 4.5. After which the excess dislocation content does not significantly increase in any specific orientation shown. The dislocation cell size with respect to crystal orientation does not follow a distinct trend and seems to be complicated by the initial condition of the alloy. 64
80 Figure 4.4: Excess dislocation density and dislocation cell size for each deformation step. excess dislocation density increases with increasing deformation while dislocation cell size decreases. With respect to specific orientations for small deformation steps, incrementally the {001} grains increase the most through a true strain of At a true strain of 0.05 through 0.1 the {011} grains significantly increase in excess dislocation content shown in Figure 4.5. After which the excess dislocation content does not significantly increase in any specific orientation shown. The dislocation cell size with respect to crystal orientation does not follow a distinct trend and seems to be complicated by the initial condition of the alloy. 65
81 Table 4.1: Excess dislocation density evolution data for AA 7050 T7451 in channel die deformation from undeformed state through 15% deformation by orientation. Dislocation cell size evolution from undeformed through 15% deformation. Table 4.1 Sample 1 Excess Dislocation Density Deformation EDD* (10 12 m -2 ) Cell Size (um) 001 GND (10 12 m -2 ) 011 GND (10 12 m -2 ) 111 GND (10 12 m -2 ) 0% % % % % Sample 1 2.5% % % % % % % % * - Excess dislocation density Once the excess dislocation density has been calculated it is plotted in orientation space from data generated from orientation images. The excess dislocation density was determined from these grains and can be plotted as a scalar value in orientation space resulting in a plot that 66
82 Figure 4.5: Excess dislocation density by orientation, initially the {011} start with a very high dislocation density due to the manufacturing processes. Both {001} and {111} grains show a fairly linear increase throughout the deformation process, while the {011} jump significantly after 5% deformation. shows the orientations containing the highest excess dislocation density. Figure 4.6 shows the excess dislocation density plots from the undeformed state through 15% deformation. The undeformed excess dislocation plot shows a fairly evenly distributed excess dislocation density across all orientations, with a slightly higher density at the {112}<110> which is visible in the ϕ 2 = 65 and ϕ 2 = 45 and {112}<111> visible in ϕ 2 = 45. As deformation progresses to 5% dislocation density rapidly increases in the rotated cube orientation {001}<110>. 67


83 Figure 4.6: Excess dislocation density plotted in ODF space. Initially fairly even distribution with a slight peak at an orientation of {110}<111> in the undeformed state. As deformation increases excess dislocation density increases steadily along the {111}<uvw> fiber. The next step in analyzing the results was to plot the Taylor factor in orientation space as a scalar value, the same process as plotting the excess dislocation content in orientation space, to observe any correlation between excess dislocation content and Taylor factor. Figure 4.7 shows the Taylor factors plotted in orientation space from the same maps that the texture ODF and excess dislocation content plotted in orientation space were calculated from, only the 68


84 undeformed plot is shown. There appears to be a strong correlation between orientations with a Taylor factor > 4.0 and high excess dislocation content. While a weaker correlation exits between orientations with Taylor factors < 3.0 and lower excess dislocation content in the undeformed material. The Taylor factor along the β-fiber (also along rolling texture) is > 3.5 and is greater than the surrounding orientations and is in agreement with the excess dislocation plots. Figure 4.7: Taylor factor plotted in orientation space for the undeformed material. A good correlation between regions of high Taylor factor > 4.0 and regions of high excess dislocation density exist. 4.5 Discussion: Evolution of excess dislocation content at a given position in the polycrystal depends upon the crystallite lattice orientation and initial local lattice curvature. However, the effects of grain to grain interactions, grain size effects, and other local and non-local material properties 69
Strengthening Mechanisms
 ME 254: Materials Engineering Chapter 7: Dislocations and Strengthening Mechanisms 1 st Semester 1435-1436 (Fall 2014) Dr. Hamad F. Alharbi, harbihf@ksu.edu.sa November 18, 2014 Outline DISLOCATIONS AND
IMPERFECTIONSFOR BENEFIT. Sub-topics. Point defects Linear defects dislocations Plastic deformation through dislocations motion Surface
 IMPERFECTIONSFOR BENEFIT Sub-topics 1 Point defects Linear defects dislocations Plastic deformation through dislocations motion Surface IDEAL STRENGTH Ideally, the strength of a material is the force necessary
Movement of edge and screw dislocations
 Movement of edge and screw dislocations Formation of a step on the surface of a crystal by motion of (a) n edge dislocation: the dislocation line moves in the direction of the applied shear stress τ. (b)
Chapter Outline Dislocations and Strengthening Mechanisms. Introduction
 Chapter Outline Dislocations and Strengthening Mechanisms What is happening in material during plastic deformation? Dislocations and Plastic Deformation Motion of dislocations in response to stress Slip
3. Anisotropic blurring by dislocations
 Dynamical Simulation of EBSD Patterns of Imperfect Crystals 1 G. Nolze 1, A. Winkelmann 2 1 Federal Institute for Materials Research and Testing (BAM), Berlin, Germany 2 Max-Planck- Institute of Microstructure
Microstructural Characterization of Materials
 Microstructural Characterization of Materials 2nd Edition DAVID BRANDON AND WAYNE D. KAPLAN Technion, Israel Institute of Technology, Israel John Wiley & Sons, Ltd Contents Preface to the Second Edition
Lecture # 11 References:
 Lecture # 11 - Line defects (1-D) / Dislocations - Planer defects (2D) - Volume Defects - Burgers vector - Slip - Slip Systems in FCC crystals - Slip systems in HCP - Slip systems in BCC Dr.Haydar Al-Ethari
Lecture # 11. Line defects (1D) / Dislocations
 / Dislocations") Lecture # 11 - Line defects (1-D) / Dislocations - Planer defects (2D) - Volume Defects - Burgers vector - Slip - Slip Systems in FCC crystals - Slip systems in HCP - Slip systems in BCC References: 1-
Lecture # 11 - Line defects (1-D) / Dislocations - Planer defects (2D) - Volume Defects - Burgers vector - Slip - Slip Systems in FCC crystals - Slip systems in HCP - Slip systems in BCC References: 1-
Dislocations and Plastic Deformation
 Dislocations and Plastic Deformation Edge and screw are the two fundamental dislocation types. In an edge dislocation, localized lattice distortion exists along the end of an extra half-plane of atoms,
STRENGTHENING MECHANISM IN METALS
 Background Knowledge Yield Strength STRENGTHENING MECHANISM IN METALS Metals yield when dislocations start to move (slip). Yield means permanently change shape. Slip Systems Slip plane: the plane on which
Strengthening Mechanisms
 Strengthening Mechanisms The ability of a metal/ alloy to plastically deform depends on the ability of dislocations to move. Strengthening techniques rely on restricting dislocation motion to render a
TEM and Electron Diffraction Keith Leonard, PhD (1999) U. Cincinnati
 U. Cincinnati") TEM and Electron Diffraction Keith Leonard, PhD (1999) U. Cincinnati Electron Microscopes: Electron microscopes, such as the scanning electron microscope (SEM) and transmission electron microscope (TEM)
TEM and Electron Diffraction Keith Leonard, PhD (1999) U. Cincinnati Electron Microscopes: Electron microscopes, such as the scanning electron microscope (SEM) and transmission electron microscope (TEM)
Chapter 8 Strain Hardening and Annealing
 Chapter 8 Strain Hardening and Annealing This is a further application of our knowledge of plastic deformation and is an introduction to heat treatment. Part of this lecture is covered by Chapter 4 of
Imperfections in the Atomic and Ionic Arrangements
 Objectives Introduce the three basic types of imperfections: point defects, line defects (or dislocations), and surface defects. Explore the nature and effects of different types of defects. Outline Point
Twins & Dislocations in HCP Textbook & Paper Reviews. Cindy Smith
 Twins & Dislocations in HCP Textbook & Paper Reviews Cindy Smith Motivation Review: Outline Crystal lattices (fcc, bcc, hcp) Fcc vs. hcp stacking sequences Cubic {hkl} naming Hcp {hkil} naming Twinning
Introduction to Engineering Materials ENGR2000 Chapter 7: Dislocations and Strengthening Mechanisms. Dr. Coates
 Introduction to Engineering Materials ENGR2000 Chapter 7: Dislocations and Strengthening Mechanisms Dr. Coates An edge dislocation moves in response to an applied shear stress dislocation motion 7.1 Introduction
Imperfections, Defects and Diffusion
 Imperfections, Defects and Diffusion Lattice Defects Week5 Material Sciences and Engineering MatE271 1 Goals for the Unit I. Recognize various imperfections in crystals (Chapter 4) - Point imperfections
Chapter 7 Dislocations and Strengthening Mechanisms. Dr. Feras Fraige
 Chapter 7 Dislocations and Strengthening Mechanisms Dr. Feras Fraige Chapter Outline Dislocations and Strengthening Mechanisms What is happening in material during plastic deformation? Dislocations and
The Relationship between Crystal Rotation Axis Orientation and Active Slip System in Pure Aluminum Tricrystal Deformed in Compression
 Materials Transactions, Vol. 49, No. 3 (2008) pp. 419 to 423 #2008 The Japan Institute of Metals The Relationship between Crystal Rotation Axis Orientation and Active System in Pure Aluminum Tricrystal
A discrete dislocation plasticity analysis of grain-size strengthening
 Materials Science and Engineering A 400 401 (2005) 186 190 A discrete dislocation plasticity analysis of grain-size strengthening D.S. Balint a,, V.S. Deshpande a, A. Needleman b, E. Van der Giessen c
EBSD Basics EBSD. Marco Cantoni 021/ Centre Interdisciplinaire de Microscopie Electronique CIME. Phosphor Screen. Pole piece.
 EBSD Marco Cantoni 021/693.48.16 Centre Interdisciplinaire de Microscopie Electronique CIME EBSD Basics Quantitative, general microstructural characterization in the SEM Orientation measurements, phase
9/28/2013 9:26 PM. Chapter 3. The structure of crystalline solids. Dr. Mohammad Abuhaiba, PE
 Chapter 3 The structure of crystalline solids 1 2 Why study the structure of crystalline solids? Properties of some materials are directly related to their crystal structure. Significant property differences
Module-6. Dislocations and Strengthening Mechanisms
 Module-6 Dislocations and Strengthening Mechanisms Contents 1) Dislocations & Plastic deformation and Mechanisms of plastic deformation in metals 2) Strengthening mechanisms in metals 3) Recovery, Recrystallization
9/29/2014 8:52 PM. Chapter 3. The structure of crystalline solids. Dr. Mohammad Abuhaiba, PE
 1 Chapter 3 The structure of crystalline solids 2 Home Work Assignments HW 1 2, 7, 12, 17, 22, 29, 34, 39, 44, 48, 53, 58, 63 Due Sunday 12/10/2014 Quiz # 1 will be held on Monday 13/10/2014 at 11:00 am
factured pillars, even though the strength is significantly higher than in the bulk. These yield stress values, y
 Abstract The size effect in body-centered cubic (bcc) metals was comprehensively investigated through microcompression tests performed on focused ion beam machined tungsten (W), molybdenum (Mo) and niobium
Activation of deformation mechanism
 Activation of deformation mechanism The deformation mechanism activates when a critical amount of mechanical stress imposed to the crystal The dislocation glide through the slip systems when the required
Chapter 8. Deformation and Strengthening Mechanisms
 Chapter 8 Deformation and Strengthening Mechanisms Chapter 8 Deformation Deformation and Strengthening Issues to Address... Why are dislocations observed primarily in metals and alloys? How are strength
Strain. Two types of stresses: Usually:
 Stress and Texture Strain Two types of stresses: microstresses vary from one grain to another on a microscopic scale. macrostresses stress is uniform over large distances. Usually: macrostrain is uniform
Materials and their structures
 Materials and their structures 2.1 Introduction: The ability of materials to undergo forming by different techniques is dependent on their structure and properties. Behavior of materials depends on their
EBSD Electron BackScatter Diffraction Principle and Applications
 EBSD Electron BackScatter Diffraction Principle and Applications Dr. Emmanuelle Boehm-Courjault EPFL STI IMX Laboratoire de Simulation des Matériaux LSMX emmanuelle.boehm@epfl.ch 1 Outline! Introduction!
TOPIC 2. STRUCTURE OF MATERIALS III
 Universidad Carlos III de Madrid www.uc3m.es MATERIALS SCIENCE AND ENGINEERING TOPIC 2. STRUCTURE OF MATERIALS III Topic 2.3: Crystalline defects. Solid solutions. 1 PERFECT AND IMPERFECT CRYSTALS Perfect
- Slip by dislocation movement - Deformation produced by motion of dislocations (Orowan s Eq.)
") Lecture #12 - Critical resolved shear stress Dr. Haydar Al-Ethari - Slip y dislocation movement - Deformation produced y motion of dislocations (Orowan s Eq.) References: 1- Derek Hull, David Bacon, (2001),
Lecture #12 - Critical resolved shear stress Dr. Haydar Al-Ethari - Slip y dislocation movement - Deformation produced y motion of dislocations (Orowan s Eq.) References: 1- Derek Hull, David Bacon, (2001),
Dept.of BME Materials Science Dr.Jenan S.Kashan 1st semester 2nd level. Imperfections in Solids
 Why are defects important? Imperfections in Solids Defects have a profound impact on the various properties of materials: Production of advanced semiconductor devices require not only a rather perfect
Imperfections in atomic arrangements
 MME131: Lecture 9 Imperfections in atomic arrangements Part 2: 1D 3D Defects A. K. M. B. Rashid Professor, Department of MME BUET, Dhaka Today s Topics Classifications and characteristics of 1D 3D defects
Electron channelling contrast imaging (ECCI) an amazing tool for observations of crystal lattice defects in bulk samples
 an amazing tool for observations of crystal lattice defects in bulk samples") Electron channelling contrast imaging (ECCI) an amazing tool for observations of crystal lattice defects in bulk samples Stefan Zaefferer with contributions of N. Elhami, (general & steels) Z. Li F. Ram,
Electron channelling contrast imaging (ECCI) an amazing tool for observations of crystal lattice defects in bulk samples Stefan Zaefferer with contributions of N. Elhami, (general & steels) Z. Li F. Ram,
Microstructure Evolution of Polycrystalline Pure Nickel during Static Recrystallization 1
 Materials Transactions, Vol. 43, No. 9 (2002) pp. 2243 to 2248 c 2002 The Japan Institute of Metals Microstructure Evolution of Polycrystalline Pure Nickel during Static Recrystallization 1 Makoto Hasegawa
ENGN2340 Final Project Computational rate independent Single Crystal Plasticity with finite deformations Abaqus Umat Implementation
 ENGN2340 Final Project Computational rate independent Single Crystal Plasticity with finite deformations Abaqus Umat Implementation Anastasia Tzoumaka Fall 2017 Intorduction: Single crystals, are monocrystalline
Dislocations Linear Defects
 Dislocations Linear Defects Dislocations are abrupt changes in the regular ordering of atoms, along a line (dislocation line) in the solid. They occur in high density and are very important in mechanical
Introduction to Engineering Materials ENGR2000 Chapter 4: Imperfections in Solids. Dr. Coates
 Introduction to Engineering Materials ENGR000 Chapter 4: Imperfections in Solids Dr. Coates Learning Objectives 1. Describe both vacancy and self interstitial defects. Calculate the equilibrium number
Fundamentals of Plastic Deformation of Metals
 We have finished chapters 1 5 of Callister s book. Now we will discuss chapter 10 of Callister s book Fundamentals of Plastic Deformation of Metals Chapter 10 of Callister s book 1 Elastic Deformation
12/10/09. Chapter 4: Imperfections in Solids. Imperfections in Solids. Polycrystalline Materials ISSUES TO ADDRESS...
 Chapter 4: ISSUES TO ADDRESS... What are the solidification mechanisms? What types of defects arise in solids? Can the number and type of defects be varied and controlled? How do defects affect material
Carnegie Mellon MRSEC
 Carnegie Mellon MRSEC Texture, Microstructure & Anisotropy, Fall 2009 A.D. Rollett, P. Kalu 1 ELECTRONS SEM-based TEM-based Koseel ECP EBSD SADP Kikuchi Different types of microtexture techniques for obtaining
Crystallographic Distribution of Low Angle Grain Boundary Planes in Magnesium Oxide
 Citation & Copyright (to be inserted by the publisher ) Crystallographic Distribution of Low Angle Grain Boundary Planes in Magnesium Oxide D.M. Saylor 1, A. Morawiec 2, K.W. Cherry 1, F.H. Rogan 1, G.S.
Chapter 7: Dislocations and strengthening mechanisms
 Chapter 7: Dislocations and strengthening mechanisms Introduction Basic concepts Characteristics of dislocations Slip systems Slip in single crystals Plastic deformation of polycrystalline materials Plastically
Problems to the lecture Physical Metallurgy ( Materialkunde ) Chapter 6: Mechanical Properties
 Chapter 6: Mechanical Properties") Institut für Metallkunde und Metallphysik Direktor: Prof. Dr. rer. nat. Günter Gottstein RWTH Aachen, D-52056 Aachen Internet: http://www.imm.rwth-aachen.de E-mail: imm@imm.rwth-aachen.de Tel.: +49 241
Institut für Metallkunde und Metallphysik Direktor: Prof. Dr. rer. nat. Günter Gottstein RWTH Aachen, D-52056 Aachen Internet: http://www.imm.rwth-aachen.de E-mail: imm@imm.rwth-aachen.de Tel.: +49 241
Single vs Polycrystals
 WEEK FIVE This week, we will Learn theoretical strength of single crystals Learn metallic crystal structures Learn critical resolved shear stress Slip by dislocation movement Single vs Polycrystals Polycrystals
4-Crystal Defects & Strengthening
 4-Crystal Defects & Strengthening A perfect crystal, with every atom of the same type in the correct position, does not exist. The crystalline defects are not always bad! Adding alloying elements to a
AN INTRODUCTION TO OIM ANALYSIS
 AN INTRODUCTION TO OIM ANALYSIS Raising the standard for EBSD software The most powerful, flexible, and easy to use tool for the visualization and analysis of EBSD mapping data OIM Analysis - The Standard
Theory of orientation gradients in plastically strained crystals
 Acta Materialia 50 (2002) 421 440 www.elsevier.com/locate/actamat Theory of orientation gradients in plastically strained crystals D. Raabe a,*, Z. Zhao a, S.-J. Park b, F. Roters a a Max-Planck-Institut
Chapter 4: Imperfections (Defects) in Solids
 in Solids") Chapter 4: Imperfections (Defects) in Solids ISSUES TO ADDRESS... What types of defects exist in solids? How do defects affect material properties? Can the number and type of defects be varied and controlled?
Chapter 4: Imperfections (Defects) in Solids ISSUES TO ADDRESS... What types of defects exist in solids? How do defects affect material properties? Can the number and type of defects be varied and controlled?
MAX-PLANCK PROJECT REPORT
 FINITE ELEMENT SIMULATION OF PLASTIC DEFORMATION OF STEELS MAX-PLANCK PROJECT REPORT D. Raabe, F. Roters Max-Planck-Institut für Eisenforschung Max-Planck-Str. 1 40237 Düsseldorf Germany February 2004,
 Defects in solids http://www.bath.ac.uk/podcast/powerpoint/inaugural_lecture_250407.pdf http://www.materials.ac.uk/elearning/matter/crystallography/indexingdirectionsandplanes/indexing-of-hexagonal-systems.html
Effects of Film Thickness on the Yielding Behavior of Polycrystalline Gold Films
 Effects of Film Thickness on the Yielding Behavior of Polycrystalline Gold Films H.D. Espinosa and B.C. Prorok Department of Mechanical Engineering, Northwestern University Evanston, IL 628-3111, USA ABSTRACT
much research (in physics, chemistry, material science, etc.) have been done to understand the difference in materials properties.
 have been done to understand the difference in materials properties.") 1.1: Introduction Material science and engineering Classify common features of structure and properties of different materials in a well-known manner (chemical or biological): * bonding in solids are classified
1.1: Introduction Material science and engineering Classify common features of structure and properties of different materials in a well-known manner (chemical or biological): * bonding in solids are classified
9/16/ :30 PM. Chapter 3. The structure of crystalline solids. Mohammad Suliman Abuhaiba, Ph.D., PE
 Chapter 3 The structure of crystalline solids 1 Mohammad Suliman Abuhaiba, Ph.D., PE 2 Home Work Assignments HW 1 2, 7, 12, 17, 22, 29, 34, 39, 44, 48, 53, 58, 63 Due Sunday 17/9/2015 3 Why study the structure
Influence of Crystal Orientations on the Bendability of an Al-Mg-Si Alloy
 Materials Transactions, Vol. 51, No. 4 (2010) pp. 614 to 619 Special Issue on Crystallographic Orientation Distribution and Related Properties in Advanced Materials II #2010 The Japan Institute of Light
Thin Film Scattering: Epitaxial Layers
 Thin Film Scattering: Epitaxial Layers 6th Annual SSRL Workshop on Synchrotron X-ray Scattering Techniques in Materials and Environmental Sciences: Theory and Application May 29-31, 2012 Thin films. Epitaxial
CHEM-E5225 :Electron Microscopy Imaging II
 CHEM-E5225 :Electron Microscopy Imaging II D.B. Williams, C.B. Carter, Transmission Electron Microscopy: A Textbook for Materials Science, Springer Science & Business Media, 2009. Z. Luo, A Practical Guide
Deformation Microstructure and Texture in a Cold-Rolled Austenitic Steel with Low Stacking-Fault Energy
 Materials Transactions, Vol. 51, No. 4 (2010) pp. 620 to 624 Special Issue on Crystallographic Orientation Distribution and Related Properties in Advanced Materials II #2010 The Japan Institute of Metals
E45 Midterm 01 Fall 2007! By the 0.2% offset method (shown on plot), YS = 500 MPa
, YS = 500 MPa") 1.!Mechanical Properties (20 points) Refer to the following stress-strain plot derived from a standard uniaxial tensile test of a high performance titanium alloy to answer the following questions. Show
1.!Mechanical Properties (20 points) Refer to the following stress-strain plot derived from a standard uniaxial tensile test of a high performance titanium alloy to answer the following questions. Show
Crystal Defects. Perfect crystal - every atom of the same type in the correct equilibrium position (does not exist at T > 0 K)
") Crystal Defects Perfect crystal - every atom of the same type in the correct equilibrium position (does not exist at T > 0 K) Real crystal - all crystals have some imperfections - defects, most atoms are
Crystal Defects Perfect crystal - every atom of the same type in the correct equilibrium position (does not exist at T > 0 K) Real crystal - all crystals have some imperfections - defects, most atoms are
Strengthening Mechanisms. Today s Topics
 MME 131: Lecture 17 Strengthening Mechanisms Prof. A.K.M.B. Rashid Department of MME BUET, Dhaka Today s Topics Strengthening strategies: Grain strengthening Solid solution strengthening Work hardening
The effect of different step-size on the visualization of crystallographic defects using SEM/EBSD technique
 Int. Jnl. of Multiphysics Volume 9 Number 1 2015 37 The effect of different step-size on the visualization of crystallographic defects using SEM/EBSD technique Yoshikazu HIGA*, Ken SHIMOJIMA and Takashi
Structural change during cold rolling of electrodeposited copper
 Materials Science Forum Vols. 539-543 (2007) pp. 5013-5018 online at http://www.scientific.net (2007) Trans Tech Publications, Switzerland Structural change during cold rolling of electrodeposited copper
(a) Would you expect the element P to be a donor or an acceptor defect in Si?
 Would you expect the element P to be a donor or an acceptor defect in Si?") MSE 200A Survey of Materials Science Fall, 2008 Problem Set No. 2 Problem 1: At high temperature Fe has the fcc structure (called austenite or γ-iron). Would you expect to find C atoms in the octahedral
MSE 200A Survey of Materials Science Fall, 2008 Problem Set No. 2 Problem 1: At high temperature Fe has the fcc structure (called austenite or γ-iron). Would you expect to find C atoms in the octahedral
Symmetry and Anisotropy Structure, Properties, Sample and Material, Texture and Anisotropy, Symmetry
 Symmetry and Anisotropy Structure, Properties, Sample and Material, Texture and Anisotropy, Symmetry Objectives Symmetry Operators & Matrix representation. Effect of crystal and sample symmetry
Measurement of Residual Stress by X-ray Diffraction
 Measurement of Residual Stress by X-ray Diffraction C-563 Overview Definitions Origin Methods of determination of residual stresses Method of X-ray diffraction (details) References End Stress and Strain
Why are dislocations observed primarily in metals CHAPTER 8: DEFORMATION AND STRENGTHENING MECHANISMS
 Why are dislocations observed primarily in metals CHAPTER 8: and alloys? DEFORMATION AND STRENGTHENING MECHANISMS How are strength and dislocation motion related? How do we manipulate properties? Strengthening
3. Solidification & Crystalline Imperfections
 3. Solidification & Crystalline Imperfections solidification (casting process) of metals divided into two steps (1) nucleation formation of stable nuclei in the melt (2) growth of nuclei into crystals
Mechanical Properties
 Mechanical Properties Elastic deformation Plastic deformation Fracture II. Stable Plastic Deformation S s y For a typical ductile metal: I. Elastic deformation II. Stable plastic deformation III. Unstable
Student Name: ID Number:
 Student Name: ID Number: DEPARTMENT OF MECHANICAL ENGINEERING CONCORDIA UNIVERSITY MATERIALS SCIENCE - MECH 1/ - Sections T & X MIDTERM 003 Instructors: Dr. M.Pugh & Dr. M.Medraj Time Allowed: one (1)
Dislocations & Materials Classes. Dislocation Motion. Dislocation Motion. Lectures 9 and 10
 Lectures 9 and 10 Chapter 7: Dislocations & Strengthening Mechanisms Dislocations & Materials Classes Metals: Disl. motion easier. -non-directional bonding -close-packed directions for slip. electron cloud
Engineering 45: Properties of Materials Final Exam May 9, 2012 Name: Student ID number:
 Engineering 45: Properties of Materials Final Exam May 9, 2012 Name: Student ID number: Instructions: Answer all questions and show your work. You will not receive partial credit unless you show your work.
High temperature applications
 3. CREEP OF METALS Lecturer: Norhayati Ahmad High temperature applications -Steel power plants -Oil refineries -Chemical plants High operating temperatures Engine jet ----1400 o C Steam turbine power plants:
Let s show em what we re made of
 Let s show em what we re made of might be an effective battle cry for human warfighters, but when considering the materials on which these warfighters rely, relating material composition to properties
Single crystal X-ray diffraction. Zsolt Kovács
 Single crystal X-ray diffraction Zsolt Kovács based on the Hungarian version of the Laue lab description which was written by Levente Balogh, Jenő Gubicza and Lehel Zsoldos INTRODUCTION X-ray diffraction
{001} Texture Map of AA5182 Aluminum Alloy for High Temperature Uniaxial Compression
 Materials Transactions, Vol., No. (00) pp. 6 to 67 #00 The Japan Institute of Light Metals {00} Texture Map of AA8 Aluminum Alloy for High Temperature Uniaxial Compression Hyeon-Mook Jeong*, Kazuto Okayasu
SECTION A. NATURAL SCIENCES TRIPOS Part IA. Friday 4 June to 4.30 MATERIALS AND MINERAL SCIENCES
 NATURAL SCIENCES TRIPOS Part IA Friday 4 June 1999 1.30 to 4.30 MATERIALS AND MINERAL SCIENCES Answer five questions; two from each of sections A and B and one from section C. Begin each answer at the
CREEP CREEP. Mechanical Metallurgy George E Dieter McGraw-Hill Book Company, London (1988)
") CREEP CREEP Mechanical Metallurgy George E Dieter McGraw-Hill Book Company, London (1988) Review If failure is considered as change in desired performance*- which could involve changes in properties and/or
CREEP CREEP Mechanical Metallurgy George E Dieter McGraw-Hill Book Company, London (1988) Review If failure is considered as change in desired performance*- which could involve changes in properties and/or
Crystallographic orientation
 Crystallographic orientation Orientations and misorientations Orientation (g): The orientation of the crystal lattice with respect to some reference frame; usual a frame defined by the processing or sample
Evolution of Microstructure and Texture Associated with Ridging in Ferritic Stainless Steels
 , pp. 100 105 Evolution of Microstructure and Texture Associated with Ridging in Ferritic Stainless Steels SooHo PARK, KwangYuk KIM, YongDeuk LEE and ChanGyung PARK 1) Stainless Steel Research Group, Technical
Microstructural parameters from Multiple Whole Profile (MWP) or Convolutional Multiple Whole Profile (CMWP) computer programs
 or Convolutional Multiple Whole Profile (CMWP) computer programs") Microstructural parameters from Multiple Whole Profile (MWP) or Convolutional Multiple Whole Profile (CMWP) computer programs Iuliana Dragomir-Cernatescu School of Materials Science and Engineering, Georgia
Microstructural parameters from Multiple Whole Profile (MWP) or Convolutional Multiple Whole Profile (CMWP) computer programs Iuliana Dragomir-Cernatescu School of Materials Science and Engineering, Georgia
Deformation Twinning in Bulk Aluminum with Coarse Grains
 Proceedings of the 12th International Conference on Aluminium Proceedings Alloys, of the September 12th International 5-9, 2010, Yokohama, Conference Japan on 2010 Aluminum The Japan Alloys, Institute
Atomic Densities. Linear Density. Planar Density. Linear Density. Outline: Planar Density
 Atomic Densities Outline: Atomic Densities - Linear Density - Planar Density Single- vs poly- crystalline materials X-ray Diffraction Example Polymorphism and Allotropy Linear Density Number of atoms per
MEASURING RELATIVE GRAIN BOUNDARY ENERGIES AND MOBILITIES IN AN ALUMINUM FOIL FROM TRIPLE JUNCTION GEOMETRY
 v MEASURING RELATIVE GRAIN BOUNDARY ENERGIES AND MOBILITIES IN AN ALUMINUM FOIL FROM TRIPLE JUNCTION GEOMETRY C.-C. Yang, A. D. Rollett and W. W. Mullins Carnegie Mellon University, Materials Science and
Homework 4 on Dislocations, Yield Stress, Hardness, Creep, Grain Size
 Homework 4 on Dislocations, Yield Stress, Hardness, Creep, Grain Size 27-301, A. D. Rollett, Fall 2002 Chemical processing plant sometimes uses nickel or nickel-based alloys because of their corrosion
Lectures on: Introduction to and fundamentals of discrete dislocations and dislocation dynamics. Theoretical concepts and computational methods
 Lectures on: Introduction to and fundamentals of discrete dislocations and dislocation dynamics. Theoretical concepts and computational methods Hussein M. Zbib School of Mechanical and Materials Engineering
Material Science. Prof. Satish V. Kailas Associate Professor Dept. of Mechanical Engineering, Indian Institute of Science, Bangalore India
 Material Science Prof. Satish V. Kailas Associate Professor Dept. of Mechanical Engineering, Indian Institute of Science, Bangalore 560012 India Chapter 3. Imperfections in Solids Learning objectives:
Introduction to Electron Backscattered Diffraction. TEQIP Workshop HREXRD Feb 1 st to Feb 5 th 2016
 Introduction to Electron Backscattered Diffraction 1 TEQIP Workshop HREXRD Feb 1 st to Feb 5 th 2016 SE vs BSE 2 Ranges and interaction volumes 3 (1-2 m) http://www4.nau.edu/microanalysis/microprobe/interact-effects.html
Atomic Densities. Linear Density Number of atoms per length whose centers lie on the direction vector for a specific crystallographic direction.
 Atomic Densities Linear Density Number of atoms per length whose centers lie on the direction vector for a specific crystallographic direction. Planar Density Number of atoms per unit area that are centered
The influence of aluminium alloy quench sensitivity on the magnitude of heat treatment induced residual stress
 Materials Science Forum Vols. 524-525 (26) pp. 35-31 online at http://www.scientific.net (26) Trans Tech Publications, Switzerland The influence of aluminium alloy quench sensitivity on the magnitude of
Distribution and Energies of Grain Boundaries in Magnesia as a Function of. Five Degrees of Freedom
 Distribution and Energies of Grain Boundaries in Magnesia as a Function of Five Degrees of Freedom David M. Saylor a, Adam Morawiec b, Gregory S. Rohrer c Materials Science and Engineering Dept., Carnegie
Learning Objectives. Chapter Outline. Solidification of Metals. Solidification of Metals
 Learning Objectives Study the principles of solidification as they apply to pure metals. Examine the mechanisms by which solidification occurs. - Chapter Outline Importance of Solidification Nucleation
CHAPTER 8 DEFORMATION AND STRENGTHENING MECHANISMS PROBLEM SOLUTIONS
 CHAPTER 8 DEFORMATION AND STRENGTHENING MECHANISMS PROBLEM SOLUTIONS Slip Systems 8.3 (a) Compare planar densities (Section 3.15 and Problem W3.46 [which appears on the book s Web site]) for the (100),
Chapter 4. Introduction to Dislocations
 Chapter 4 Introduction to Dislocations The discrepancy between the theoretical and observed yield stresses of crystals Dislocations The Burgers vector Vector notation for dislocations Dislocations in the
 LA-UR-01-3685 Approved for public release; distribution is unlimited. Title: USING A MULTI-DISCIPLINARY APPROACH, THE FIRST ELECTRON BACKSCATTERED KIKUCHI PATTERNS WERE CAPTURED FOR A PLUTONIUM ALLOY Author(s):
Engineering materials
 1 Engineering materials Lecture 2 Imperfections and defects Response of materials to stress 2 Crystalline Imperfections (4.4) No crystal is perfect. Imperfections affect mechanical properties, chemical
Defects and Diffusion
 Defects and Diffusion Goals for the Unit Recognize various imperfections in crystals Point imperfections Impurities Line, surface and bulk imperfections Define various diffusion mechanisms Identify factors
Multiscale models of metal plasticity Part II: Crystal plasticity to subgrain microstructures
 Multiscale models of metal plasticity Part II: Crystal plasticity to subgrain microstructures M. Ortiz California Institute of Technology MULTIMAT closing meeting Bonn, Germany, September 12, 2008 Dislocation
CME 300 Properties of Materials. ANSWERS Homework 2 September 28, 2011
 CME 300 Properties of Materials ANSWERS Homework 2 September 28, 2011 1) Explain why metals are ductile and ceramics are brittle. Why are FCC metals ductile, HCP metals brittle and BCC metals tough? Planes