A-Site Deficient Lanthanum Strontium Chromite Oxide with In-Situ Growth of Ni-
|
|
|
- Abel Bradley
- 6 years ago
- Views:
Transcription
1 A-Site Deficient Lanthanum Strontium Chromite Oxide with In-Situ Growth of Ni- Co Nano-Alloys: A Potential Electrode Catalyst for Solid Oxide Fuel Cell by Lin Cui A thesis submitted in partial fulfillment of the requirements for the degree of Master of Science In Chemical Engineering Department of Chemical and Materials Engineering University of Alberta Lin Cui, 2017
2 ABSTRACT Solid oxide fuel cell (SOFC) is an advanced power generation device that has desirable fuel flexibility and higher efficiency compared to conventional electricity generators. Since SOFC requires different fuel gases for reactions, a catalytically active fuel electrode with excellent stability as well as good carbon deposition resistance is the real challenge for the cell. In this research, the in-situ exsolved bimetallic doped A-site deficient perovskite oxide: A-site deficient nickel (Ni) and cobalt (Co) bimetallic doped lanthanum strontium chromite oxide (LSC) has been fabricated as a potential fuel electrode for SOFC. The in-situ exsolution process of Ni-Co alloy has been elaborately studied from various aspects. The electrochemical performances of Ni-Co doped LSC are thoroughly compared with Ni doped LSC in hydrogen gas, syngas as the anode and in CO2 gas as the cathode. The fuel cell with a bimetallic doped LSC anode has shown maximum power densities of 329 mw/cm 2 in hydrogen and 258 mw/cm 2 in syngas compared with only 237mW/cm 2 in hydrogen and 170 mw/cm 2 in syngas for the fuel cell with the single metallic doped anode at 850. The Ni-Co doped electrode also has shown higher optimum operating voltage and better stability than the Ni doped electrode in cathode function. Ni-Co doped cells have demonstrated no obvious degradation during long-term operation as well as good carbon deposition resistance under the tested atmosphere. It can be postulated that the existence of A-site deficiency helps the formation of oxygen vacancies as well as enhances the ii
3 reducibility of B-site ions. Meanwhile, the synergistic effect between Co and Ni has changed the reduction behavior of Ni particles that increased its reducibility and promoted its electrochemical performances as well as the carbon deposition resistance. iii
4 Acknowledgement I would like to give my most sincere appreciation to my dear supervisor, Dr. Jingli Luo for all the guidance and encouragement from her. It was her great patience and understandings that encouraged and pacified me when I struggled with problems and troubles. The knowledge and ideas I have received from her not only helped me to accomplish my research in past two years, but also opened up my eyes to a wider vision of the world. I am so proud to be one of her students. I am also grateful to Dr. Yifei Sun, Yaqian Zhang and Dr. Bin Hua for all of their valuable advice and suggestions that guided me throughout my whole research process and thesis writing period. Their knowledge and supports make my study life here extremely fun and unforgettable. I also wish to thank my colleagues and friends, Xianzong Wang, Subiao Liu, Wenfei Wang, Shuo Shuang, Jiankuan Li, Minkang Liu, Ermia Aghaie, and Dr. Yashar Behnamianfor all their support and encouragement during my study life in this group. In the end, I wish thank my parents for their love and support. Their unconditional trust and love provide me the endless courage to pursue my dream and face the challenges in the future. iv
5 Table of Contents ABSTRACT... ii Acknowledgement... iv List of Figures... viii List of Tables... xi List of Symbols... xii List of Abbreviations... xiv Chapter 1 Background Information Fossil Thermal Power Generation, Fuel Cells and SOFC Fossil Fuel Power Generation Fuel Cells and SOFC Thesis Objectives and Contents... 6 Chapter 2 Literature Review Thermodynamics of SOFC Cells Performance and Polarizations Triple Phase Boundary Electrolyte Materials The Oxygen Electrode Materials Fuel Electrode Materials Ni-YSZ and Existing Limitations Perovskite Oxide Based Material Bimetallic Nanoparticles Doping and Perovskite Non-stoichiometry Chapter 3 Experiment Methodology Synthesis of Cell Materials Sol-Gel Combustion Method Experimental Procedure of Electrode Fabrication v
6 3.1.3 Fabrication of Solid Oxide Cells Electrochemical Test Setup for SOFC Characterization of the Catalyst Powder X-Ray Diffraction Scanning Electron Microscopy and Energy Dispersive X-ray Spectroscopy Thermogravimetric Analysis and Mass Spectrometry Gas Chromatography Electrochemical Measurements Electrochemical Impedance Spectra Current Density-Voltage Curves Chapter 4 Results and Discussion Analyses of Fuel Electrode Materials In-situ Exsolution Analysis XRD Results Analysis TPR Results Analysis TGA Results Analysis SEM Result Analysis Electrochemical Performances of the Cell Electrochemical Performance: j-v Curves Electrochemical Performance: EIS Curves Electrochemical Performance: Stability Tests Carbon Deposition Analysis Chapter 5 Conclusions and Future Work Conclusions Future Work vi
7 References: vii
8 List of Figures Figure 1.1. a) The world final consumption by fuel from 1971 to b) The world electricity generation from 1971 to Figure 1.2. The schematic diagram of traditional thermal power station Figure 1.3. The schematic diagram of the fuel cell operating principle Figure 2.1. Typical j-v performance of a SOFC Figure 2.2. The schematic diagram for triple phase boundaries Figure 2.3. the SEM image of fresh Ni-YSZ a) Ni-YSZ after carbon deposition in methane (CH4) for 4 hour at 600 C (873K) b) and 800 C (1073K) c) Figure 2.4. Crystal structure of perovskite oxide centered at a) B site atom, b) A site atom Figure 2.5. Schematic of typical wet infiltration method Figure 2.6. Schematic of a) wet impregnation process, b) in-situ exsolution Figure 2.7. Decoration catalyst particles M through a) chemical infiltration b) in situ redox exsolution Figure 2.8. Schematic of possible carbon fiber growth mechanisms Figure 3.1. Material fabrication flow chart by sol-gel combustion method Figure 3.2. Schematic of Milling Machine Figure 3.3. Image of the screen printer and ink printed cell Figure 3.4. Schematic Diagram for electrochemical performance test setup Figure 3.5 Schematic of a typical Nyquist plot for EIS analysis for SOFC Figure 4.1. Crystalline structures of LSC based perovskite with different bimetallic doping ratios: LSC-6315NiCo LSC-6312NiCo LSC-6309NiCo LSC-6306NiCo LSC- 6303NiCo viii
9 Figure 4.2. XRD diagram for perovskite oxide LSC-6309NiCo LSC-6309Ni and LSC- 7309NiCo a) the general diagram for all peaks b) detailed positions for main peaks Figure 4.3. The theoretical value of Gibbs free energy for reduction of each element oxide in LSC-6309NiCo perovskite at 600 C to 800 C Figure 4.4. Ni-Co alloy phase diagram Figure 4.5. a) XRD diagram for reduced LSC-6309NiCo LSC-6309Ni LSC-7309NiCo b) specified diagram for exsolution peaks c) overlapping of exsolution peaks Figure 4.6. a) XRD diagram for reduced LSC-6309NiCo LSC-6306NiCo LSC-6303NiCo b) specified diagram for Ni-Co alloy peaks Figure 4.7. H2-TPR curves of the fresh LSC, LSC-6309NiCo, LSC-6309Ni, and LSC- 7309NiCo Figure 4.8. H2-TPR curves of the fresh LSC, LSC-6309NiCo, LSC-6306NiCo, and LSC- 6303NiCo Figure 4.9. TGA diagram in 5%H2/N2 for a) LSC 6303NiCo, LSC-6306NiCo, and LSC- 6309NiCo b) LSC-6309NiCo, LSC-6309Ni, and LSC-7309NiCo Figure SEM image for fresh LSC-6309NiCo microstructure Figure SEM images for reduced LSC-6309NiCo microstructures a) the bulk b) the bulk with higher magnification c) & d) are the SEM image and correlated point scanning results Figure SEM image of fresh LSC-6309Ni microstructure Figure SEM images for reduced LSC-6309Ni microstructures a) the bulk b) the bulk with higher magnification c) & d) are the SEM image and correlated point scanning results Figure SEM image of the cross-section area of the cell Figure j-v curves of LSC-6309NiCo and LSC-6309Ni at 850 C in pure H2 gas Figure j-v curves of LSC-6309NiCo and LSC-6309Ni at 850 C in syngas ix
10 Figure XRD diagram of LSC-6309NiCo and LSC-6309Ni in CO2 for 24 hours Figure j-v curves of LSC-6309NiCo and LSC-6309Ni at 850 C in CO&CO Figure EIS curves of LSC-6309NiCo and LSC-6309Ni at 850 C in pure H2 gas Figure EIS curves of LSC-6309NiCo and LSC-6309Ni at 850 C in syngas Figure The EIS curves of LSC-6309NiCo and LSC-6309Ni at 850 C in CO&CO Figure Experimental SOEC EISs at different applied voltages in the atmosphere of CO2/CO (70:30) (a) for LSC-6309NiCo (b) for LSC-6309Ni Figure The 30 hours stability test for LSC-6309NiCo in H2 at constant 0.85V voltage Figure The 30-hour stability test for LSC-6309NiCo in Syngas at a constant voltage of 0.83V Figure Short term stabilities of the electrolysis cells with (a) LSC-6309NiCo and (b) LSC-6309Ni cathodes at 850 C at various applied voltages Figure Stability test of LSC-6309NiCo electrolysis cell at 0.3V vs. OCV Figure TPO curves for CH4 treated LSC-6309NiCo and LSC-6309Ni x
11 List of Tables Table 1.1. Five main types of fuel cell Table 2.1. Typical perovskite oxide applications for solid oxide cells Table 4.1. Designation of Bimetallic Doping Ratio Experiment Table 4.2. Designation of fuel electrode compositions xi
12 List of Symbols A d E E 0 E a E ω F ΔG I ω j k λ n n η act η conc η ohmic P p r A r B r o R θ Pre-Exponential Factor Distance Between the Atomic Layers of Crystal Reversible Voltage Standard Reversible Voltage Activation Energy Frequency Dependent Potential Faraday Constant Change in Gibbs Free Energy Frequency Dependent Current Current Density Rate Constant Wavelength Mole of electrons transferring during the reaction Integer Activation Polarization Concentration Polarization Ohmic Polarization Produced power density Partial pressure Ionic Radius of Atom A Ionic Radius of Atom B Ionic Radius of Oxygen Universal Gas Constant Angle of incidence xii
13 T t δ V W Z ω Temperature Tolerance Factor Oxygen Vacancies Voltage output Electrical Work Frequency Dependent Resistance (Impedance) xiii
14 List of Abbreviations AE AFC BE EDS EDTA EIA EIS GC GDC/ CGO GHG LCC LSC LSC LSCF LSM MCFC MS MTOE OCV PAFC PEM SE SEM SOEC Alkaline Earth Alkaline Fuel Cell Backscattered Electrons Energy Dispersive X-ray Spectroscopy Ethylene Diamine Tetra Acetic Acid International Energy Agency Electrochemical Impedance Spectroscopy Gas Chromatography Gadolinium-Doped Ceria Greenhouse Gas LaCaCrO3-δ Lanthanum Strontium Chromite Oxide LaSrCrO3-δ Strontium and Cobalt Doped Lanthanum Ferrite Oxide Strontium-Doped Lanthanum Manganite Oxide Molten Carbonate Fuel Cells Mass Spectrometry Million Tons of Oil Equivalent Open Circuit Voltage Phosphoric Acid Fuel Cells Polymer Electrolyte Membrane Secondary Electrons Scanning Electron Microscopy Solid Oxide Electrolysis Cell xiv
15 SOFC TGA TPB TPO TPR TWh XRD YSZ Solid Oxide Fuel Cell Thermogravimetric Analysis Triple Phase Boundary Temperature Program Oxidation Temperature Programmed Reduction Terawatt Hours X-Ray Diffraction Yttria Stabilized Zirconia xv

16 Chapter 1 Background Information The Fossil Resource Consumption The rapid growth of the world s energy consumption in recent years, and subsequent increase in GHG (greenhouse gas) emissions, has raised serious concerns about heavy environmental impacts such as global warming and climate change. 1 Figure 1.1 a) and b) depict the fuel consumption and fuel electricity generation trends of the last four decades, respectively. These data have been collected and revealed by the International Energy Agency (EIA) From 1973 to 2013, the world total final consumption of fuel has grown by 99.3% (4667 Mtoe (Million Tons of Oil Equivalent) to 9301 Mtoe). As the second largest energy resource in the world, the consumption proportion of the electricity is almost doubled in last four decades (from 9.4% to 18.0%). In terms of electricity generation, fossil fuels still play a significant role as depicted in Figure 1.1(b) that most of the electricity is generated by fossil thermal method, and the amount of generated electricity has increased by 280% (6131TWh to TWh). 2 Figure 1.1. a) The world final consumption by fuel from 1971 to b) The world electricity generation from 1971 to
17 To mitigate the massive usage of fossil fuels for electricity generation, efforts can be placed onto the investigation of novel energy generation methods with higher conversion efficiency with environmentally friendly, low pollution conversion emissions, such as the electrochemical approach. 1.2 Fossil Thermal Power Generation, Fuel Cells and SOFC Fossil Fuel Power Generation As illustrated in Figure 1.2, a traditional thermal power station contains a complicated energy conversion process. At first, the chemical energy contained in fossil fuels is converted into thermal energy through combustion. The thermal energy is then applied to a steam boiler to generate mechanical energy with the use of a steam turbine, and at last, electricity is produced by transforming mechanical energy using a generator. 3 Throughout the process of converting chemical energy into electricity, a loss of energy can be expected at each of the four conversion steps. In addition, on-site water processing and pollution control facilities also consume a part of the produced electricity. As a result, modern steam cycling thermal power stations have an efficiency of only around 40%. 4 Therefore, from the overall point of view, the operation of a fossil thermal power station contains unavoidable limitations that constrain its development for higher energy conversion efficiency. 2

18 Figure 1.2. The schematic diagram of traditional thermal power station. 3 In contrast to the lengthy and inefficient four step conversion process used in power stations, fuel cell research has depicted a more direct pathway, one with a simpler operating process to convert chemical energy into electricity with emissions of only water or with small amount of nearly pure CO2. 5 Fuel cell technology provides great potential in the area of high-efficiency fossil fuel conversion. Therefore, compared to the traditional fossil fuel thermal power generation process, the use of fuel cells and electrochemical processes provide a cleaner energy producing technology which focuses on the improvement of energy generation efficiency and fossil fuel consumption reduction Fuel Cells and SOFC A fuel cell is a device that uses electrochemical processes to directly convert chemical energy into electricity. This process is also done in a manner that provides significant environmental advantages with regard to the low pollutant and GHG emission aspects. 6,7 Nowadays, different types of fuel cells are developed based on the same operating principle as shown in Figure 1.3. In a fuel cell system, the fuel electrode (anode) contains a porous electrode where the oxidation of the fuel gas occurred. Oxygen (from the air) comes into contact with the air electrode (cathode), which undergoes reduction processes to form oxide ions. Protons or oxide ions are transported through the electronically insulating electrolyte. 3

19 Water is produced as the final product of the reaction and electricity is generated by the flow of electrons that is delivered to the external circuit. 7 The reaction equations are listed as equations 1 and 2. Figure 1.3. The schematic diagram of the fuel cell operating principle. 7 H 2 + O 2 H 2 O + 2e (1) (Anode) O 2 + 4e 2O 2 (2) (Cathode) The five main types of fuel cell are shown in Table 1.1. These fuel cells are classified based on the different types of materials used for the ionic conductors, the electrolyte. 6 The alkaline fuel cell (AFC) conducts OH - ions from the cathode to the anode using a strong alkaline solution (sodium/potassium hydroxide Na/KOH) as the electrolyte. AFC s, the oldest type of fuel cell technology, require very pure hydrogen as the fuel source and air/pure oxygen as the oxidant. Phosphoric acid fuel cells (PAFC) use a concentrated phosphoric solution to conduct H + with hydrogen or syngas as the fuel. Polymer electrolyte membrane (PEM) fuel cells, also known as the proton exchange fuel cells and solid polymer fuel cells are operating based on the proton conducting membrane electrolyte to transfer H + from anode to cathode. In this case, only pure hydrogen is considered as the proper fuel source. In the case of molten carbonate fuel cells (MCFC), a molten potassium 4
20 lithium carbonate electrolyte is applied to conduct CO3 2- from the cathode to the anode. Syngas is considered to be a suitable fuel for MCFC. Finally, the SOFC utilizes hydrogen from hydrocarbons at the anode and oxygen from air at the cathode to produce electricity. SOFC has the highest operating temperature compared to other fuel cells as ceramics are selected as the electrolyte. Both the ion and proton conductor electrolytes are investigated for SOFC. 7 Table 1.1. Five main types of fuel cell. 7 Fuel Cell Electrolyte Operating Temperature (ºC) Alkaline (AFC) Sodium/ Potassium Hydroxide 70 Phosphoric Acid (PAFC) Phosphoric Acid 200 Polymer Electrolyte Membrane(PEM) Polymer Membrane 80 Molten Carbonate (MCFC) Molten Salt 650 Solid Oxide (SOFC) Ceramic The SOFC has been considered the most efficient power generating fuel cell with an efficiency of up to 70% and an additional 20% which can be recovered from heat. Unlike other fuel cells, SOFC has the most flexible choice of fuels and can generate electricity from many carbon-based fuels such as syngas and natural gas. 6 Moreover, the high temperature operating conditions of SOFC provide a suitable environment for the internal anode reforming process to take place, Additionally, the high temperatures also allow for rapid electrocatalysis of hydrocarbon oxidation with the use of non-precious metals, which has effectively increased the overall electrical efficiency of the system. 8 Therefore, the SOFC in the study can be a potential solution for the current low efficiency fossil thermal 5
21 power generation system. In addition, companies like Bloom Energy in the U.S., California, has already investigated the applications, such as the Bloom's Energy Server to bring the fuel cell technology into real life. The Bloom's Energy Server is a new class of power generator based on SOFC technology that can generate about 200kW of power per unit server in roughly the footprint of a standard parking space. 9 Unfortunately, the current technology for SOFC is still not mature enough for large scale applications. Limitations are mainly caused by the complex fabrication processes for electrode materials, reduced cell lifetime due to the high operating temperature and the use of expensive ceramics and metals for the cell. 6 More investigations are still need to be done based on these challenges for the industrialization process of SOFC in the future. 1.3 Thesis Objectives and Contents The objective of this thesis is to (a) investigate a promising electrode material that has excellent stability under various fuel gas atmosphere at a high operating temperature and good electrochemical catalytic activity for the conversion process of SOFC, (b) to understand the cell performance and the mechanism of degradation of the cell during operation. Chapter 2 describes the main principles behind the performance of SOFC and summarizes the proper anode materials based on the different properties required from the operating principle. The experiment methodology, including the synthesis of materials, the detailed experimental procedure, fuel cell set-up, electrochemical tests and characterization methods are described in Chapter 3. Chapter 4 is mainly focused on the characterization results and electrochemical performance and discussion. Conclusions and future work are presented in Chapter 5. 6
22 Chapter 2 Literature Review 2.1 Thermodynamics of SOFC The electrochemical reaction that occurs in SOFC can be represented through the fundamental rules of thermodynamics in terms of power output and maximum voltage. The maximum electrical work (W) can be performed by the negative value of the change in Gibbs free energy (ΔG): W = G (3) where the reversible voltage can be shown as: E = W nf = G nf (4) where E is the reversible voltage, n is the mole of electrons transferring during the reaction, and F is Faraday s constant. The SOFC reaction with H2 gas as fuel is: 1 2 O 2 + H 2 = H 2 O (5) The reversible voltage can be calculated by Nernst Equation: E = G 2F = E0 RT ln p H 2O 1 2F p H 2 (p O2 ) 2 (6) where E 0 is the standard reversible voltage, R is the universal gas constant, ph2o, ph2, and po2 are the partial pressures of the steam, hydrogen and oxygen, respectively. 2.2 Cells Performance and Polarizations The performance of an SOFC is often described by its voltage-current (j-v) relationship, as shown in Fig Compared to the ideal thermodynamic cell voltage the real voltage 7
23 produced by SOFC is decreased substantially by several unavoidable losses. The measured open circuit voltage (OCV) of the cell is lower than the theoretical reversible voltage due to the internal electrical short circuiting from the small electronic conductivity of the electrolyte, and the leakage of fuel gases. Activation polarization (η act ) occurs at lower current density range that is mainly due to the loss in the electrochemical reaction. Ohmic loss (η ohmic ) determines the performance at the midrange current density region which depends on the ionic and electronic conductivity of the cell. In addition, in the high current region, concentration polarization (η conc ) dominates and leads to a precipitous drop of the voltage for SOFC. Figure 2.1. Typical j-v performance of a SOFC. 10 Therefore, the real voltage produced by the SOFC can be expressed as equation (7) as shown below. These losses reduce the SOFC energy utilization rate in the cell reaction process. Thus, to improve the cell performance, it is critical to reduce the resistance of the cell, and accelerate the electrochemical reaction rate and mass transport rate of reactants and products. Therefore, it is necessary to study the ionic and electronic conductivity, electrochemical catalytic activity and porosity of the cell material. 8

24 V = OCV η act η ohmic η conc (7) 2.3 Triple Phase Boundary Due to the fact that the reactions for SOFC involve ions, electrons and the gas phase molecules that come from three different phases, the interphases of the electrode material and the electrolyte material with the gas phase play a significant role in the overall cell performance, which is described as the triple phase boundary (TPB). 11 Figure 2.2 shows a simple schematic diagram for the TPBs. As shown in the diagram, the existence of TPBs provides the pathways for the ions, electrons and gas molecules to meet and react, the electrochemical reaction will only occur at the TPBs. Thus, the TPBs are also named as the active sites or reaction sites. As the result, with the important implications of the TPBs, a highly porous nano-structured electrode material is always demanded for the gaseous diffusion purpose and the intimate contact between the gas, electrode, and the electrolyte. Figure 2.2. The schematic diagram for triple phase boundaries. 12 9
25 2.4 Electrolyte Materials Oxygen ion conductive electrolyte is considered as the preferable material for this research. The electrolyte layer has multi functions in an SOFC. The main requirements for the electrolyte are to separate the fuel gas and air from the fuel electrode and the oxygen electrode, respectively, as well as to provide enough ionic conductivity for the oxygen ion conducting electrolyte while preventing the conduction of the electrons from electrodes. Over last two decades, the yttria stabilized zirconia (YSZ) electrolyte has been mainly developed for the high temperature fuel cell operations, which has turned the material YSZ into one of the most popular candidates for SOFC electrolytes. Previous studies on YSZ has shown its extraordinary ionic conductivity and negligible electronic conductivity with superb stability under both of the oxidizing and reducing environments. 13,14 These properties of YSZ make it exactly the electrolyte material people are looking for in an SOFC. Thus, YSZ is also selected as the electrolyte material for this research. Besides YSZ, other materials like ceria (CeO2) based materials are receiving more attention recently due to their higher ionic conductivity than YSZ. However, these kinds of materials are prone to have the electronic conductivity at the low oxygen partial pressure atmosphere, especially in the reducing fuel environment. Hence, this limitation constrains their development in practical SOFCs. 14, The Oxygen Electrode Materials The oxygen electrode is the place where the oxygen reduction in SOFC happens. Air is often fed to the oxygen electrode and oxygen in the air reacts on the electrode; hence oxygen electrode is also as known as the air electrode. For SOFC, oxygen diffuses through 10
26 the porous cathode electrode to the TPB that gets driven through a reduction reaction to become oxygen ions that transport through the electrolyte to the anode side. A satisfactory oxygen electrode material is expected to have high catalytic activity, sufficient electronic and ionic conductivities, excellent porosity for gas diffusion to the TPBs, and good stabilities to withstand the high operating temperature and the high oxygen partial pressure. Noble metal catalysts have been considered as suitable air electrode materials due to their high conductivities, especially platinum, Pt. However, due to the high cost of noble metals, Pt is not considered as a potential candidate for oxygen electrode in this research. Metal oxides with good conductivities are concerned as alternatives to Pt for the air electrode. 16 Perovskite-based materials have been found as the most adaptive choice for applications related to oxygen evolution reactions. The strontium-doped lanthanum manganite oxide (LSM) is a typical oxygen electrode material as a composite of LSM/YSZ. This composite provides reasonable catalytic activity as well as good stability and conductivity under different oxygen partial pressures. 17 Recently, strontium doped lanthanum ferrite oxide with partial substitution of cobalt (LSCF) has been proposed as an alternative oxygen electrode for SOFC. It has demonstrated much improved electrochemical catalytic activity than the composite of LSM/YSZ. 18 Due to the poor compatibility between the LSCF and YSZ, a barrier layer of gadolinium-doped ceria (GDC, also known as CGO) is often applied between the LSCF-YSZ interfaces to prevent further side reactions. Even though the interlayer sintered between the GDC and YSZ electrolyte shows a lower ionic conductivity than YSZ itself 19, investigations still have stated that the composite of LSCF-GDC is electrochemically more stable than LSM-YSZ with higher performances. 20 Therefore, in this research, the LSCF-GDC composite is selected to be the oxygen electrode. 11
27 2.6 Fuel Electrode Materials The fuel electrode plays an important role in SOFC applications since the electrochemical oxidation of the fuel gas processes occur at the anode side of the SOFC. The reaction rates of the fuel gas are considered as the rate-determining steps for SOFC that can directly affect the overall conversion efficiency of the cells. Thus, fuel electrodes are usually required to have high catalytic activities, good conductivities, good porosity for gas diffusion processes, and chemical and mechanical compatibilities with electrolytes and interconnectors. Moreover, the fuel electrode usually gets directly contacted with various fuel gases that have different characteristics. Therefore, excellent chemical and mechanical stabilities under different fuel gas atmospheres and redox treatments are especially essential for the selection of fuel electrode materials Ni-YSZ and Existing Limitations The noble metal Pt has been proven as a good electrode material with high conductivities, however, the transition metal, Ni has an even better performance than Pt as a fuel electrode material over 700 C. 20 Thus, a conventional design of composite Ni-YSZ cermet has been most investigated for the use of the SOFC fuel electrode. This composition provides excellent ionic conductivity through YSZ and sensational electronic conductivity and catalytic activity by Ni particles. 21 As the Ni-YSZ gets tested under increasing amount of applications with various conditions, some severe limitations and problems for the Ni-YSZ composite have occurred. a. The Ni-YSZ has a strong tendency to promote carbon deposition under the fuel gas environment of syngas (CO&H2) and hydrocarbons for SOFC (can be detected by SEM). 22 As expressed in Figure 2.3, Ni and YSZ particles with a size of 1 to 2 µm have formed large amount of cokes within their structure after only 4 hours of 12

28 operation at 600 C that have blocked lots of apparent TPBs and degraded the overall performance. As well, the formed cokes even get dissolved into Ni particles and eventually destroy the Ni-YSZ structure at over 800 C. 22 Figure 2.3. the SEM image of fresh Ni-YSZ a) Ni-YSZ after carbon deposition in methane (CH4) for 4 hour at 600 C (873K) b) and 800 C (1073K) c). 22 b. For the reason of carbon deposition and oxidation of the catalytically active particle Ni, redox treatment for fuel electrode recovery is necessary for long-lasting operation. During the redox process, the deposited carbon can be oxidized into CO2 and the NiO will be reduced as Ni to be recovered. Nevertheless, the Ni-YSZ composite possesses an inferior stability under redox cycling; the phase change of large size of Ni particles (1 to 2 µm) leads to a significant volume change of the microstructure during the redox process, from Ni to NiO to Ni, that will destroy the microstructure and eventually the cell Perovskite Oxide Based Material An alternative candidate for the fuel electrode for an SOFC is perovskite oxide. The perovskite oxide has an excellent thermal and mechanical stability under high temperature operating conditions, as well as good compatibility with the electrolyte material YSZ. Such 13
 that encompasses a variety of different components with very different properties.")
29 unique properties of the perovskite oxide bring it more possibilities for electrochemical applications. 24 Perovskite oxide is the metal oxide with a cubic lattice structure of ABO3 (Figure 2.4) that encompasses a variety of different components with very different properties. 25 Generally speaking, the A sites are occupied by the large (lower valent) cations: alkali, alkaline earth or rare earth metals with 12-coordination number in the periodic table, such as La, Sr, Ca and Pt, while the small cations at B sites come from transition metal ions with higher valent with 6-coordination numbers, such as Ti, Ni, Fe and Co. 25,24 As indicated in Figure a), the B atom is at the center of an octahedral lattice formed by 6 oxygen atoms surrounding it and connected to one another; meanwhile each A atom is arranged at the site with 8 octahedra surrounding it (Figure 2.4 b). The relation between the radii of A, B and O 2- for the ideal cubic structure is shown as equation 8, where ra,rb and ro are the radii of A,B and O 2- respectively. 24 r A + r o = 2 (r B + r O ) (8) Figure 2.4. Crystal structure of perovskite oxide centered at a) B site atom, b) A site atom
30 Due to the complexity of perovskite oxides that various cations can be substituted at the sites, various levels of distortion of the structure can be expected. The Goldschmidt's tolerance factor describes the stability and distortion of the crystal structure as expressed by equation 9. The t value equals 1 when the perovskite is in the ideal cubic structure, and as t decreases, the unit lattice is shifting into triclinic by increasing distortion and losing stability. A stable structure of perovskite oxide is expected to have a t value between 1 and Based on the different properties revealed by different combinations of A&B site atoms, perovskite oxides can be widely applied on different areas of SOFC. The typical applications of perovskite oxides are listed in Table t = r A +r o 2(r B +r o ) (9) Table 2.1. Typical perovskite oxide applications for solid oxide cells. 24 Component Perovskite Oxide Oxide Electrode La(Sr)MnO3-δ, La(Sr)CoO3-δ, Sm0.5Sr0.5CoO3-δ, La(Sr)Fe(Co)O3-δ Electrolyte La(Sr)Ga(Mg)O3-δ (O 2- ), BaCeO3-δ (H + ), BaZrO3-δ (H + ), SrZrO3-δ (H + ) Fuel electrode La1-xSrxCr1-yMyO3-δ (M= Fe, Co, Ni), SrTiO3-δ Interconnector La(Ca)CrO3-δ 15
31 Lanthanum Chromite Perovskite Oxide The pure lanthanum chromite perovskite oxide, LaCrO3-δ, is a p-type pure electron conductor with low electronic conductivity. However, LaCrO3-δ has a tolerance factor of 0.97, which results in superb chemical, mechanical and thermodynamic stability. 24, 27 By doping alkaline earth (AE) elements at A site, La1 xmxcro3-δ (M=Ca, Sr) becomes a good electronic conductor with enhanced ionic conductivity, which is often used as the interconnect of the SOFC (Table 2.1). Doping of the bivalent element Sr or Ca at the A site not only leads to Cr 3+ to Cr 4+ transition that creates more electronic holes in the valence band and thus improves the electronic conductivity, but also creates oxygen vacancies that give rise to ionic conductivity by charge compensation. 28 In addition, since the Cr 3+ ion has strong capability to maintain a six-fold oxygen ion coordination under both oxidizing or reducing atmospheres, the electronic conductivity of the perovskite is maintained as much as possible under low oxygen partial pressure condition. 29,30 Moreover, Ca, Sr doped LaCrO3-δ has a great potential to be a fuel/oxygen electrode as well. Since LaCrO3-δ has well-known good stability during high temperature operation, the stabilities of LaSrCrO3-δ (LSC) and LaCaCrO3-δ (LCC) under oxidizing and reducing environments were tested by Sfeir. 31 This study illustrates that under the oxidizing condition, the Ca doped LaCrO3-δ, becomes much more stable than the Sr doped one, whereas in a reducing atmosphere, Sr doped LaCrO3-δ successfully preserved the perovskite phase while Ca has highly destabilized the structure Wet Impregnation and In-situ Exsolution LSC is a potential fuel electrode material with good stability, mechanical properties and conductivities, but it suffers from the problem of low catalytic activity. To solve this 16

32 problem, people are considering introducing other catalytically active metal nanoparticles like Ni or Co to incorporate them with the existing structure of LSC by wet impregnation (infiltration) or chemical deposition. The wet impregnation method is a well-known technique for the preparation of heterogeneous catalysts as well as applications to enhance anode/cathode performance for SOFC. 32 By infiltrating metallic catalyst solutions into the sintered porous perovskitebased skeleton, uniformly distributed metallic nanoparticles are expected to establish in the electrode and lead to the improvements in TPBs, electronic conductivity and catalytic activities as demonstrated in Figure However, the agglomeration phenomena of the nanoparticles have occurred during the long-term repeated sintering process after infiltration that has dramatically increased the particle sizes and its tendency for carbon deposition. Therefore, particle agglomeration has consequently decreased the amount of TPBs as well as the uniformity of the distribution and thus the cell stability and its overall performance. Figure 2.5. Schematic of typical wet infiltration method

33 Alternatively, the in-situ exsolution method has been investigated for this situation to achieve smaller sized, highly uniformly distributed nanoparticles on the electrode material with elevated carbon deposition resistance and improved electrochemical performance. 34,35 In-situ means at the original position. The main idea of in situ exsolution is to dissolve catalytic transition metals inside the perovskite structure (at B sites) and make it partially exsolve out of the lattice in a reducing atmosphere in order to form a highly uniform dispersed decoration of nanoparticles on the perovskite support. By comparing with the infiltration method in Figure 2.6, the unavoidably long cycling sintering process for impregnation is continuously promoting the agglomeration of nanoparticles, while in-situ exsolution can prevent it by only requiring one high temperature sintering for material fabrication from the original. Therefore, the agglomeration phenomena can be successfully reduced by the in-situ exsolution process. 28,36 Figure 2.6. Schematic of a) wet impregnation process, b) in-situ exsolution. 18
34 In-situ exsolution suggests an extraordinary pathway for catalytic particles of Ni, Co or Fe to partially substitute into the B-site of the LSC lattice to turn LSC into a potential anode material (fuel electrode) for SOFC as listed in Table 2.1. Doping of transition metals into B sites of LSC imparts both electron holes and oxygen vacancies into the structure as well as brings their high electronic conductivity, catalytic activity and a large amount of TPBs to the support material. Moreover, the in-situ doped nanoparticles even have demonstrated a fabulous carbon deposition resistance as well as thermal and redox stability compared with chemical infiltration during high temperature operation. 37 The lattice structure for chemical infiltration and in-situ exsolution is shown in Figure 2.7 that illustrates the exsolved particles are acting pinned into the lattice at its original position which expresses a promoting stability at the metal particle/oxide support interface instead of simply depositing the catalytic metals onto the bulk oxide. In the meantime, the morphological differences also affect the growing mechanism of carbon fibers by carbon deposition appearance as shown in Figure 2.8. Based on the study of Neagu et al 38, the carbon fiber growth on Ni particles is following the tip growth mechanism for deposited nanoparticles, that carbons get dissolved into the Ni lattice at first, then grow up at the metal/oxide interfaces to uplift the Ni particles from the in original places; thus it can destroy the structure and deactivate the cell. Nevertheless, due to the strong interactions between the exsolved socketed Ni particles and parent oxide support, the particle uplifting and subsequent carbon fiber growth are prevented. As the result, carbon fibers grow in a base growth mechanism that allows Ni particles to stay attached to the substrate while carbon fibers grow on top of it with considerably shorter length. Therefore, the in-situ exsolved particles are expected to maintain higher redox stability and better carbon deposition resistance during operation. 19
 chemical infiltration b) in situ redox")
35 Figure 2.7. Decoration catalyst particles M through a) chemical infiltration b) in situ redox exsolution. 38 Figure 2.8. Schematic of possible carbon fiber growth mechanisms
36 2.7 Bimetallic Nanoparticles Doping and Perovskite Non-stoichiometry In order to further improve the performance of doped LSC perovskite, bimetallic doping and perovskite non-stoichiometry, two aspects are concerned to boost carbon deposition resistance, in situ exsolution appearance and catalytic activity. Bimetallic doping is the idea to introduce a second metal (guest metal) to the host metal as a promoter to optimize the monometallic property. Metal alloys, especially Ni-alloys, were tested to have sufficient effects on the mitigation of inducing carbon into the structure that successfully suppressed formation of carbon fibers. 39 High catalytic Ni is selected as the host metal for the LSC support, and Co is concerned as the proper guest metal due to its good electrochemical activity and high tolerance of coking. 40 Grgicak et al. 41 have studied the comparison of Ni-Co alloy compared to single Ni metal; the result shows that Ni-Co alloy can successfully decrease the exsolved particle sizes and increase the total surface area and TPBs. Ni-Co alloy expresses highly stable activity and promotes electrochemical activity under carbon containing environment over a wide range of temperature (500 C to 900 C), which suggests the combination of Ni and Co can indeed prevent the deactivation phenomena by carbon deposition. 40,41 Different ratios of Ni/Co were tested by Takanabe et al. 40 from 0:100 to 100:0, and the results demonstrate that the catalytic activity gradually increases with increased Ni content, while the coke resistance rises with the amount of Co content. Therefore, a proper ratio of Ni and Co needs to be considered for the tradeoff between reaction activity and coking resistance. Most of the in-situ exsolution studies are focusing on the stoichiometric perovskite oxide ABO3 with the ratio of A/B=1, which actually limits the reducible metal to exsolve out that also restricts the overall performance. Recent investigations have indicated the in-situ 21
37 exsolution of nanoparticles can be enhanced by controlling the non-stoichiometry of perovskite oxide. 42 By adjusting the perovskite to A/B<1, more cations from B sites will be thermodynamically favored to exsolve out on the surface. The A, O site deficiency may cause an unstable perovskite oxide structure, thus creating a spontaneous tendency for B site exsolution to revert the perovskite to a stable, defect free structure. Hence, A-site deficiency is suggested as a new pathway to better decorate the nanoparticles on the oxide surface with more coverage area on the support. 22
38 Chapter 3 Experiment Methodology 3.1 Synthesis of Cell Materials Sol-Gel Combustion Method The citrate sol-gel combustion method is the main method applied in the experiment for sample fabrication. Sol-gel combustion method is an improved wet chemical method to synthesize nanoparticles with fine homogeneity and lower sintering temperature. It has several advantages such as high purity, good stoichiometric control, ultra-homogeneity with a narrow size distribution, and relatively low processing time and temperature. 43,44 The sol-gel combustion method is also a type of citric acid & ethylene diamine tetra acetic acid (EDTA) complexing combustion method. As demonstrated by Figure 3.1, the precursor powder is formed by stoichiometric amounts of metal nitrates being dissolved in deionized water with both citric acid and EDTA as co-chelating agents. The metal nitrate and citric acid molar ratio are 1.5:1 while becomes 1:1 for EDTA and metal nitrate. The ph value of the solution is adjusted to 7 to 8 using ammonium hydroxide for a better chelating result. Then the solution is stirred and heated at 80 ºC until the gel is formed. The gel is heated to 300 ºC rapidly and kept for 30 minutes to an hour so that an auto combustion process of the gel will take place to form precursor powder (as-prepared powder). The precursor powders then are ready to be sintered at elevated temperature to form the single phase of targeted perovskite oxide. 23

39 Figure 3.1. Material fabrication flow chart by sol-gel combustion method Experimental Procedure of Electrode Fabrication The main fuel electrode material for this experiment was designed to be 3:1 (molar ratio) Ni-Co bimetallic doped A-site deficient LSC perovskites and be fabricated by in-situ exsolution process. Different bimetallic doping ratios and both A-site deficient and nondeficient perovskites were fabricated and their characteristics were measured. The electrochemical performances of selected cells were tested and compared for SOFC processes. As mentioned before, the fuel electrodes were fabricated from mixing the stoichiometric amounts of metal nitrates: lanthanum (III) nitrate hexahydrate (La(NO3)3 6H2O), strontium nitrate anhydrous (Sr(NO3)2), chromium (III) nitrate nona hydrate (Cr(NO3)3 9H2O), nickel (II) nitrate hexahydrate (Ni(NO3)2 6H2O), and cobalt (II) nitrate hexahydrate 24
40 (Co(NO3)2 6H2O) by the sol-gel combustion method with critic acid monohydrate (C6H8O7 H2O) and ethylene diamine tetra acetic acid (EDTA) as the co-chelating agents and the ammonium hydroxide (NH4OH) solution was applied to balance the ph to 7~8. The solution was stirred and heated on a heating plate at 80 until the gel was formed. The gel was placed into a Thermolyne type 6000 furnace to be rapidly heated to 300 for combustion and the temperature was kept for an hour to finish the precursor powder formation. Then, the precursor powders were collected and milled, and placed into a MTI Type KSL-1700 furnace to be sintered at 1200 five hours to form a single phase LSC perovskite oxide. LSCF ((La0.60Sr0.40)0.95Co0.20Fe0.80O3-δ) from Fuel Cell Materials was used as the air electrode in this work Fabrication of Solid Oxide Cells The electrode ink is fabricated by mixing the electrode material powders with the electrode glue (in alpha-terpinol mixed with 10% polyethylene glycol) using a ball milling machine (Figure 3.2). Then the well-mixed electrode ink will be printed on each side of the electrolyte pellets by a screen printer as shown in Figure 3.3. The ink printed cell will be sintered at elevated temperature to form a compact contact between the electrode and electrolyte. After sintering, Au paste is painted on both sides of the cell as the electrode current collectors. 25
 and the electrode glue at the weight ratio of 1.5:1.5:1.7 in the milling machine for 2 hours.")
41 Figure 3.2. Schematic of Milling Machine. 45 Figure 3.3. Image of the screen printer and ink printed cell. Electrode ink was fabricated by thoroughly mixing the electrode powder, the GDC10 power (10% gadolinium doped) and the electrode glue at the weight ratio of 1.5:1.5:1.7 in the milling machine for 2 hours. The GDC buffer layers introduced at the electrode and electrolyte interfaces were made by mixing the GDC10 powder with the electrode glue at 1.7:3 weight ratios. Buffer layers were painted at the two sides of the electrolyte, the 25 mm diameter and 0.25 to 0.3mm thickness 8 mol% yttria doped YSZ substrate from Fuel 26
42 Cell Materials. Buffer layers were dried in an air-drying oven and sintered with the electrolyte at 1300 for 5 hours. Then fuel electrode ink was painted on one side of the buffer layer with the painting area of cm 2. After air drying the ink, the fuel electrode LSC was sintered at 1200 for 5 hours. The air electrode LSCF was painted last, on the other side of the buffer layer with the same area as the fuel electrode. Then the dried air electrode was sintered at 950 for 4 to 5 hours in the furnace to obtain good bonding between the electrode and electrolyte. Au paste was painted on both sides of the electrode as the current collector. 3.2 Electrochemical Test Setup for SOFC The well fabricated cells were placed in an electrochemical test setup as shown in Figure 3.4, to be ready for electrochemical performance tests. The fabricated cell is sealed on a coaxial alumina two-tube setup by a ceramic sealant (Ceramabond 552, Aremco Products) to separate air and fuel gas on both sides of the electrolyte. The current collectors for the two electrodes are connected to the electrochemical workstation (potentiostat) by 0.5 mm diameter silver wires with silver paste. Two volumetric flow meters are inserted into the system to regulate the flow rate of inlet gases, and the outlet gases flowing at the cathode and anode are removed from the system to carry away the generated products and thus allow the reaction to continue. Once the ceramic sealant is cured, the set up will be placed at elevated temperature on the Thermolyne tubular furnace untill it has risen to a certain operating temperature. The electrochemical workstation is used to measure and collect data and measure the produced power from SOFC operations. 27
43 Fuel Gas Fuel Gas Inlet F M Product Outlet A B C D E Potentiostat F M Air Outlet Air Air Inlet Legend: A&E: Current Collector B: Fuel Electrode C: Electrolyte D:Air Electrode FM: Volumetric Flow Meter Figure 3.4. Schematic Diagram for electrochemical performance test setup. 3.3 Characterization of the Catalyst Powder X-Ray Diffraction The phase formation of the catalyst is analyzed by powder X-Ray diffraction (XRD) by using a Rigaka D/max-2500 X-ray diffractometer with a Cu Kα radiation at room temperature and the data are analyzed through Jade and Xpert Highscore Plus Software. As well as identifying the phase formation of the material, lattice parameters, lattice defects and grain size of nanoparticles can also be identified by the XRD test. During the test process, the cleavage phase of sample crystals appears to reflect the X-ray beam at a certain angle of incidence, θ. When the incident X-ray beam has the wavelength of λ and the distance between the atomic layers of the crystal is represented by variable d, the X-ray 28
44 wave interface of a sample is described by Bragg s Law, equation 10, where n is an integer. 46 nλ = 2d sin θ (10) Scanning Electron Microscopy and Energy Dispersive X-ray Spectroscopy Scanning electron microscopy (SEM) is a powerful technique that produces images of the sample surface morphology by electron scanning. During the operation process, while a focused beam of electrons is scanning the surface, electrons will interact with sample atoms and produce various signals such as secondary electrons (SE) and backscattered electrons (BE) that contain the information about the surface image and compositions of the sample. 47 Gold or carbon coatings are usually required to be applied onto the sample surface to produce extra conductivity to the sample. Some SEM equipment also contains an energy dispersive X-ray spectroscopy (EDS) system to use x-ray fluorescence to specify the elemental compositions as well as detailed component concentrations. In this research, the microstructure and morphology of catalysts, cross section and surface images of cells as well as the material composition by EDS analysis are obtained at room temperature by Zeiss Sigma 300VP-FESEM equipment Thermogravimetric Analysis and Mass Spectrometry Thermogravimetric analysis (TGA) is a method of thermal analysis that can measure the changes in chemical and physical properties of the sample as a function of temperature and as a function of time. The sample s heat change and/or weight loss during the process are measured with a constant heating rate or constant operating temperature; thus it reveals the change in chemical phenomena of the sample including decomposition, dehydration, reduction and oxidation processes. The inlet pipe of the mass spectrometer (MS) is usually 29
45 connected with the gas outlet flow of the TGA to analyze the change of gas composition during the TGA operation as a function of time/temperature. MS provides an electromagnetic field inside that can characterize different mass and charge properties of ionized sample particles inside in order to identify the sample chemical compositions. In this research, TGA, SDT Q600 (TA instrument), is mainly applied for the metal nanoparticle exsolution and oxygen nonstoichiometric analysis as well as the temperature program oxidation (TPO) process with the MS measurement, thermostat QMS 200, at a heating rate of 10 ºC min -1 from room temperature to 900 ºC Gas Chromatography Gas chromatography (GC) is one of the most widely used techniques for analyzing the gas components without decomposition. The GC carrier gas, usually an inert gas, is the mobile phase and the immobilized polymeric liquid is usually applied as the stationary phase in the equipment. The carrier gas needs to be subsequently supplied from the inlet stream that continuously flows through the whole column and into the component detector. The sample gas is injected into the injection port and gets carried into the column by a carrier gas, and gets separated inside the column based on different solubility and relative vapor pressures of the components in the stationary and mobile phases. As the analytes pass into a detector with a carrier gas, their different physicochemical properties are detected and generated as electronic signals to measure the specified amount of different components present. 48 GC has a wide range of operating temperature from 5 C to 400 C, wide range of component detection and a good repeatability of the measurement. In this research, GC is mainly applied for the hydrogen-temperature program reduction (H2-TPR) analysis using a Hewlett Packard 5890 Series Ⅱ gas chromatograph. 30
46 3.4 Electrochemical Measurements The electrochemical performance test of this research is investigated by using the electrochemical workstation of a Solartron 1287 potentiostat and a Solartron 1255 frequency response analyzer Electrochemical Impedance Spectra Electrochemical impedance spectroscopy (EIS) is a technique that determines the energy storage and dissipation properties over a range of frequencies by measuring the impedance, which refers to the frequency dependent resistance to current flow of a circuit element. Impedance spectroscopy will impose a potential perturbation on the testing cell and then measure and collect the current output. Therefore, the impedance is described by the following equation (11), where Z ω, E ω and I ω are the frequency dependent resistance (impedance), frequency dependent potential and frequency dependent current, respectively. 49 Z ω = E ω /I ω (11) For solid oxide cells, the EIS process is essential for cell performance detailed analysis. It provides a significant pathway to distinguish the cell performance consequences from different losses and polarization processes. Figure 3.5 is a typical EIS diagram, Nyquist plot which is usually used for SOFC analysis. The x-axis and y-axis indicate the values of real impedance and imaginary impedance, respectively, and the frequency value decreases with increasing x-axis value. In general, three types of losses that contribute to the arcs appear in the diagram as the overpotential of the cell at a given current density. The first one is the ohmic losses, shown as the curve s first intercept with the x-axis, which is mainly contributed by the resistance of electrolyte material; resistances of electrode materials and interconnects also make minor effects. The activation polarization losses are caused by the 31
47 operating activities of the two electrode materials, which is expressed by the two large arcs at the high to middle range of the frequency. In the low-frequency range, the linear line is expressing the resistance domains due to mass transfer effects due to the diffusion difficulty. 50 A frequency range of 10 6 Hz to 1 Hz is applied in this experiment impedance spectra measurement with required AC perturbation. Figure 3.5 Schematic of a typical Nyquist plot for EIS analysis for SOFC Current Density-Voltage Curves The voltage (V) versus current density (j) curve is used to analyze the electrochemical performance of the cell by plotting the change in voltage-current relationship during the operation process, which is also called as the j-v curve. For SOFCs measurement, the j-v curve is usually measured at the potential dynamic mode whereby the workstation will control the various voltage values in the system and record the corresponding current density values. For SOFC tests, the voltage will vary within the range from OCV to zero at 5 millivolts per second (mvs -1 ) or 10 mvs -1 rates. After collecting the current density data with corresponding voltage values, the produced power density (P) from the SOFC will be acquired by multiplying voltage and current density values as shown in equation 32
48 12. For a standard j-v curve, the current density (ma/cm 2 ) is the x-axis and the voltage output (V) and power density (mw/cm 2 ) are the two y-axes on the diagram. In this experiment, the potential static mode is also applied for SOFC tests, that makes the cell operate under a constant voltage value and deducts the current stability performance as a function of time. Therefore, the stability test diagram will have the current density value on the y-axis and time will be the x-axis. P = Vj (12) 33
49 Chapter 4 Results and Discussion 4.1 Analyses of Fuel Electrode Materials The strontium doped lanthanum chromite based perovskite oxide was designed to be 30 mol% Sr doped at the A-site with 10 mol% La A-site deficiency and bimetallic B-site doping was designed to starts from 15 mol% based on the previous experiment results from our group. Thus, the first step of experimental designation for bimetallic doping ratios is shown in Table 4.1. Table 4.1. Designation of Bimetallic Doping Ratio Experiment. Abbreviation LSC-6315NiCo LSC-6312NiCo LSC-6309NiCo LSC-6306NiCo LSC-6303NiCo Composition (La0.6Sr0.3)(Cr0.85NiCo(3:1)0.15)O3-δ (La0.6Sr0.3)(Cr0.88NiCo(3:1)0.12)O3-δ (La0.6Sr0.3)(Cr0.91NiCo(3:1)0.09)O3-δ (La0.6Sr0.3)(Cr0.94NiCo(3:1)0.06)O3-δ (La0.6Sr0.3)(Cr0.97NiCo(3:1)0.03)O3-δ In order to successfully accomplish the in-situ exsolution process of doped active nanoparticles, the formation of the single phase (pure phase) LSC perovskite oxide structure after sintering is necessary. The phase structures of the synthesized materials were characterized by XRD with Cu Kα radiation scanned from 20º to 80º (2θ) at 2º per minute. The XRD patterns of freshly fabricated materials (Table 4.1) are shown in Figure
50 Intensity (a.u.) * LSC-Perovskite NiO * * * * * * LSC-6315NiCo * * * LSC-6312NiCo LSC-6309NiCo LSC-6306NiCo LSC-6303NiCo Theta (degree) Figure 4.1. Crystalline structures of LSC based perovskite with different bimetallic doping ratios: LSC-6315NiCo LSC-6312NiCo LSC-6309NiCo LSC-6306NiCo LSC- 6303NiCo. 35
51 The 9 starred (*) peaks around 2θ equals to 23º, 32º, 40º, 47º, 53º, 58º, 68º, 73º and 78º marked in the diagram are the peaks matches with the main LSC structure, which exhibits a perovskite structure with orthorhombic phase unit cells. As revealed in the figure, LSC- 6309NiCo, LSC-6306NiCo, and LSC-6303NiCo have shown the single-phase perovskite oxide in the XRD diagram, which means the B-site doping of the A-site deficient LSC base does not have any influence on the crystalline structure of the perovskite oxide. However, the diffraction peaks at around 2θ equal to 37º, 43º and 63º, the dot ( ) marked peaks, were detected for both LSC-6315NiCo and LSC-6312NiCo perovskite oxides. These peaks are the main peaks for the nickel oxide (NiO) phase (reference code ); thus the appearance of these peaks represents the formation of NiO phase in the sample materials. The formation of NiO indicated the doping saturation of pure phase LSC perovskites with 15 mol% and 12 mol% of bi-metal doping into B-site positions of LSC base. As the result, in this experiment, the limitation of B-site doping ratio for A-site deficient LSC perovskite oxide is determined as up to 9 mol%. The change of tolerance factor t is a possible reason that affects the transition metals doping limitations. The B-site doped Ni and Co increase the B-site ionic radius that decreases the tolerance factor t and decreases the structure stability. Based on the maximum doping limitation obtained from Figure 4.1, different compositions of fuel electrodes were fabricated, which were the B-site bimetallic doped A-site deficient perovskite oxide, B-site monometallic doped A-site deficient perovskite oxide, and the B- site bimetallic doped non-deficient perovskite oxide, as listed in Table
52 Table 4.2. Designation of fuel electrode compositions. Abbreviation LSC-6309NiCo LSC-6309Ni LSC-7309NiCo Composition (La0.6Sr0.3)(Cr0.91NiCo(3:1)0.09)O3-δ (La0.6Sr0.3)(Cr0.91Ni0.09)O3-δ (La0.7Sr0.3)(Cr0.91NiCo(3:1)0.09)O3-δ The phase structures of these materials were also characterized by XRD with Cu Kα radiation scanned from 20º to 80º (2θ) at 2º per minute. The XRD results are shown below in Figure 4.2. Figure 4.2 a) is the general XRD diagram for perovskite oxides (La0.6Sr0.3) (Cr0.91NiCo (3:1)0.09) O3-δ (LSC-6309NiCo), (La0.6Sr0.3) (Cr0.91Ni0.09) O3-δ (LSC-6309Ni), and (La0.7Sr0.3) (Cr0.91NiCo (3:1)0.09) O3-δ (LSC-7309NiCO) respectively. Figure 4.2 (b) is the detailed peak positions of the 32 main peak for LSC-6309NiCo, LSC-6309Ni and LSC-7309NiCo, respectively. 37
53 Intensity (a.u.) Intensity(a.u.) * * * * LSC-Perovskite (104) LSC-6309NiCo * * * * * * * LSC-6309NiCo LSC-6309Ni (104) * (104) * LSC-6309Ni LSC-7309NiCo LSC-7309NiCo Theta (degree) 2-Theta (degree) Figure 4.2. XRD diagram for perovskite oxide LSC-6309NiCo LSC-6309Ni and LSC- 7309NiCo a) the general diagram for all peaks b) detailed positions for main peaks. As illustrated by the peaks in Figure 4.2 a), all of the LSC-6309NiCo, LSC-6309Ni and LSC-7309NiCo compositions had successfully formed the single phase of LSC perovskite oxide as marked by the stars (*). This result verifies the appropriate accommodation of the metal-substituted in the B-site of LSC perovskite base at 9 mol% for both chemical stoichiometry and non-stoichiometry situations as well as the bimetallic and monometallic doping situations. Moreover, some minor shifts in the structure could be identified by analyzing in detail the position of the XRD peaks. The highest intensity (main) peaks, (104) peaks, for LSC-6309NiCo, LSC-6309Ni and LSC-7309NiCo are expressed in Figure
54 b) to represent the peak shifting tendency. Even though the perovskite structure of doped LSCs presented in Figure 4.2 a) are in pure orthorhombic phase unit cells, the (104) peak of the unit cell had been shifted due to different doping compositions. The (104) peaks for LSC-6309NiCo, LSC-6309Ni and LSC-7309NiCo were at 32.75, 32.85, and (2θ), respectively. This slight shift of the peaks can be analyzed by the Bragg Law (equation 10). Since nλ = 2d sin θ, that with the nλ unchanged, the larger value of 2θ corresponds to a smaller value of d, which means smaller unit cell volumes. Thus, according to the Figure 4.2 b), LSC-6309Ni should have the smallest cell volume while LSC-7309NiCo has the largest. The changes of cell volume sizes for LSC-6309NiCo, LSC-6309Ni and LSC- 7309NiCo can be explained from the B-site substitutions and A-site non-stoichiometry. The ionic radii for 6-fold coordination B-site Cr 3+, Ni 2+ and Co 2+ are 0.615Å, 0.69Å and 0.745Å respectively. 51 Thus the bimetallic Ni-Co doping has increased the unit cell volume compared to single Ni doping. Also, the decrease of the unit cell volume of LSC-6309NiCo compared with LSC-7309NiCo is mainly caused by the A-site cation non-stoichiometry, which is in agreement with the literature results of A. V. Kovalevsky et al In-situ Exsolution Analysis With the doping of Ni-Co metal at the B-site of LSC, the in-situ exsolution phenomena are expected to occur during the reduction process by H2. The in-situ exsolved nano metal particles are the key points for improving the LSC electrochemical catalytic activity. With in-situ exsolution, the metallic particles are expected to be small in size (nanoscale) and uniformly decorated on the surface of the LSC base with metal phases. The mechanism of the exsolution of metal particles can be partially explained by the Gibbs free energy. The values of Gibbs free energy of the reduction reaction of each cation were calculated using HSC 6.0 software. Figure 4.3 depicts theoretical Gibbs free energies for different metal oxides that are involved in this experiment. Only Co3O4 and NiO shall be the reducible 39
55 G (kj/mol) element under the high temperature from 600 to 900 since only Co3O4 and NiO have contained negative Gibbs free energies. At 800, Co3O4 has a kJ Gibbs free energy and NiO has kJ, while all other elements have kept positive values. In addition, based on the value of Gibbs free energy, Co3O4 shall has a higher reducibility than NiO La M x O y +H 2 xm+yh 2 O Sr Cr At 600 At 700 At 800 At 900 Ni Co -400 La 2 O 3 SrO NiO Co 3 O 4 Cr 2 O 3 Figure 4.3. The theoretical value of Gibbs free energy for reduction of each element oxide in LSC-6309NiCo perovskite at 600 C to 800 C. The exsolved Ni and Co metallic particles are expected to form a solid solution as Ni-Co alloy phase during the reduction process. Theoretically, it is known that Co and Ni are adjacent to each other in the periodic table that satisfies the Hume-Rothery rule 53 which indicates they can easily form a solid solution phase (alloy) with various ratios. Ni and Co. The Ni-Co phase diagram in Figure also indicates this point. As shown in the phase 40
56 diagram, the Ni-Co alloy could be formed at any composition at the experimental temperature of 850. Thus, it is tentatively suggested that the formation of Ni-Co alloy during the exsolution process in this experiment is favorable. Figure 4.4. Ni-Co alloy phase diagram XRD Results Analysis After successfully fabricating the bimetallic doping perovskite oxide electrodes, these electrodes were placed into the MTI-type GSL 1100X tube furnace to be reduced at 800 for 3 hours with 5%H2/N2 reducing atmosphere. The doped nano metal particles should be in-situ exsolved out of the bulk LSC and get uniformly dispersed on the surface. In this experiment, characterization of the in-situ exsolved nanoparticles were examined by XRD, TPR TGA and SEM analysis. 41
57 The XRD diagram for reduced LSC-6309NiCo, LSC-6309Ni and LSC-7309NiCo, and their detailed exsolution peak positions are illustrated in Figure 4.5 a), b) and c). All of LSC-6309NiCo LSC-6309Ni and LSC-7309NiCo have successfully maintained the main LSC structure after the high temperature reduction process as indicated by star marked peaks in the diagram. The diffraction peak at 2θ equals to 44.6 has been detected for LSC- 6309Ni. This peak agrees with the theoretical XRD position for pure metal Ni at 2θ equals (reference number ), which confirms the metallic nanoparticles in-situ exsolution process. In addition, a clear diffraction peak at 2θ equals to ~44.5 has been detected for both R-LSC-6309NiCo and R-LSC-7309NiCo perovskites in Figure 4.5 b) & c). These peaks are believed to be the in-situ exsolved Ni-Co alloy phase from the perovskite because this position is exactly in between the main peaks of metallic Ni and Co, which are at 2θ equals and , respectively, with 100% intensity. By overlapping the diffraction peaks for LSC-6309NiCo, LSC-6309Ni and LSC-7309NiCo in Figure 4.5 c), the peak shifting tendency from Ni to Ni-Co alloy is clearly exhibited. The exsolution peak for chemically stoichiometric LSC-7309NiCo in Figure 4.5 c) is not distinct enough due to the lack of exsolution from A-site deficiency. The diffraction peak for LSC-6309NiCo has clearly shifted toward the left compared with the one for LSC- 6309Ni in Figure 4.5 c), which are at 44.5 and 44.6 (2θ) respectively. As mentioned before, this bias is likely caused by the existence of the Ni-Co alloy phase instead of pure metal Ni phase exsolved from the perovskite structure during the exsolution process. 42
58 Intensity(a.u.) Intensity(a.u.) a) * * LSC-Perovskite Ni-Co Alloy Ni particle * * * * * R-LSC-6309NiCo * * * R-LSC-6309Ni R-LSC-7309NiCo Theta(degree) b) Ni-Co Alloy Ni particle R-LSC-6309NiCo R-LSC-6309Ni R-LSC-7309NiCo Theta(degree) 43
59 Intensity (a.u.) c) R-LSC-6309Ni R-LSC-6309NiCo R-LSC-7309NiCo Theta(degree) Figure 4.5. a) XRD diagram for reduced LSC-6309NiCo LSC-6309Ni LSC-7309NiCo b) specified diagram for exsolution peaks c) overlapping of exsolution peaks. The XRD diagram for reduced LSC-6309NiCo, LSC-6306NiCo and LSC-6303NiCo electrodes and their detailed metal exsolution peaks are revealed by Figure 4.6 a) and b), respectively. Similar to the LSC-6309NiCo perovskite, both LSC-6306NiCo and LSC- 6303NiCo perovskites are in stable LSC base structures that have been perfectly maintained under the high temperature reduction atmosphere. LSC-6306NiCo has a clear diffraction peak at 2θ equals to 44.5, which is at the same position as the LSC-6309NiCo s diffraction peak in Figure 4.6 a) & b). This peak is considered as the in-situ exsolved Ni- Co alloy phase from the perovskite; as discussed before measured peaks are slightly shifted towards the lower degrees of 2θ compared with pure Ni metal due to the generation of Ni- Co alloy. LSC-6303NiCo perovskite does not likely have any obvious exsolution peak 44
60 Intensity (a.u.) Intensity (a.u.) through XRD, which might be caused by the low doping amount of Ni and Co into the structure. a) * * LSC-Perovskite Ni-Co Alloy R-LSC-6309NiCo * * * * * * * * R-LSC-6306NiCo R-LSC-6303NiCo Theta (degree) b) Ni-Co Alloy R-LSC-6309NiCo Ni-Co Alloy R-LSC-6306NiCo R-LSC-6303NiCo Theta (degree) Figure 4.6. a) XRD diagram for reduced LSC-6309NiCo LSC-6306NiCo LSC- 6303NiCo b) specified diagram for Ni-Co alloy peaks. 45
61 Intensity(a.u.) TPR Results Analysis To investigate the reducibility of this series of bimetallic doped A-site deficient LSC perovskite oxides and the synergistic effect between Co and Ni, hydrogen temperature programmed reduction (H2-TPR) tests were carried out, and the corresponding results are plotted in Figure 4.7. This technology was achieved by an AutoChem II 2920 instrument (Micromeritics, USA) equipped with a thermal conductivity detector. All samples were treated with helium at 1000 C for 30 min before H2-TPR. The flow rate for this analysis was 10% H2/Ar at 10 ml per minute, and the temperature ramping rate was 10 C per minute. LSC-6309NiCo LSC-6309Ni LSC-7309NiCo LSC Temperature ( C) Figure 4.7. H2-TPR curves of the fresh LSC, LSC-6309NiCo, LSC-6309Ni, and LSC- 7309NiCo. 46
62 There is no obvious peak that occurred in the pattern of LSC perovskite oxide as denoted in Figure 4.7. This result indicates that La0.7Sr0.3CrO3-δ might not have exsolved nanoparticles in a reducing atmosphere with increasing temperature. This result is consistent with the Gibbs free energy diagram as mentioned before. Doping of active metals Ni and Co has made a great improvement on LSC s reducibility. Clear H2 consumption peaks are observed for both LSC-6309NiCo and LSC-6309Ni (Figure 4.7) compositions, which show multiple peaks of different Ni/Co states. The curve of LSC- 6309Ni has two clear H2 consumption peaks at 470 C and 530 C. Based on previous studies 55,56, the first peak (α peak) of LSC-6309Ni indicates the reduction of Ni ions from Ni 3+ to Ni 2+ (around 500 C), while the second peak (β peak) represents the reduction from Ni 2+ to metallic Ni 0 (before 600 C). The Ni 2+ to Ni 0 transformation consumes the highest amount of hydrogen that can be confirmed from the intensity of the β peak. LSC-6309Ni had a third small peak at around 570 C, which is considered to be the LSC structure H2 consumption peak. The Co doping effect on reducibility is analyzed based on the different peak shapes between LSC-6309NiCo and LSC-6309Ni. The LSC-6309NiCo material has a similar shape of α peak at 470 C, but with a much lower β peak at 510 C. This phenomenon indicates that the formation of the Ni Co solutions significantly changes the reduction behavior of Ni oxide. A previous study indicated that the main H2-TPR peak for Co3O4 occurs at 433 C, which just overlapped with α peak of Ni. 57 That can also explain the wider range of α peak in LSC-6309NiCo than LSC-6309Ni. The β peak for LSC- 6309NiCo has moved to a lower temperature and got partially merged with the α peak. With the help of XRD results for metal exsolution of reduced samples, the exsolution process of Ni-Co alloy can be inferred as having similar reducibility with Ni metal but requires a lower temperature. The LSC-7309NiCo has α peak at around 500 C, and a really weak β peak before 600 C. This result means that the exsolution process of LSC-7309NiCo 47
63 requires higher energy than LSC-6309NiCo for both Ni 3+ to Ni 2+ and Ni 2+ to Ni 0 transformations. In addition, the weak β peak in the LSC-7309NiCo curve has verified the small number of nanoparticles exsolved out of the surface, which fits the result indicated by XRD in Figure 4.5. In conclusion, this TPR result clearly indicates that the addition of the second metal Co can significantly manipulate the reduction behavior of Ni nanoparticles. Also, the existence of A-site deficiency could facilitate the reduction of Ni 2+ to metallic Ni to generate more Ni-Co nanoparticles. The results of H2-TPR for LSC-6306NiCo and LSC-6303NiCo are plotted in Figure 4.8; LSC and LSC-6309NiCo curves are provided for comparison purposes. LSC-6306NiCo TPR curve is observed to have almost the same pattern as the LSC-6309NiCo curve that the α peak is merged with the β peak at a temperature of 470 C and 510 C, respectively. LSC-6303NiCo has a strong α peak at 470 C but no clear β peak at a higher temperature. This result indicates that most of the hydrogen-consuming process for LSC-6303NiCo is about the Ni 3+ to Ni 2+ transformation but not too much for metallic phase formation. This is due to the small bimetallic doping amount for LSC-6303NiCo, and the low exsolution amount agrees with the XRD peaks of reduced LSC-6309NiCo in Figure
64 Intensity (a.u.) LSC-6309NiCo LSC-6306NiCo LSC-6303NiCo Temperature ( C) LSC Figure 4.8. H2-TPR curves of the fresh LSC, LSC-6309NiCo, LSC-6306NiCo, and LSC-6303NiCo TGA Results Analysis As the in-situ exsolution of metal oxides causes the metal ions to be reduced at the bulk surface, some correlated lattice oxygen ions escape from the LSC perovskite oxide as well. The shortage of oxygen ions has introduced fair amount of oxygen vacancies (δ) into the structure. Oxygen vacancies play a significant role in the ionic conductivity and electrochemical catalytic activity of a perovskite material. In this experiment, the TGA was performed to measure the material weight losses of the materials with increasing of temperature in the reducing atmosphere. As stated by previous studies, the primary weight loss in the curve is due to the formation of oxygen vacancies. 52,58,59 The TGA was operated for different materials from 100 C to 850 C at a heating rate of 20 C per minute in 5% H2/N2. The TGA diagram for LSC-6303NiCo, LSC-6306NiCo, and LSC-6309NiCo are 49
65 Weight Percentage (%) Weight Percentage (%) depicted in Figure 4.9 a). Figure 4.9 b) contains the TGA curves for LSC-6309NiCo, LSC- 6309Ni, and LSC-7309NiCo a) TGA in 5% H % 1.84% LSC-6303NiCo 2.22% LSC-6306NiCo 97.5 LSC-6309NiCo Temperature ( C) b) LSC-6309NiCo LSC-7309NiCo 1.86% 2.22% % TGA in 5% H 2 LSC-6309Ni Temperature ( C) Figure 4.9. TGA diagram in 5%H2/N2 for a) LSC 6303NiCo, LSC-6306NiCo, and LSC-6309NiCo b) LSC-6309NiCo, LSC-6309Ni, and LSC-7309NiCo. 50
66 All the curves in Figure 4.9 a), LSC-6309NiCo, LSC-6306NiCo, and LSC-6303NiCo have shown three stages of change in the TGA diagram. The first stage is from 100 C to 380 C that all curves have gradual decreasing tendencies, which could be understood as the loss of adsorbed water. 60 When the temperature goes higher than 380 C, all curves become sharp and keep dropping at their largest slope until around 500 C was reached. The TGA curves for tested materials have shown slightly different ending temperatures for the second stage. LSC-6303NiCo has an ending temperature at 520 C, while both LSC-6309NiCo and LSC-6306NiCo are around 480 C. The third stage of the curves is from 500 C to 850 C until the end of the test. All three curves have shown good amounts of weight losses but with flatter tendency or smaller slope than the second stage. Overall, the total weight losses for LSC-6303NiCo, LSC-6306NiCo, and LSC-6309NiCo are 1.72%, 1.84%, and 2.22%, respectively. The weight loss values for LSC-6303NiCo, LSC-6306NiCo and LSC- 6309NiCo have indicated that the amount of in-situ exsolved nanoparticles, as well as the number of oxygen vacancies, are increasing with an increased amount of doped catalytically active metals. Figure 4.9 (b) shows the comparison of TGA curves for LSC-6309NiCo, LSC-6309Ni, and LSC-7309NiCo, and the weight losses for them are 2.22%, 2.27%, and 1.86%, respectively. All three curves have similar three stages of weight losses at 100 C to around 400 C, from 400 C to around 600 C, and from 600 C to 850 C. The starting and ending temperatures of each material are slightly different due to the different material compositions. LSC- 6309NiCo had a similar weight loss with LSC-6309Ni, but LSC-6309NiCo has an obvious lower starting temperature and a larger amount of weight loss in stage two and the first half of stage three. Stage two and three are the main steps to introduce oxygen vacancies into the structure, where LSC-6309NiCo started at 380 C and 510 C, and LSC-6309Ni was at 420 C and 580 C. At the last part of stage three, at around 600 C the LSC-6309Ni has 51
67 increased its weight loss and resulted in a similar amount with LSC-6309NiCo. This result indicates that A-site deficient material, both from monometallic doping and bimetallic doping, shall have introduced a similar amount of oxygen vacancies into the structure, but bimetallic doped perovskite requires less energy for the exsolution process. LSC- 7309NiCo has a smaller amount of weight loss than both LSC-6309NiCo and LSC-6309Ni, and the starting temperature for stage two and three are around 420 C and 580 C, which are higher than LSC-6309NiCo and can be concluded as the effects from the lack of A-site deficiency. By comparing the result of these TGA curves, It can be inferred that the formation of A-site deficiency and bimetallic doping of Ni & Co can facilitate the formation of oxygen vacancies into the structure, thereby improving ionic conductivity and catalytic activity SEM Result Analysis. The previous discussion has revealed the effects of an A-site deficiency on perovskite exsolution, in that the existence of A-site deficiency in a perovskite can successfully facilitate the in-situ exsolution of metallic particles and the introduction of oxygen vacancies. Based on the XRD and TPR results, LSC-6309NiCo and LSC-6309Ni are inferred to have in-situ excluded a fair amount of metal particles. The identification process for the metal particles exsolution is further analyzed by SEM microstructure images. The SEM images of the fresh LSC-6309NiCo and LSC-6309Ni are provided to compare with the reduced LSC-6309NiCo, and LSC-6309Ni samples. Both reduced samples have been pre-treated in 5% H2 N2 at 800 C for 4 hours. Figure 4.10 is the SEM image for microstructures of the fresh LSC-6309NiCo powder sample. Figure 4.11 (a) is the bulk image of reduced LSC-6309NiCo sample and Figure 4.11 (b) is a closer look on the exsolved nanoparticles with higher magnification. Clearly, 52
 and (b). These exsolved particles are uniformly dispersed on the surface of the bulk with a diameter of around 50 nm to 70 nm, which conform to expectations. Figure 4.")
68 no exsolution of metallic nanoparticles could be found on the surface of the fresh sample. Compared with Figure 4.10, numerous amounts of exsolved nanoparticles are observed from Figure 4.11 (a) and (b). These exsolved particles are uniformly dispersed on the surface of the bulk with a diameter of around 50 nm to 70 nm, which conform to expectations. Figure 4.11 c) and d) are the point scanning results for reduced LSC- 6309NiCo. The bulk phase in Figure 4.11 c) was marked as point (1), and the exsolved particle was marked as point (2). Figure 4.11 d) is the diagram showing the peaks for detected elements. In the diagram La is detected at 0.5, 4.7, 5.1 and 5.9 kev, Sr is at 1.8 kev and Cr is at 0.25 and 5.4 kev for both the bulk and exsolved particle. Moreover, distinct Co and Ni peaks are detected at point (2) at 7 and 7.5 kev respectively, while the peaks for point (1) are weak at these positions. This result has verified the exsolution particles from LSC-6309NiCo to the surface of the LSC base under reduction are indeed Ni-Co alloy. Figure SEM image for fresh LSC-6309NiCo microstructure. 53
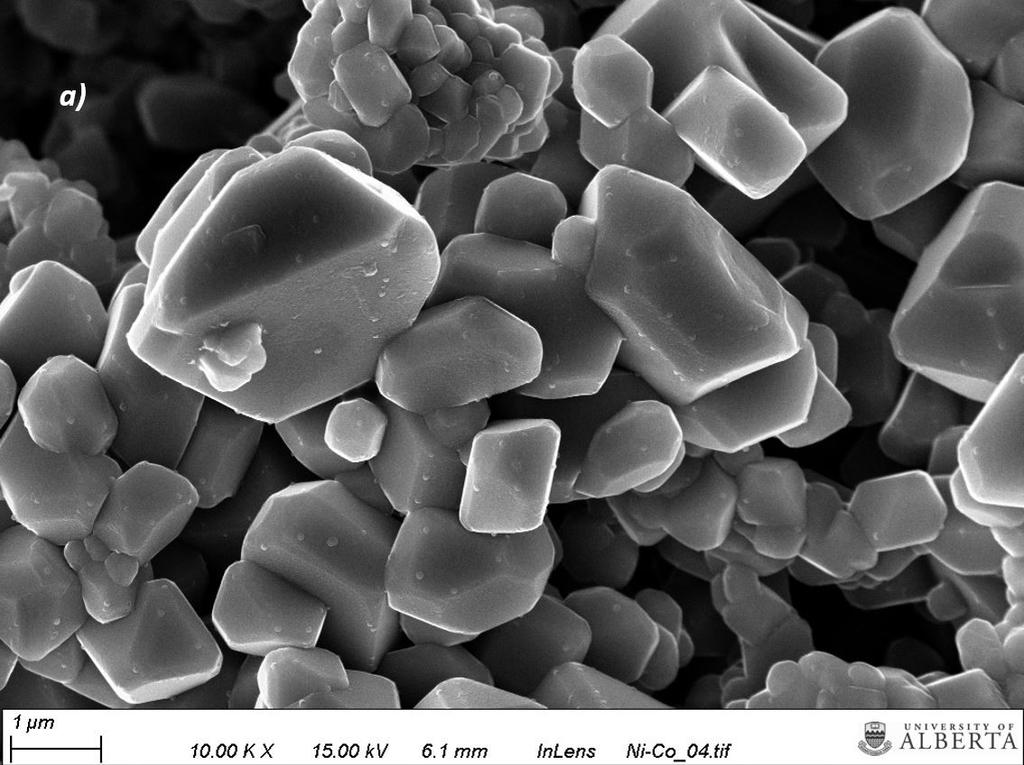
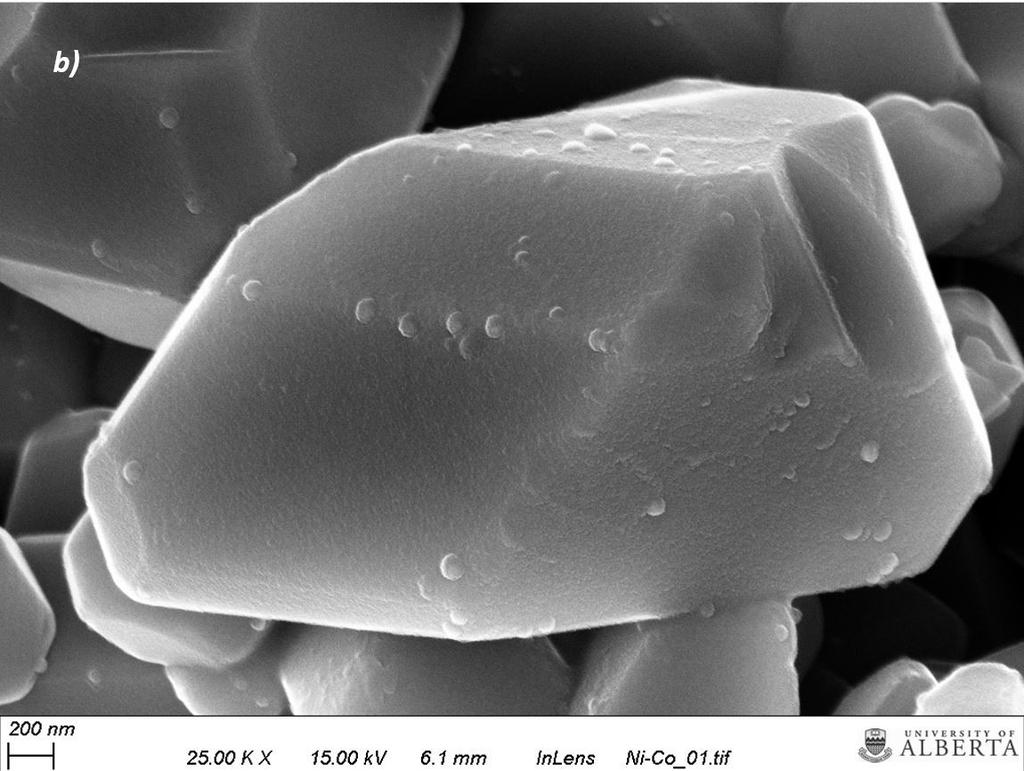
69 54
 the bulk b) the bulk with higher magnification c) & d) are the SEM image and")
70 Intensity (a.u.) d) La Sr Cr Cr La Point (1) La La Point (2) Co Ni Energy (kev) Figure SEM images for reduced LSC-6309NiCo microstructures a) the bulk b) the bulk with higher magnification c) & d) are the SEM image and correlated point scanning results. 55
71 Figure 4.12 shows the SEM image for fresh LSC-6309Ni powder sample s microstructure. As for the fresh LSC-6309NiCo s SEM image, no clear exsolved nanoparticles are found on the fresh LSC-6309Ni sample s surface. In contract, reduced LSC-6309Ni has shown a large amount of exsolved nanoparticles in Figure 4.13 a) & b). These exsolved nanoparticles are well decorated on the surface of the bulk material with a diameter of 50 nm to 70 nm, which is similar to the size of exsolved Ni-Co alloy shown in Figure Figure 4.13 c) & d) are the SEM image with its correlated point scanning results. The bulk base in Figure 4.13 c) was selected as point (1) and one exsolved particle in the figure was marked as point (2). The detected elements for points (1) and (2) are expressed by Figure 4.13 (d). The La element is detected at 0.5, 4.7, 5.1 and 5.9 kev, Sr is at 1.8 kev and Cr is at 0.25 and 5.4 kev for both points (1) and (2) for LSC-6309Ni, which are at exactly the same positions as the LSC-6309NiCo. A small peak of Ni element is detected at 0.8 kev for point (1), which might indicate the existence of Ni in the bulk. Strong peaks of Ni element are detected at both 0.8 and 7.5 kev that indicates the formation of exsolved Ni particles. 56


72 Figure SEM image of fresh LSC-6309Ni microstructure. 57
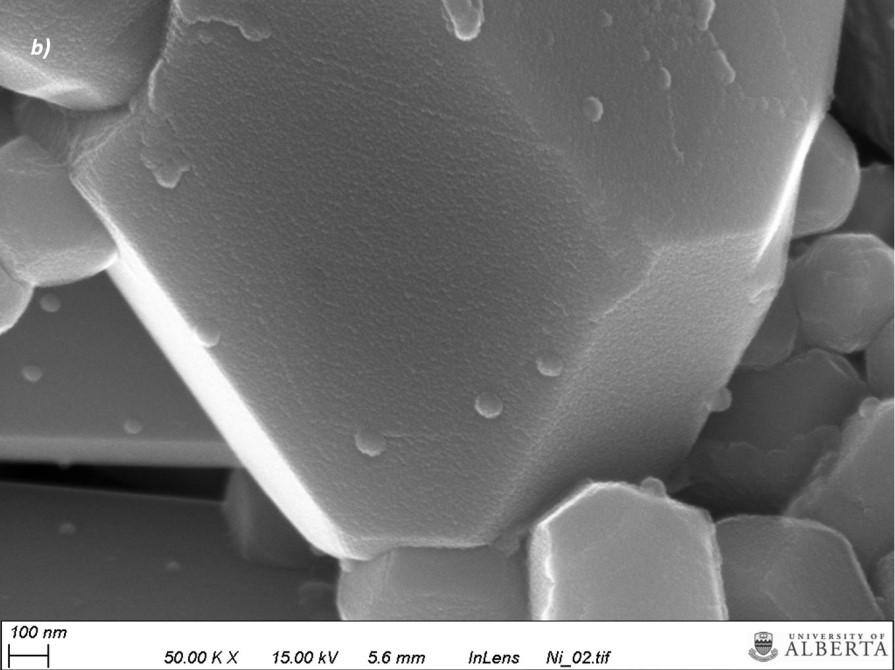
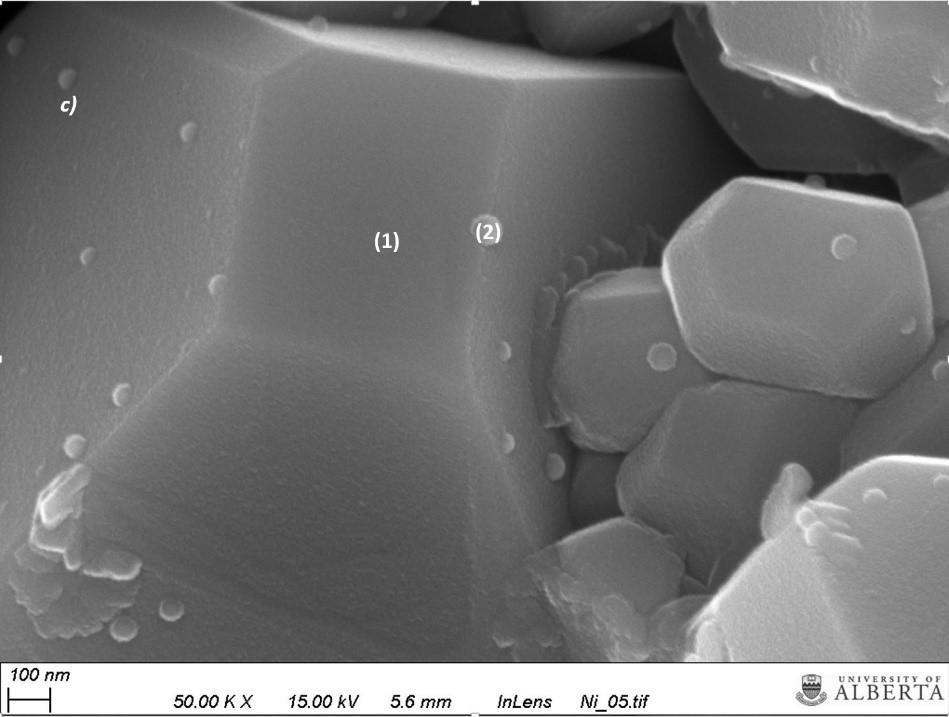
73 58
74 d) La Sr La Cr Intensity (a.u.) Cr Point (1) Ni La La Point (2) Ni Energy (kev) Figure SEM images for reduced LSC-6309Ni microstructures a) the bulk b) the bulk with higher magnification c) & d) are the SEM image and correlated point scanning results. 4.3 Electrochemical Performances of the Cell Previous studies have concluded the importance of in-situ exsolution for electrochemical performance. In-situ exsolution of metal nanoparticles, especially Ni particles has led to high electronic conductivity and high catalytic activity, which successfully promotes the electrochemical performance. 58,36 Both LSC-6309NiCo and LSC-6309Ni have demonstrated the largest amount of exsolution from XRD, TPR and TGA results. Therefore, the LSC-6309NiCo has been applied as an anode material in SOFC, with the electrochemical performance measured in both H2 and syngas environment. For comparison, the performance of LSC-6309Ni was also measured, in order to identify the 59
, which is the reverse mode of SOFC.")
75 functional effects of bimetallic doping and monometallic doping for electrochemical performances. For further investigation, the fabricated material was also applied as a cathode electrode for CO2 reduction in a solid oxide electrolysis cell (SOEC), which is the reverse mode of SOFC. The SEM image of the cross-section microstructure for the tested cell is shown in Figure As revealed by the figure, the dense YSZ was placed in the middle as the electrolyte with a thickness of 300 µm, and the LSCF perovskite oxide was used as the air electrode for all the tested cells. Two 15 µm GDC buffer layers were introduced between the electrode and the electrolyte. The approximately 30µm fuel and air electrode layers were applied above the GDC layers. The current collector layers by Au paste were painted on the electrodes. Figure SEM image of the cross-section area of the cell. 60
Supplementary Information
 Electronic Supplementary Material (ESI) for Journal of Materials Chemistry A. This journal is The Royal Society of Chemistry 2016 Supplementary Information CO 2 -to-co Conversion on Layered Persovskite
Chapter 7. Evaluation of Electrode Performance by. Electrochemical Impedance
 Chapter 7 Evaluation of Electrode Performance by Electrochemical Impedance Spectroscopy (EIS) 7.1 Introduction A significant fraction of internal resistance of a cell comes from the interfacial polarization
Novel Mn 1.5 Co 1.5 O 4 spinel cathodes for intermediate temperature solid oxide fuel cells
 Novel Mn 1.5 Co 1.5 O 4 spinel cathodes for intermediate temperature solid oxide fuel cells Huanying Liu, a, b Xuefeng Zhu, a * Mojie Cheng, c You Cong, a Weishen Yang a * a State Key Laboratory of Catalysis,
Chapter 3. Synthesis and characterization. of GDC electrolyte material
 Chapter 3 Synthesis and characterization of GDC electrolyte material 3.1 Introduction Ceria based oxide materials are used as electrolytes for intermediate temperature solid oxide fuel cell (IT-SOFC) applications.
SUPPLEMENTARY INFORMATION
 Layered oxygen-deficient double perovskite as an efficient and stable anode for direct hydrocarbon solid oxide fuel cells Sivaprakash Sengodan 1, Sihyuk Choi 1, Areum Jun 1, Tae Ho Shin 2, Young-Wan Ju
SOFC Powders and Unit Cell Research at NIMTE. Jian Xin Wang, Jing Shao, You Kun Tao, Wei Guo Wang
 595 10.1149/1.3205571 The Electrochemical Society SOFC Powders and Unit Cell Research at NIMTE Jian Xin Wang, Jing Shao, You Kun Tao, Wei Guo Wang Division of Fuel Cell and Energy Technology Ningbo Institute
Fuel Cell - What is it and what are the benefits? Crina S. ILEA, Energy Lab, Bergen
 Fuel Cell - What is it and what are the benefits? Crina S. ILEA, 10.01.2017 Energy Lab, Bergen CMI Founded in 1988 Two departments: Parts & Services Research & Development Prototype development from idea
Development of Nano-Structured Solid Oxide Fuel Cell Electrodes
 Development of Nano-Structured Solid Oxide Fuel Cell Electrodes G. Schiller, S.A. Ansar, M. Müller German Aerospace Center (DLR), Institute of Technical Thermodynamics, Pfaffenwaldring 38-48, D-70569 Stuttgart,
Introduction Fuel Cells
 Introduction Fuel Cells Fuel cell applications PEMFC PowerCell AB, S2 PEMFC, 5-25 kw Toyota Mirai a Fuel Cell Car A look inside The hydrogen tank 1. Inside Layer of polymer closest to the H2 gas 2. Intermediate
Anodes for Direct Hydrocarbon Solid Oxide Fuel Cells (SOFC s) Challenges in materials selection and deposition
 Challenges in materials selection and deposition") Anodes for Direct Hydrocarbon Solid Oxide Fuel Cells (SOFC s) Challenges in materials selection and deposition Venkatesan V. Krishnan Department of Chemical Engineering IIT Delhi Barriers to the hydrogen
Anodes for Direct Hydrocarbon Solid Oxide Fuel Cells (SOFC s) Challenges in materials selection and deposition Venkatesan V. Krishnan Department of Chemical Engineering IIT Delhi Barriers to the hydrogen
PHYSICAL PROPERTIES OF La 0.9 Sr 0.1 Cr 1-X Ni X O 3-δ (X = 0-0.6) SYNTHESIZED VIA CITRATE GEL COMBUSTION
 SYNTHESIZED VIA CITRATE GEL COMBUSTION") PHYSICAL PROPERTIES OF La 0.9 Sr 0.1 Cr 1-X Ni X O 3-δ (X = 0-0.6) SYNTHESIZED VIA CITRATE GEL COMBUSTION Anuchit Ruangvittayanon * and Sutin Kuharuangrong Received: Sept 29, 2009; Revised: Nov 17, 2009;
PHYSICAL PROPERTIES OF La 0.9 Sr 0.1 Cr 1-X Ni X O 3-δ (X = 0-0.6) SYNTHESIZED VIA CITRATE GEL COMBUSTION Anuchit Ruangvittayanon * and Sutin Kuharuangrong Received: Sept 29, 2009; Revised: Nov 17, 2009;
Supplementary Materials:
 Electronic Supplementary Material (ESI) for Physical Chemistry Chemical Physics. This journal is The Royal Society of Chemistry 2014 Supplementary Materials: Materials and Methods: The mixed ion conducting
Design and Fabrication of Air breathing Solid Oxide Fuel Cell and its performance testing using Hydrogen gas
 Design and Fabrication of Air breathing Solid Oxide Fuel Cell and its performance testing using Hydrogen gas 1 V. Savithiri, 2 R. Pradeep, 3 K. Praveen Krishna 1Department of Mechanical Engineering, St.
FUEL CELL CHARGE TRANSPORT
 FUEL CELL CHARGE TRANSPORT M. OLIVIER marjorie.olivier@fpms.ac.be 19/05/2008 INTRODUCTION Charge transport completes the circuit in an electrochemical system, moving charges from the electrode where they
PEROVSKITES FOR USE AS SULFUR TOLERANT ANODES. A dissertation submitted to the. Graduate School. Of the University of Cincinnati
 PEROVSKITES FOR USE AS SULFUR TOLERANT ANODES A dissertation submitted to the Graduate School Of the University of Cincinnati In partial fulfillment on the Requirements for the degree of Doctor of Philosophy
A Thesis Presented to The Academic Faculty. Benjamin H. Rainwater
 Electrical Properties of BaZr 0.1 Ce 0.7 Y 0.1 Yb 0.1 O 3-δ and its application in Intermediate Temperature Solid Oxide Fuel Cells A Thesis Presented to The Academic Faculty by Benjamin H. Rainwater In
An Electricity and Value-added Gases Co-generation via Solid Oxide Fuel Cells
 Paper # 070MI-0012 Topic: Microcombustion and New Combustion Devices 8 th U. S. National Combustion Meeting Organized by the Western States Section of the Combustion Institute and hosted by the University
Advances in Materials for Solid Oxide Fuel Cells
 Page 1 of 7 Page 1 of 7 Return to Web Version Advances in Materials for Solid Oxide Fuel Cells By: Raymond J. Gorte, Material Matters Volume 5 Article 4 Chemical & Biomolecular Engineering University of
Enhancement of connectivity and flux pinning in MgB2 superconducting bulks and wires
 University of Wollongong Research Online University of Wollongong Thesis Collection 1954-2016 University of Wollongong Thesis Collections 2009 Enhancement of connectivity and flux pinning in MgB2 superconducting
I. INTRODUCTION. II. OBJECTIVE OF THE EXPERIMENT. III. THEORY
 I. INTRODUCTION. Chemical pollution is a serious problem that demands the attention of the scientific community in the early 21 st century. The consequences of pollution are numerous: heating of the atmosphere
Electrolytes: Stabilized Zirconia
 Laurea Magistrale in Scienza dei Materiali Materiali Inorganici Funzionali Electrolytes: Stabilized Zirconia Prof. Antonella Glisenti - Dip. Scienze Chimiche - Università degli Studi di Padova Bibliography
SYNTHESIS AND ELECTRICAL PROPERTIES OF Sr 3 NiNb 2 O 9 MATERIALS FOR SOFCs
 Journal of Ovonic Research Vol. 12, No. 2, March April 2016, p. 81-86 SYNTHESIS AND ELECTRICAL PROPERTIES OF MATERIALS FOR SOFCs Q. LI *, Z. P. LIU, R. YAN, L. M. DONG College of Materials Science and
Development of LSCF: CGO Composite Cathodes for SOFCs by Suspension Spraying and Sintering
 Development of LSCF: CGO Composite Cathodes for SOFCs by Suspension Spraying and Sintering R. Costa *, R. Spotorno, Z. Ilhan, A. Ansar German Aerospace Center, Institute of Technical Thermodynamics, Pfaffenwaldring
Supporting information
 Supporting information The Bifunctional atalyst of ore-shell Nanoparticles Socketed on Oxygen-Deficient Layered Perovskite for Soot ombustion: in-situ Observation of Synergistic Dual Active Sites Yi-Fei
Ionic Conductivity and Solid Electrolytes II: Materials and Applications
 Ionic Conductivity and Solid Electrolytes II: Materials and Applications Chemistry 754 Solid State Chemistry Lecture #27 June 4, 2003 References A. Manthiram & J. Kim Low Temperature Synthesis of Insertion
Microtubular SOFCs for power generation, steam electrolysis and syngas production
 Microtubular SOFCs for power generation, steam electrolysis and syngas production M.A. Laguna-Bercero*, H. Monzón, A. Larrea, V.M. Orera Instituto de Ciencia de Materiales de Aragón (ICMA) Zaragoza, Spain
CHAPTER 8 CONCLUSIONS AND SUGGESTIONS FOR FUTURE WORK
 CHAPTER 8 CONCLUSIONS AND SUGGESTIONS FOR FUTURE WORK 8.1. Conclusions Referring to the aims of the research project in Chapter 4, the following conclusions can be drawn on the basis of the present work:
Ceramics for Energy Storage and Conversion. Dr. Doreen Edwards Dean of Engineering Prof. of Materials Science & Engineering
 Ceramics for Energy Storage and Conversion Dr. Doreen Edwards Dean of Engineering Prof. of Materials Science & Engineering Ceramic and Glass Materials are Critical to Energy Storage and Conversion Devices
Preparation and characterization of metal supported solid oxide fuel cells with screen-printed electrodes and thin-film electrolyte
 Preparation and characterization of metal supported solid oxide fuel cells with screen-printed electrodes and thin-film electrolyte Feng HAN 1 *, Robert SEMERAD 2, Patric SZABO 1, Rémi COSTA 1 feng.han@dlr.de
Advanced materials for SOFCs
 Advanced materials for SOFCs Yoed Tsur Department of Chemical Engineering Technion Outline Intro: why SOFCs are important? Types of SOFCs Hybrid SOFC-something for power generation: NG utilization Materials
Chapter 4. Ionic conductivity of GDC. electrolyte
 Chapter 4 Ionic conductivity of GDC electrolyte 4.1 Introduction Solid oxides with fluorite structure, such as, ZrO 2 and CeO 2, when doped with aliovalent cations become oxygen ion conductor and are used
A0606. Functional SOFC Interfaces Created by Aerosol-Spray Deposition
 A0606 Functional SOFC Interfaces Created by Aerosol-Spray Deposition Neil Kidner, Kari Riggs, Gene Arkenberg, Matthew Seabaugh, Scott Swartz Nexceris, LLC 404 Enterprise Drive, Lewis Center Tel.: +1-614-842-6606
Summary Chapter Chapter Chapter
 Ceria (CeO 2 ) has been extensively employed as an important component of automotive three-way catalysts (TWC) for reducing the exhaust pollutants. Besides this, fuel cell processes, oxygen permeation
Chapter 2 Fabrication and Investigation of Intermediate-Temperature MS SOFCs
 Chapter 2 Fabrication and Investigation of Intermediate-Temperature MS SOFCs 2.1 Introduction Metal-supported solid oxide fuel cells (MS SOFCs) offer many advantages like excellent structural robustness
Final publishable summary report Executive Summary
 Final publishable summary report Executive Summary Beyond the state of the art, the EVOLVE cell concept aims at combining the beneficial characteristics of the previous cell generations, the so called
Synthesis of nanocarbon materials by PECVD: challenges to direct synthesis via CO 2 reduction using plasma-soec hybrid reactor
 22 nd International Symposium on Plasma Chemistry July 5-10, 2015; Antwerp, Belgium Synthesis of nanocarbon materials by PECVD: challenges to direct synthesis via CO 2 reduction using plasma-soec hybrid
A Novel Metal Supported SOFC Fabrication Method Developed in KAIST: a Sinter-Joining Method
 Journal of the Korean Ceramic Society Vol. 53, No. 5, pp. 478~482, 2016. http://dx.doi.org/10.4191/kcers.2016.53.5.478 Review A Novel Metal Supported SOFC Fabrication Method Developed in KAIST: a Sinter-Joining
Development of Intermediate-Temperature Solid Oxide Fuel Cells for Direct Utilization of Hydrocarbon Fuels
 University of Pennsylvania ScholarlyCommons Departmental Papers (CBE) Department of Chemical & Biomolecular Engineering November 2004 Development of Intermediate-Temperature Solid Oxide Fuel Cells for
Evaluation of Cathode Materials for Low Temperature ( C) Solid Oxide Fuel Cells
 Solid Oxide Fuel Cells") University of Connecticut DigitalCommons@UConn Master's Theses University of Connecticut Graduate School 9-6-2011 Evaluation of Cathode Materials for Low Temperature (500-700C) Solid Oxide Fuel Cells Alexander
University of Connecticut DigitalCommons@UConn Master's Theses University of Connecticut Graduate School 9-6-2011 Evaluation of Cathode Materials for Low Temperature (500-700C) Solid Oxide Fuel Cells Alexander
Structural Properties of NiO-CGO Composites Precursor Prepared via Combustion Synthesis Route
 Asian Journal of Chemistry Vol. 21, No. 10 (2009), S157-161 Structural Properties of NiO-CGO Composites Precursor Prepared via Combustion Synthesis Route PANKAJ KALRA# ANIRUDH P. SINGH and AJAY KUMAR #
Advanced Materials Thermal and Environmental Barrier Coatings Solid Oxide Fuel Cells Custom Compositions
 Advanced Materials Thermal and Environmental Barrier Coatings Solid Oxide Fuel Cells Custom Compositions Advanced Materials With over 50 years of advanced ceramic expertise, Skyworks Solutions, through
a) The self-diffusion coefficient of a metal with cubic structure can be expressed as
 The self-diffusion coefficient of a metal with cubic structure can be expressed as") EXERCISES KJM5120 Chapter 5; Diffusion 1. Random (self) diffusion a) The self-diffusion coefficient of a metal with cubic structure can be expressed as 1 n D = s 6 t 2 where n/t represents the jump frequency
EXERCISES KJM5120 Chapter 5; Diffusion 1. Random (self) diffusion a) The self-diffusion coefficient of a metal with cubic structure can be expressed as 1 n D = s 6 t 2 where n/t represents the jump frequency
Av. Prof. Lineu Prestes, Cidade Universitária (USP) CEP São Paulo - Brazil
 CEP São Paulo - Brazil") Characterization of LSCF-based composite and LSCF as cathodes for intermediate temperature SOFCs Reinaldo Azevedo Vargas 1,a, Everton Bonturim 1,b, Marco Andreoli 1,c, Rubens Chiba 1,d, Emília Satoshi
Characterization of LSCF-based composite and LSCF as cathodes for intermediate temperature SOFCs Reinaldo Azevedo Vargas 1,a, Everton Bonturim 1,b, Marco Andreoli 1,c, Rubens Chiba 1,d, Emília Satoshi
FESC FINAL PROJECT REPORT
 FESC FINAL PROJECT REPORT Development of Novel Water Splitting Catalysts for the Production of Renewable Hydrogen P.I. Helena Hagelin-Weaver Department of Chemical Engineering University of Florida Project
ENERGY CARRIERS AND CONVERSION SYSTEMS Vol. II - Molten Carbonate Fuel Cells - Kouichi Takizawa
 MOLTEN CARBONATE FUEL CELLS Kouichi Takizawa Tokyo Electric Power Company, Japan Keywords: alkali metal carbonate, coal gasfication gas, lithium aluminate, nickel oxide, wet seal. external reforming, internal
Designing and Building Fuel Cells
 Designing and Building Fuel Cells Colleen Spiegel Me Grauv Hill NewYork Chicago San Francisco Lisbon London Madrid Mexico City Milan New Delhi San Juan Seoul Singapore Sydney Toronto Foreword xii Chapter
REPORT DOCUMENTATION PAGE
 REPORT DOCUMENTATION PAGE Form Approved OMB NO. 0704-0188 The public reporting burden for this collection of information is estimated to average 1 hour per response, including the time for reviewing instructions,
Advanced Analytical Chemistry Lecture 10. Chem 4631
 Advanced Analytical Chemistry Lecture 10 Chem 4631 What is a fuel cell? An electro-chemical energy conversion device A factory that takes fuel as input and produces electricity as output. O 2 (g) H 2 (g)
Fuel Cell Technology
 Fuel Cell Technology 1. Technology overview 2. Fuel cell performance 3. Fuel cell systems 4. Sample calculations 5. Experiment using PEM cell Goal: To provide a better understanding of the fuel cell technology,
ENVIRONMENT-FRIENDLY HYDROGEN GAS AS FUEL IN FUEL CELL AND ITS CHALLENGES
 ENVIRONMENT-FRIENDLY HYDROGEN GAS AS FUEL IN FUEL CELL AND ITS CHALLENGES Hydrogen is the simplest and lightest element. Storage is one of the greatest problems for hydrogen. It leaks very easily from
The characteristics of nano-sized Gd-doped CeO 2 particles prepared by spray pyrolysis
 Journal of Alloys and Compounds 398 (2005) 240 244 The characteristics of nano-sized Gd-doped CeO 2 particles prepared by spray pyrolysis Hee Sang Kang a, Jong Rak Sohn b, Yun Chan Kang c,, Kyeong Youl
DISCLAIMER. Portions of this document may be illegible electronic image products. Images are produced from the best available original document.
 3 rn -I 0 ZLS TL-s DISCLAIMER Portions of this document may be illegible electronic image products. Images are produced from the best available original document. INDIRECT-FIRED GAS TURBINE DUAL FUEL CELL
Study of Current Interruptions in Direct-Methane Solid Oxide Fuel Cells Zach Patterson
 Study of Current Interruptions in Direct-Methane Solid Oxide Fuel Cells Zach Patterson The purpose of the summer project was to investigate the effects of repeated current interruptions on solid oxide
Development of Ce/ La 0.25 Sr 0.75 Cr 0.5 Mn 0.5 O 3 Anode Catalyst for Further Application in Solid Oxide Fuel Cell Typed Reactor
 Development of Ce/ La 0.25 Sr 0.75 Cr 0.5 Mn 0.5 O 3 Anode Catalyst for Further Application in Solid Oxide Fuel Cell Typed Reactor W. Appamana Abstract La 0.25 Sr 0.75 Cr 0.5 Mn 0.5 O 3 (LSCM) and Ce/LSCM
Solid Oxide Fuel Cells for CO2 reduction
 Solid Oxide Fuel Cells for CO2 reduction Carbon Capture and U.lisa.on1 22/2/2017 Energy Materials Group at St Andrews Prof. John Irvine Well known in SOFC research Leads established group with long track
Electrochemical cells use spontaneous redox reactions to convert chemical energy to electrical energy.
 ELECTROLYSIS: -the process of supplying electrical energy to a molten ionic compound or a solution containing ions so as to produce a chemical change (causing a non-spontaneous chemical reaction to occur).
R. Costa* 1, F. Han 1, P. Szabo 1, V. Yurkiv 2, R. Semerad 3, L.Dessemond 4
 DLR.de Chart 1 Performances and limitations of metal supported cells with strontium titanate based fuel electrode: a step towards the next generation of solid oxide cells R. Costa* 1, F. Han 1, P. Szabo
SOLID OXIDE FUEL CELLS DEVELOPED BY THE SOL-GEL PROCESS FOR OXYGEN GENERATION
 SOLID OXIDE FUEL CELLS DEVELOPED BY THE SOL-GEL PROCESS FOR OXYGEN GENERATION BY JOSHUA S. FINCH A Dissertation submitted to the Graduate School - New Brunswick Rutgers, The State University of New Jersey
Green usage of fossil fuels with solid oxide fuel cell
 211 2nd International Conference on Environmental Science and Development IPCBEE vol.4 (211) (211) IACSIT Press, Singapore Green usage of fossil fuels with solid oxide fuel cell H.Kazemi Esfeh Faculty
Development of Ceria-Zirconia Solid Solutions and Future Trends
 Special Issue Oxygen Storage Materials for Automotive Catalysts Ceria-Zirconia Solid Solutions 1 Review Development of Ceria-Zirconia Solid Solutions and Future Trends Hideo Sobukawa This review summarizes
We are IntechOpen, the world s leading publisher of Open Access books Built by scientists, for scientists. International authors and editors
 We are IntechOpen, the world s leading publisher of Open Access books Built by scientists, for scientists 3,500 108,000 1.7 M Open access books available International authors and editors Downloads Our
Gadolinia doped ceria/yttria stabilised zirconia electrolytes for solid oxide fuel cell applications
 JOURNAL OF MATERIALS SCIENCE 39 (2004) 235 240 Gadolinia doped ceria/yttria stabilised zirconia electrolytes for solid oxide fuel cell applications Abstract J. LUO, R. J. BALL, R. STEVENS Materials Research
METAL FINISHING. (As per revised VTU syllabus: )
") METAL FINISHING (As per revised VTU syllabus: 2015-16) Definition: It is a process in which a specimen metal (article) is coated with another metal or a polymer in order to modify the surface properties
METAL FINISHING (As per revised VTU syllabus: 2015-16) Definition: It is a process in which a specimen metal (article) is coated with another metal or a polymer in order to modify the surface properties
Ceramic Processing Research
 Journal of Ceramic Processing Research. Vol. 14, No. 6, pp. 689~693 (2013) J O U R N A L O F Ceramic Processing Research Synthesis and characterization of conjugated core-shell structured YSZ@Ni-GDC anode
CHAPTER-VII SUMMARY AND CONCLUSIONS
 CHAPTER-VII SUMMARY AND CONCLUSIONS Chapter-VII Summary and Conclusions Sr. No. Title Page No. 7.1 Summary 167 7.2 Conclusions.. 171 CHAPTER SEVEN Summary and Conclusions 7.1: Summary The technologies
A SOLVENT-FREE COMPOSITE SOLID ELECTROLYTES OF Li 2 CO 3 Al 2 O 3 SYSTEM PREPARED VIA WATER BASED SOL GEL METHOD
 18 TH INTERNATIONAL CONFERENCE ON COMPOSITE MATERIALS A SOLVENT-FREE COMPOSITE SOLID ELECTROLYTES OF Li 2 CO 3 Al 2 O 3 SYSTEM PREPARED VIA WATER BASED SOL GEL METHOD M. Sulaiman 1, *, A.A. Rahman 1, N.S.
Evaluation of Solid Oxide Fuel Cells Operating on Hydrogen Sulfide Contaminated Fuel
 Evaluation of Solid Oxide Fuel Cells Operating on Hydrogen Sulfide Contaminated Fuel by: Abdolkarim Sheikhansari Supervisors: Dr. Simon Blakey Dr. Jonathan Paragreen A thesis submitted in partial fulfilment
Supporting Information
 Electronic Supplementary Material (ESI) for Energy & Environmental Science. This journal is The Royal Society of Chemistry 2018 Supporting Information High performance All-Solid-State Li-Se Batteries induced
Novel Sulfur-Tolerant Anodes for Solid Oxide Fuel Cells
 Novel Sulfur-Tolerant Anodes for Solid Oxide Fuel Cells Final Report Reporting Period: October 1, 2004 to December 31, 2008 DOE Contract No.: DOE - DE-FC26-04NT42219 DOE Project Manager: Dr. Briggs White
SUPPLEMENTARY INFORMATION
 High Electrochemical Activity of the Oxide Phase in Model Ceria- and Ceria-Ni Composite Anodes William C. Chueh 1,, Yong Hao, WooChul Jung, Sossina M. Haile Materials Science, California Institute of Technology,
Ceramic Processing Research
 Journal of Ceramic Processing Research. Vol. 18, No. 4, pp. 336~340 (2017) J O U R N A L O F Ceramic Processing Research Electrochemical properties of Ca 1-x La x TiO 3 anode materials for solid oxide
Advanced Analytical Chemistry Lecture 16. Chem 4631
 Advanced Analytical Chemistry Lecture 16 Chem 4631 What is a fuel cell? An electro-chemical energy conversion device A factory that takes fuel as input and produces electricity as output. O 2 (g) H 2 (g)
Synthesis and Characterization of nanocrystalline Ni-Co-Zn ferrite by Sol-gel Auto-Combustion method.
 International Journal of Scientific & Engineering Research Volume 3, Issue 12, December-212 1 Synthesis and Characterization of nanocrystalline Ni-Co- ferrite by Sol-gel Auto-Combustion method. R. B. Bhise
O 4. coating on the oxidation behavior of Fe-20Cr ferritic stainless steels for SOFC interconnects
 IOP Conference Series: Earth and Environmental Science PAPER OPEN ACCESS The influence of Titanium alloying and Co 3 O 4 coating on the oxidation behavior of Fe-20Cr ferritic stainless steels for SOFC
ABSTRACT. Siddharth Patel, Master of Science, Associate Professor, Dr. Gregory Jackson, Department of Mechanical Engineering
 ABSTRACT Title of Document: PERFORMANCE OF Ni/CEO 2 /YSZ SOFC ANODES WITH CARBONACEOUS FUELS Siddharth Patel, Master of Science, 2009 Directed By: Associate Professor, Dr. Gregory Jackson, Department of
Sintering Behavior of Porous Nanostructured Sr-Doped Lanthanum Manganite as SOFC Cathode Material
 Int. J. Nanosci. Nanotechnol., Vol. 9, No. 2, June 2013, pp. 71-76 Sintering Behavior of Porous Nanostructured Sr-Doped Lanthanum Manganite as SOFC Cathode Material H. Tamaddon *, A. Maghsoudipour Ceramics
Module 9: Energy Storage Lecture 34: Fuel Cell
 Module 9: Energy Storage Lecture 34: Fuel Cell In this lecture the energy storage (fuel cell) is presented. The following topics are covered in this lecture: Fuel cell Issues in fuel cell Hydrogen fuel
Laurea in Scienza dei Materiali Materiali Inorganici Funzionali. Electrolyzers
 Laurea in Scienza dei Materiali Materiali Inorganici Funzionali Electrolyzers Prof. Dr. Antonella Glisenti -- Dip. Scienze Chimiche -- Università degli Studi di di Padova H 2 by Electrolysis High purity
Supplementary Information
 Supplementary Information Supplementary Figure 1 Characterization of precursor coated on salt template. (a) SEM image of Mo precursor coated on NaCl. Scale bar, 50 μm. (b) EDS of Mo precursor coated on
Proton Ceramic Steam Electrolysers
 Proton Ceramic Steam Electrolysers Einar Vøllestad 1, R. Strandbakke 1, Dustin Beeaff 2 and T. Norby 1 1 University of Oslo, Department of Chemistry, 2 CoorsTek Membrane Sciences AS Theoretical considerations
HYDROGEN FUEL CELL TECHNOLOGY
 HYDROGEN FUEL CELL TECHNOLOGY Vikash, Vipin Yadav, Vipin Badgaiyan Dronacharya College of Engineering, Gurgaon Abstract: - Whereas the 19th century was the century of the steam engine and the 20th century
ESL ElectroScience, 416 East Church Road, King of Prussia, PA Abstract
 Manufacture of LSM and GD Thick Film Pastes for SOFs in ISO 00 Environment. H. Feingold a, P. Palanisamy a, K. Takarabe b, Z. Topka a, and R. S. Webb a a ESL ElectroScience, East hurch Road, King of Prussia,
Preparation and characterization of nano ceramic size La 0.5 Ni 0.5 FeO 3, and La 0.8 Sr 0.2 CO 0.2 Fe 0.8 O 3 cathodes for Solid Oxide Fuel Cells
 International Journal of Engineering Research and Technology. ISSN 0974-3154 Volume 6, Number 1 (2013), pp. 25-32 International Research Publication House http://www.irphouse.com Preparation and characterization
Novel Materials for Lithium-Ion Batteries
 Novel Materials for Lithium-Ion Batteries John Bradley May 18th 2012 Project Supervisors: Prof. West & Chaou Tan Abstract The effect of carbon coating on two novel battery cathode materials LiMnP 2 O 7
High Conductivity Oxides for Solid Oxide Fuel Cells ABEL FERNANDEZ MATERIALS 286G JUNE 2016
 High Conductivity Oxides for Solid Oxide Fuel Cells ABEL FERNANDEZ MATERIALS 286G JUNE 2016 How do Solid Oxide Fuel Cells Work? O 2 O 2 O 2 O 2 Cathode Electrolyte O 2- O 2- O 2- Porous cathode reduces
Element diffusion in SOFCs: multi-technique characterization approach
 Degradation mechanisms and advanced characterization and testing (II) Element diffusion in SOFCs: multi-technique characterization approach M. Morales 1, A. Slodczyk 1, A. Pesce 2, A. Tarancón 1, M. Torrell
SOFCs Components: cathodes
 Laurea Magistrale in Scienza dei Materiali Materiali Inorganici Funzionali SOFCs Components: cathodes Prof. Antonella Glisenti - Dip. Scienze Chimiche - Università degli Studi di Padova Cathode: requirements
Uudergraduate Honors Thesis. Ge Zhu 4/13/2018
 Development of LiNi0.5Mn.1.5-xTixO4 as an Advanced Cathode for Lithium-Ion Batteries Uudergraduate Honors Thesis Ge Zhu 4/13/2018 Department of Mechanical and Aerospace Engineering Advisor: Dr. Jung Hyun
The synthesis and characterization of alkaline-earth metal doped Pr 2 Mo 2 O 9 pigments: Applications in coloring of plastics
 Chapter 4 The synthesis and characterization of alkaline-earth metal doped Pr 2 Mo 2 O 9 pigments: Applications in coloring of plastics Summary A new class of inorganic pigments based on praseodymium molybdate
Study of transition metal oxide doped LaGaO 3 as electrode materials for LSGM-based solid oxide fuel cells
 J Solid State Electrochem (1998) 3: 7±14 Ó Springer-Verlag 1998 ORIGINAL PAPER Fanglin Chen á Meilin Liu Study of transition metal oxide doped LaGaO 3 as electrode materials for LSGM-based solid oxide
Degradation Comparison of Hydrogen and Internally Reformed Methane-Fueled Solid Oxide Fuel Cells
 Journal of the Korean Ceramic Society Vol. 53, No. 5, pp. 483~488, 2016. http://dx.doi.org/10.4191/kcers.2016.53.5.483 Communication Degradation Comparison of Hydrogen and Internally Reformed Methane-Fueled
R. Costa*, G. Schiller, K. A. Friedrich & R.Costa 1, F. Han 1, P. Szabo 1, V. Yurkiv 2, R. Semerad 3, L.Dessemond 4
 DLR.de Chart 1 Performances and limitations of metal supported cells with strontium titanate based fuel electrode: a step towards the next generation of solid oxide cells R. Costa*, G. Schiller, K. A.
Testing SOFCs with Blends of Hydrogen and Methane
 Testing SOFCs with Blends of Hydrogen and Methane Gerhard Buchinger 1,2, Thomas Raab 1, Stefan Griesser 1, Vincent Lawlor 1, Jürgen Kraut 3, Renate Hiesgen 3, Dieter Meissner 1 1 Upper Austrian University
Effect of Starting Materials on the Characteristics of (La 1-x Sr x ) Mn 1+y O 3-δ Powder Synthesized by GNP
 Mn 1+y O 3-δ Powder Synthesized by GNP") Korea-America nano forum Effect of Starting Materials on the Characteristics of (La 1-x Sr x ) Mn 1+y O 3-δ Powder Synthesized by GNP 2007. 04. 26 orea nstitute of eramic ngineering & echnology MI-Jai
Korea-America nano forum Effect of Starting Materials on the Characteristics of (La 1-x Sr x ) Mn 1+y O 3-δ Powder Synthesized by GNP 2007. 04. 26 orea nstitute of eramic ngineering & echnology MI-Jai
Effect of Contact between Electrode and Interconnect on Performance of SOFC Stacks
 DOI: 10.1002/fuce.201000176 Effect of Contact between Electrode and Interconnect on Performance of SOFC Stacks W. B. Guan 1, H. J. Zhai 1, L. Jin 1,T.S.Li 1, and W. G. Wang 1 * 1 Ningbo Institute of Material
Electronic supplementary information. Efficient energy storage capabilities promoted by hierarchically MnCo 2 O 4
 Electronic Supplementary Material (ESI) for RSC Advances. This journal is The Royal Society of Chemistry 2014 Electronic supplementary information Efficient energy storage capabilities promoted by hierarchically
Examples of the use of XPS in Catalysis Research from the Vohs Group
 Examples of the use of XPS in Catalysis Research from the Vohs Group Supported monolayer vanadia catalysts Ceria/zirconia automotive emissions control catalysts Reaction of oxygenates on Zn Pd/Zn methanol
Development of Solid Oxide Fuel Cell Electrodes with High Conductivity and Enhanced Redox Stability
 Bucknell University Bucknell Digital Commons Master s Theses Student Theses 2010 Development of Solid Oxide Fuel Cell Electrodes with High Conductivity and Enhanced Redox Stability Brandon H. Smith Bucknell
Effect of Temperature and Time of Sintering to Doping Ag On Microstructure of Perovskite Material (La 1-x
 Journal of Physics: Conference Series PAPER OPEN ACCESS Effect of Temperature and Time of Sintering to Doping Ag On Microstructure of Perovskite Material (La 1-x Ag x ) 0.8 Ca 0,2 MnO 3 To cite this article:
Supporting Information. Hematite photoanode with gradient structure shows an unprecedentedly low onset
 Electronic Supplementary Material (ESI) for Physical Chemistry Chemical Physics. This journal is the Owner Societies 2014 Supporting Information Hematite photoanode with gradient structure shows an unprecedentedly