DETERMINATION OF DEGREE OF CARBONIZATION IN COKES BY IMAGE ANALYSIS. Abstract. Background
|
|
|
- Myra Casey
- 6 years ago
- Views:
Transcription
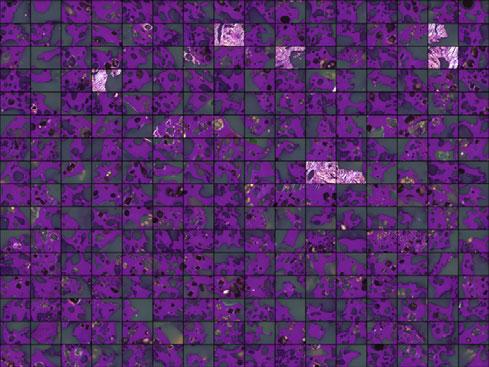
1 DETERMINATION OF DEGREE OF CARBONIZATION IN COKES BY IMAGE ANALYSIS Stein Rørvik, SINTEF Materials and Chemistry, Sem Sælands vei 12, N-7465 Trondheim, Norway Arne Petter Ratvik, SINTEF Materials and Chemistry, Sem Sælands vei 12, N-7465 Trondheim, Norway Trygve Foosnæs, Norwegian University of Science and Technology, Department of Chemistry, N-7491 Trondheim, Norway Abstract A method to determine the degree of carbonization of coke has been developed. The method is based on automatized optical microscopy and image analysis. The degree of carbonization is determined by examining the interference colors in reflected cross polarized light. Optically anisotropic areas have different colors than the isotropic areas. The degree of carbonization is given as the fraction of optical anisotropic area to the total coke area, excluding porosity. The microscope is equipped with automatic stage movement and auto-focus. Several hundred images at random positions are automatically acquired and analyzed. The results are compared to reactivity data for different cokes and their XRD properties. Background Traditionally, cokes for metallurgical use are characterized using reflectance ranking. The reflectance (percent of light at a specified wavelength returning from a polished sample surface) is measured on the vitrinite component of the coke. This reflectance rank increases with increasing maturation / coalification degree of the coke. Other related properties are volatile content (decreasing with increasing rank), carbon content (increasing with increasing rank), calorific value (increasing with increasing rank) and crystallite size (increasing with increasing rank). In the scope of this paper, the cokes characterized were for manganese and silicon production. Due to our research institute's long experience with using optical microscopy and computerized image analysis, it was desirable to apply the developed techniques on metallurgical cokes. Eilertsen et.al. [1] published a method for characterizing cokes by image analysis. This method was developed further to include automatized analysis of a high number of coke grains by Rørvik et.al. [3]. These techniques were developed for petroleum cokes. Petroleum cokes are fully carbonized (by volume), and the published techniques characterized the cokes by measuring the size and texture of the optical domains. When applying this technique on metallurgical cokes, the method was not able to rank the different cokes well. All cokes came out with a similar value representing the size of the (quite small) optical domains in metallurgical cokes. Metallurgical cokes usually have a fraction of the volume without any particular optical texture. The amount of volume with optical texture in the coke can range from almost nothing to 100 %. It was evident that a better way of classifying the metallurgical cokes would be to quantify the relative amount of optically active volumes rather than the size of the optical domains. Method Optical Principles In a metallurgical microscope, the light from a halogen lamp is first plane polarized, and sent through the optics in the microscope onto the coke sample surface. On the coke surface, the light is reflected and the polarization is changed according to the graphite layers' angle at the reflecting point. The reflected light passes a second polarizing filter, which is crossed at 90º relative to the first filter. A half-wave retarder-plate shifts the phase of the light one half wavelength. This causes interference in the visible wavelength range. The interference color depends on the angle of the graphite layers of the coke texture. Basically, the layers having a east-west direction are magenta, SW-NE are yellow and SE-NW are cyan. The layers that are perpendicular to the observation direction will appear with a purple color. Optically isotropic areas will also appear with a purple color. Observations have shown that the purple parts of the developed texture areas have a higher brightness of purple than the optically isotropic areas have. Therefore, the brightness as well as the color should be used for characterizing the images. Figure 1 shows a typical image of a petroleum coke. The coke grain is embedded in epoxy (green). The entire coke grain is crystallized. The carbon layers in the purple areas in the upper right part of the grain are crystalline, but perpendicular to the viewing direction (parallel to the sample surface) and therefore not causing any optical interference. Figure 2 shows a typical image of a metallurgical coke photographed under the same conditions. The purple color here represents carbon with low crystallinity. The upper left part of the grain is fully crystallized, while the lower right part is only crystallized along the edges of the pores.
, equipped with a motorized XY- stage and focus controller.")
 with analog RGB output and a frame-grabber card.")
2 Figure 1. Petroleum coke in polarized light. Figure 2. Metallurgic coke in polarized light. Figure 3. Microscope hardware, schematic. Microscopy Hardware The samples are examined using a standard inverted reflected light metallurgical microscope (Leica MeF3A), equipped with a motorized XY- stage and focus controller. The stage movement and focus is controlled directly by the computer image analysis software. Digital images are acquired using an electronic 3-chip CCD 1 video camera (Sony DCX 950P) with analog RGB output and a frame-grabber card. Newer 1-chip digital cameras provide higher resolution than this camera, but they do not provide the same color accuracy as the 3-chip camera. Color accuracy is very important in the present technique since the degree of carbonization of the coke is determined by the colors appearing in polarized light. Figure 3 illustrates schematically the current microscope setup. Microscopy Software The computer software used is a modified version of the image analysis program NIH Image version The Macintosh version of NIH Image software is in the public domain, and was written by Wayne Rasband at the U.S. National Institutes of Health. The basic program with source code is available electronically via Internet from The source code was modified to support the specific hardware used, and various additional image operations were added. The NIH image software has a Pascal-like macro language, which was used to control the analysis. A proper macro programming language is essential for this kind of work. 1 CCD is abbreviation for Charge Coupled Device. These cameras use a chip with an array of sensors that accumulates an electrical charge proportional to the amount of light exposed onto them.
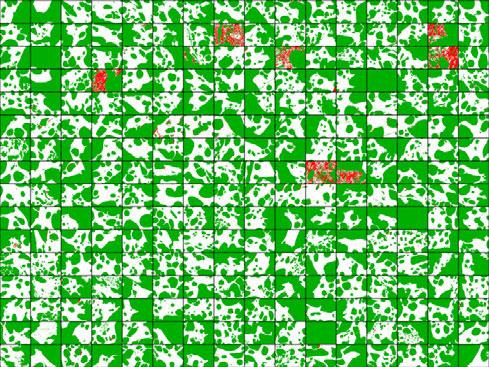
3 Image Analysis, Determination of Carbonized Area The main difference between the present work and the ones published earlier [1, 3] is the way the information is extracted from the images. The sample preparation, image acquisition and statistical post-processing procedures are similar to the procedures described earlier [3]. The steps in the image analysis are as follows: 1. A color image of the coke grain is captured (Figure 4). 2. The blue channel is extracted from the color image (Figure 5). This is the basis for determination of the epoxy / pore areas. The contrast between the epoxy and carbon is highest in this channel. 3. The green channel is extracted from the color image (Figure 6). This is the basis for determination of the carbonized areas. The contrast between the carbonized areas and the isotropic areas is highest in this channel. 4. The pores are thresholded from the blue channel image according to a pre-determined limit (Figure 7). 5. The carbonized areas are thresholded from the green channel image according to a pre-determined limit (Figure 8). 6. A composite image is created for visualization of the result, where the pores are green, the crystallized carbon is red and the isotropic carbon is white (Figure 9). 7. The carbonized fraction for each image is determined by the ratio crystallized area / (crystallized area + isotropic area). Image Analysis, Workflow of Analysis for a Coke Sample The workflow in the analysis is identical to the automatized method published earlier [3]. It is repeated here for easy reference: 1. Coke grains screened to a narrow fraction size of mm are embedded in epoxy under vacuum. This fraction size was chosen because one microscope image at 250x will fit conveniently inside each grain. After the epoxy has cured, the sample is cut, ground and polished. 2. A microscope overview image at low magnification (20x) is captured by merging 5 x 6 adjacent images. Each image covers a physical area of 4.6 x 3.4 mm, giving a total overview sample area of 23 x 20 mm. Acquiring this overview image is automatized and takes just a few minutes. 3. The overview image (which typically contains intersected grains) is processed to find the size and position of each grain. A given number of grains, meeting certain size criteria, are randomly selected by the computer. For practical reasons, a square number of grains is used. An appropriate number has shown to be 256 grains, and was used for the present analysis. About 100 grains is the minimum to get a satisfactory reproducibility. 4. The operator changes the microscope magnification to 250x, and starts the automatic collection of image data. The computer moves the sample to each physical grain position (as calculated from the relative positions in the overview image), requests an auto-focus, and captures a color image to disk. Each image covers a 380 x 260 µm physical area. 5. The images are read by the computer and analyzed in batch. From each color image, the carbonized fraction is extracted as described earlier in this paper. Each image (768 x 576 pixels) is divided into 6 x 4 = 24 sub-frames of 128 x 128 pixels each that are measured. A mosaic index and a fiber index is calculated for each of these 24 frames. 5. The results are post-processed in Microsoft Excel. The statistical processing is straightforward, and done by pasting the results into a template worksheet. First, average values of the 24 measurement tiles in each image are calculated. Then, average values are calculated for all images. Distribution plots are made of these values. The reproducibility is shown by a plot of how the average values converge as a function of number of frames analyzed. Results Figure 10 through Figure 15 shows example result images from some analyzed cokes. Figure 10 shows a color mosaic image of all frames analyzed from a blend coke. The composite image in Figure 11 shows that this coke has a large variation in degree of crystallization from image to image (mix of red and white areas); which is expected as this is a blend of different cokes from different sources. Figure 12 shows a color mosaic image of all frames analyzed from a anisotropic single source coke. The composite image in Figure 13 shows that the degree of crystallization is high for this coke (mostly red areas). Figure 14 shows a color mosaic image of all frames analyzed from an isotropic single source coke. The composite image in Figure 15 shows that the degree of crystallization is low for this coke (mostly white areas). A lower number of images were analyzed for the blend coke, but this is not relevant for the discussion here.
.")

. Figure 6.")

4 Figure 4. Coke, RGB colors. Figure 7. Coke, thresholded pores (black). Figure 5. Coke, blue color channel. Figure 8. Coke, thresholded crystallized carbon (black). Figure 6. Coke, green color channel. Figure 9. Coke, composite image with pores (green), crystallized carbon (red) and isotropic carbon (white).
,")
.")


5 Figure 10. Coke, BBC (blend), color image. Figure 11. Coke, BBC (blend), carbonized area (red). Figure 12. Coke, PD (single source), color image. Figure 13. Coke, PD (single src.), carbonized area (red). Figure 14. Coke, BG (single source), color image. Figure 15. Coke, BG (single src.), carbonized area (red).


6 Figure 16. Average carbonized fraction for all cokes. Figure 17. Lc value for all cokes. Figure 18. Reactivity vs. carbonized fraction for all cokes. Figure 19. Reactivity vs. alkali index for all cokes. Figure 16 through Figure 19 are all taken from Kaczorowski [2]. These are the same cokes as the ones used for the figures above, and is named using the same codes. Figure 16 shows the average carbonized fraction for 6 different cokes. Figure 17 shows the L C value (crystallite height, determined by X-ray diffraction) for all cokes. The ranking is similar by both methods. For the single source cokes, coke "PD" is more crystalline than "ST" and "BG". For the blend cokes, "RBC" is less crystalline than "PBC" and "BBC". It is interesting to observe that the ranking is similar for the two different methods, as the image analysis method operates on a micrometer scale while the X-ray method operates at a nanometer scale. Figure 18 shows the Boudouard reactivity versus carbonized fraction for all cokes. The reactivity is measured as degree of conversion pr time unit (dx/dt). The results do not correlate well. However, Kaczorowski found in his work that the alkali content was more important for reactivity than the coke structure (also as determined by other methods) for these cokes. Figure 19 shows the Boudouard reactivity versus alkali index for all cokes. The alkali index is determined by the ratio of the basic to other oxides in the coke ash. There is a good correlation between alkali index and reactivity. The lack of correlation to the image analysis results does not necessarily mean that the image analysis method is useless, just that other factors may be more important for reactivity. References [1] Jan L. Eilertsen, Stein Rørvik, Trygve Foosnæs, Harald A. Øye: "An Automatic Image Analysis of Coke Texture", Carbon, Volume 34, Issue 3, 1996, p [2] Jakub Kaczorowski: "The Boudouard Reaction in Manganese Production", Doctoral thesis 2006:224, Norwegian University of Technology and Science, ISBN [3] Stein Rørvik, Marianne Aanvik, Morten Sørlie, Harald A. Øye: "Characterization of Optical Texture in Cokes by Image Analysis", The Minerals, Metals and Materials Society (TMS), Light Metals Proceedings 2000.
RHEOSTRUCTURAL EVOLUTION OF AR-HP MESOPHASE PITCH IN SHEAR FLOW
 RHEOSTRUCTURAL EVOLUTION OF AR-HP MESOPHASE PITCH IN SHEAR FLOW S. Kundu and A. A. Ogale* Dept. of Chemical Engineering, and Center for Advanced Engineering Fibers and Films 3 Earle Hall, Clemson University
Pitting on Carbon Cathodes in Aluminium Electrolysis Cells
 Pitting on Carbon Cathodes in Aluminium Electrolysis Cells Samuel Senanu 1, Tor Grande 2 and Arne Petter Ratvik 3 1. PhD candidate 2. Professor Department of Material Science and Engineering, NTNU Norwegian
Quiz on Monday covering: -symmetry operations -notations of axes, vectors, and face notation -Miller indices
 OTHER ANNOUNCEMENTS Quiz on Monday covering: -symmetry operations -notations of axes, vectors, and face notation -Miller indices 2 nd Draft of References due Monday Field Trip Saturday 10/4 and Sunday
Characterisation of CTF deposits from coal-biomass combustion. Fraser Wigley and Jim Williamson Imperial College London Gerry Riley RWE npower
 Characterisation of CTF deposits from coal-biomass combustion Fraser Wigley and Jim Williamson Imperial College London Gerry Riley RWE npower Introduction Co-firing of biomass with coal is now common at
Fundamentals of X-ray diffraction and scattering
 Fundamentals of X-ray diffraction and scattering Don Savage dsavage@wisc.edu 1231 Engineering Research Building (608) 263-0831 X-ray diffraction and X-ray scattering Involves the elastic scattering of
Optical microscopy Theoretical background Galina Kubyshkina
 Optical microscopy Theoretical background Galina Kubyshkina Elektromaterial Lendava d.d., Slovenia Crystalline materials presence of a unit (cell), which is periodically repeated in space regular structure
WF VAN DER VYVER
 DETERMINATION OF FACTORS INFLUENCING THE DEGREE OF REDUCTION DISINTEGRATION IN NORTHERN CAPE LUMP ORE AND THE ROLE OF GANGUE MINERALS IN THE PROPAGATION OF CRACKS WF VAN DER VYVER Dissertation submitted
This lecture is part of the Basic XRD Course.
 This lecture is part of the Basic XRD Course. Basic XRD Course 1 A perfect polycrystalline sample should contain a large number of crystallites. Ideally, we should always be able to find a set of crystallites
CHAPTER 7 MICRO STRUCTURAL PROPERTIES OF CONCRETE WITH MANUFACTURED SAND
 99 CHAPTER 7 MICRO STRUCTURAL PROPERTIES OF CONCRETE WITH MANUFACTURED SAND 7.1 GENERAL Characterizing the mineralogy of the samples can be done in several ways. The SEM identifies the morphology of the
The End of Oil Immersion Microscopy? Joseph Perkins University of Nottingham
 The End of Oil Immersion Microscopy? Joseph Perkins University of Nottingham EngD Project Background MSci Chemistry - University of Nottingham October 2015 - EPSRC Centre for Doctoral Training in Carbon
MODEL SEM Mill. Two independently adjustable TrueFocus ion sources
 MODEL 1060 SEM Mill A state-of-the-art ion milling and polishing system. It is compact, precise, and consistently produces high-quality scanning electron microscopy (SEM) samples for a wide variety of
NEXUS 4000 SERIES. Vickers Hardness Tester
 NEXUS 4000 SERIES Vickers Hardness Tester VICKERS HARDNESS TESTERS NEXUS 4000 SERIES NEXUS 4000 LOAD CELL, CLOSED LOOP SYSTEM FEATURES High-end Vickers/Knoop/Brinell tester with low and high force ranging
Supporting Information. Carbon Welding by Ultrafast Joule Heating
 Supporting Information Carbon Welding by Ultrafast Joule Heating Yonggang Yao, 1,(a) Kun Fu, 1,(a) Shuze Zhu, 2 Jiaqi Dai, 1 Yanbin Wang, 1 Glenn Pastel, 1 Yanan Chen, 1 Tian Li, 1 Chengwei Wang, 1 Teng
The Inertinite Influence on Coal Plasticity and on their Behaviour During Carbonization
 The Inertinite Influence on Coal Plasticity and on their Behaviour During Carbonization GEORGETA PREDEANU 1 *, CORNELIA PANAITESCU 2 1 Metallurgical Research Institute, 39 Mehadia Str., 060543, Bucharest,
EBSD Basics EBSD. Marco Cantoni 021/ Centre Interdisciplinaire de Microscopie Electronique CIME. Phosphor Screen. Pole piece.
 EBSD Marco Cantoni 021/693.48.16 Centre Interdisciplinaire de Microscopie Electronique CIME EBSD Basics Quantitative, general microstructural characterization in the SEM Orientation measurements, phase
Rapid Imaging of Microstructure using Spatially Resolved Acoustic Spectroscopy
 Rapid Imaging of Microstructure using Spatially Resolved Acoustic Spectroscopy Steve Sharples, Matt Clark, Wenqi Li, Mike Somekh Applied Optics Group School of Electrical & Electronic Engineering University
Task 3: Actinide targets properties after irradiation
 Task 3: Actinide targets properties after irradiation The Task 8.3 Characterisation of has been performed at PSI. This task include dismantling of the irradiated target from the containment in PSI hot
CHAPTER 4: The wetting behaviour and reaction of the diamond-si system
 CHAPTER 4: The wetting behaviour and reaction of the diamond-si system In this chapter, the wetting behaviour of diamond by silicon will be presented, followed by the study of the interaction between diamond
Nanoscale Plasmonic Interferometers for Multi-Spectral, High-Throughput Biochemical Sensing
 Supporting Online Information for Nanoscale Plasmonic Interferometers for Multi-Spectral, High-Throughput Biochemical Sensing Jing Feng (a), Vince S. Siu (a), Alec Roelke, Vihang Mehta, Steve Y. Rhieu,
Page 1 of 5
 Page 1 of 5 http://www.olympus-ims.com/en/conducting-steel-plate-surface-texture-topography-analysis-with-laser-scanning-digital-microscope/ Multimedia Application Notes Conducting Steel Plate Surface
THE MORPHOLOGY OF SOME YBCO SUPERCONDUCTOR MATERIALS.
 THE MORPHOLOGY OF SOME YBCO SUPERCONDUCTOR MATERIALS. Georgeta Alecu Research and Design Institute for Electrical Engineering, Splaiul Unirii 313, Bucharest, 74204, Romania, Tel., fax: +(40-1)3222748,
Division of Chemistry and Chemical Engineering, California Institute of Technology 2
 Supporting Information Real-time, Digital LAMP with Commercial Microfluidic Chips Reveals the Interplay of Efficiency, Speed, and Background Amplification as a Function of Reaction Temperature and Time
Introduction to Electron Backscattered Diffraction. TEQIP Workshop HREXRD Feb 1 st to Feb 5 th 2016
 Introduction to Electron Backscattered Diffraction 1 TEQIP Workshop HREXRD Feb 1 st to Feb 5 th 2016 SE vs BSE 2 Ranges and interaction volumes 3 (1-2 m) http://www4.nau.edu/microanalysis/microprobe/interact-effects.html
NEMI Sn Whisker Modeling Group Part 2:Future Work
 NEMI Sn Whisker Modeling Group Part 2:Future Work IPC/NEMI Meeting Maureen Williams, NIST Irina Boguslavsky, NEMI Consultant November 7, 2002 New Orleans, LA Capabilities of NEMI Modeling Group NEMI Fundamental
PARTICULATE ANALYSES
 PARTICULATE ANALYSES Analysis for Asbestos and other Fibrous Particulates Spectrophotometric Analyses for Inorganic Particulate Matter Other Analyses for Inorganic Particulates (and Vapors) Analysis for
REEL-TO-REEL TEXTURE ANALYSIS OF HTS COATED CONDUCTORS USING A MODIFIED GADDS SYSTEM
 Copyright JCPDS - International Centre for Diffraction Data 2003, Advances in X-ray Analysis, Volume 46. 163 REEL-TO-REEL TEXTURE ANALYSIS OF HTS COATED CONDUCTORS USING A MODIFIED GADDS SYSTEM J.L. Reeves
Thermo Scientific ARL EQUINOX X-ray Diffractometers
 Thermo Scientific ARL EQUINOX 1000 X-ray Diffractometers High performance in a compact size Thermo Scientific ARL EQUINOX 1000 X-ray diffractometer (XRD) is designed to meet structural and phase analysis
The object of this experiment is to test the de Broglie relationship for matter waves,
 Experiment #58 Electron Diffraction References Most first year texts discuss optical diffraction from gratings, Bragg s law for x-rays and electrons and the de Broglie relation. There are many appropriate
SUPPLEMENTARY INFORMATION
 a 14 12 Densitometry (AU) 1 8 6 4 2 t b 16 NMHC-IIA GAPDH NMHC-IIB Densitometry (AU) 14 12 1 8 6 4 2 1 nm 1 nm 1 nm 1 nm sirna 1 nm 1 nm Figure S1 S4 Quantification of protein levels. (a) The microtubule
Supporting Information
 Supporting Information Dynamics and Removal Pathway of Edge Dislocations in Imperfectly Attached PbTe Nanocrystal Pairs; Towards Design Rules for Oriented Attachment Justin C. Ondry,, Matthew R. Hauwiller,,
Improved technology for manufacture of carbon electrodes
 Proc. Indian Acad. Sci. (Chem. Sci.), Vol. 112, No. 1, February 2000, pp. 19 26 Indian Academy of Sciences Improved technology for manufacture of carbon electrodes 1. Introduction A PLATON, A DUMBRAVA*,+,
To explore the ability of the DVD technology to create dense, pinhole-free metal oxide
 Chapter 4 Results 4.1 Strategy To explore the ability of the DVD technology to create dense, pinhole-free metal oxide layers and to develop an initial understanding of the relationship between various
average diameter = 3 nm, from PlasmaChem) was mixed in NLCs to produce QDembedded
 was mixed in NLCs to produce QDembedded") Electronic Supplementary Material (ESI) for RSC Advances. This journal is The Royal Society of Chemistry 2014 Supporting information Experimental Section The blended CLC-monomer materials used to fabricate
Electronic Supplementary Material (ESI) for RSC Advances. This journal is The Royal Society of Chemistry 2014 Supporting information Experimental Section The blended CLC-monomer materials used to fabricate
Supplementary Figure 1. Schematic for the growth of high-quality uniform
 Supplementary Figure 1. Schematic for the growth of high-quality uniform monolayer WS 2 by ambient-pressure CVD. Supplementary Figure 2. Schematic structures of the initial state (IS) and the final state
CHAPTER 4. SYNTHESIS OF ALUMINIUM SELENIDE (Al 2 Se 3 ) NANO PARTICLES, DEPOSITION AND CHARACTERIZATION
 NANO PARTICLES, DEPOSITION AND CHARACTERIZATION") 40 CHAPTER 4 SYNTHESIS OF ALUMINIUM SELENIDE (Al 2 Se 3 ) NANO PARTICLES, DEPOSITION AND CHARACTERIZATION 4.1 INTRODUCTION Aluminium selenide is the chemical compound Al 2 Se 3 and has been used as a precursor
40 CHAPTER 4 SYNTHESIS OF ALUMINIUM SELENIDE (Al 2 Se 3 ) NANO PARTICLES, DEPOSITION AND CHARACTERIZATION 4.1 INTRODUCTION Aluminium selenide is the chemical compound Al 2 Se 3 and has been used as a precursor
Travaux Pratiques de Matériaux de Construction
 Travaux Pratiques de Matériaux de Construction Section Matériaux 6 ème semestre 2009 Etude de Matériaux Cimentaire Par Diffraction des Rayons X Responsable: Silke Ruffing E-Mail: silke.ruffing@epfl.ch
JSM-7800F Field Emission Scanning Electron Microscope
 JSM-7800F catalogue JSM-7800F Field Emission Scanning Electron Microscope We provide high performance The Ultimate Research Tool for Multi-Disciplinary Research Institutions Extreme resolution The super
Chapter 3 Basic Crystallography and Electron Diffraction from Crystals. Lecture 9. Chapter 3 CHEM Fall, L. Ma
 Chapter 3 Basic Crystallography and Electron Diffraction from Crystals Lecture 9 Outline The geometry of electron diffraction Crystallography Kinetic Theory of Electron diffraction Diffraction from crystals
Atomic Densities. Linear Density Number of atoms per length whose centers lie on the direction vector for a specific crystallographic direction.
 Atomic Densities Linear Density Number of atoms per length whose centers lie on the direction vector for a specific crystallographic direction. Planar Density Number of atoms per unit area that are centered
Magnetically Actuated Liquid Crystals
 Supporting information Magnetically Actuated Liquid Crystals Mingsheng Wang, a Le He, a Serkan Zorba, b Yadong Yin* a Department of Chemistry, University of California, Riverside, CA 92521, United States
Texture and Wettability of Metallic Lotus Leaves
 Electronic Supplementary Material (ESI) for Nanoscale. This journal is The Royal Society of Chemistry 2015 Nanoscale Supplementary Information for: Texture and Wettability of Metallic Lotus Leaves C. Frankiewicz
Supplementary Figures
 Supplementary Figures Supplementary Figure 1. Characterization of the DNA-surfactant complexes (here taking 14mer DNA-DOAB as an example). (a) Thermal behavior of the DNA-DOAB by differential scanning
Certificate. Standard Reference Material Standard Sapphire Single Crystal Wafer for Crystalline Orientation
 National Institute of Standards & Technology Certificate Standard Reference Material 1995 Standard Sapphire Single Crystal Wafer for Crystalline Orientation This Standard Reference Material (SRM) is intended
Thermo Scientific ARL EQUINOX 100. X-ray Diffractometers
 Thermo Scientific ARL EQUINOX 100 X-ray Diffractometers High performance in a compact size Thermo Scientific ARL EQUINOX 100 X-ray diffractometer (XRD) is designed to meet structural and phase analysis
Diffraction Contrast Tomography. Unlocking Crystallographic Information from Laboratory X-ray Microscopy. Technical Note
 Diffraction Contrast Tomography Unlocking Crystallographic Information from Laboratory X-ray Microscopy Technical Note Diffraction Contrast Tomography Unlocking Crystallographic Information from Laboratory
Single crystal X-ray diffraction. Zsolt Kovács
 Single crystal X-ray diffraction Zsolt Kovács based on the Hungarian version of the Laue lab description which was written by Levente Balogh, Jenő Gubicza and Lehel Zsoldos INTRODUCTION X-ray diffraction
Particle characterization of Metal Powders with Dynamic Image Analysis
 Retsch Technology GmbH Retsch-Allee 1-5 42781 Haan, Germany Phone Fax +49 21 04 / 23 33-300 +49 21 04 / 23 33-399 E-Mail Internet technology@retsch.com www.retsch-technology.com Particle characterization
Nanoscale Imaging, Material Removal and Deposition for Fabrication of Cutting-edge Semiconductor Devices
 Hitachi Review Vol. 65 (2016), No. 7 233 Featured Articles Nanoscale Imaging, Material Removal and Deposition for Fabrication of Cutting-edge Semiconductor Devices Ion-beam-based Photomask Defect Repair
Atomic Densities. Linear Density. Planar Density. Linear Density. Outline: Planar Density
 Atomic Densities Outline: Atomic Densities - Linear Density - Planar Density Single- vs poly- crystalline materials X-ray Diffraction Example Polymorphism and Allotropy Linear Density Number of atoms per
METHOD TO EVALUATE BIAXIAL STRETCH RATIOS IN STRETCH BLOW MOLDING
 METHOD TO EVALUATE BIAXIAL STRETCH RATIOS IN STRETCH BLOW MOLDING Masoud Allahkarami 1, 2, Sudheer Bandla 2, and Jay C. Hanan 1 1 Mechanical and Aerospace Engineering, Oklahoma State University, Tulsa,
X-ray diffraction
 2.2.3.- X-ray diffraction 2.2.3.1.- Origins and fundamentals of the technique The first experimental evidence concerning x-ray diffraction was given by Max von Laue who in 1912 demonstrated that x-rays
Electronic Supporting Information
 Electronic Supplementary Material (ESI) for RSC Advances. This journal is The Royal Society of Chemistry 2018 Electronic Supporting Information An Au@Ag Nanocube based Plasmonic Nano-sensor for Rapid Detection
ORIENTATION DETERMINATION BY EBSP IN AN ENVIRONMENTAL SCANNING ELECTRON MICROSCOPE
 Pergamon PII S1359-6462(99)00086-X Scripta Materialia, Vol. 41, No. 1, pp. 47 53, 1999 Elsevier Science Ltd Copyright 1999 Acta Metallurgica Inc. Printed in the USA. All rights reserved. 1359-6462/99/$
Laboratory Investigations of the Electrical Resistivity of Cokes and Smelting Charge for Optimizing Operation in Large Ferrochrome Furnaces
 Southern African Pyrometallurgy 2006, Edited by R.T. Jones, South African Institute of Mining and Metallurgy, Johannesburg, 5-8 March 2006 Laboratory Investigations of the Electrical Resistivity of Cokes
Wayne State University
 Liquid Crystals Gavin Lawes Wayne State University Liquid Crystal Displays LGE.com Amazon.com casio.com Apple.com LCI at Kent State Outline Liquid Crystals What are liquid crystals? Light and polarization
Clay characterisation from
 Radioactive Waste Management NEA/RWM/CLAYCLUB(2013)1 May 2013 www.oecd-nea.org Clay characterisation from nanoscopic to microscopic resolution NEA CLAY CLUB Workshop Proceedings Karlsruhe, Germany 6-8
Triboelectrostatic Process of Combustion Fly Ash after Carbon Burnout
 Triboelectrostatic Process of Combustion Fly Ash after Carbon Burnout T.X. Li, K. Jiang, J.K. Neathery and J.M. Stencel Center for Applied Energy Research, University of Kentucky, 2540 Research Park Drive,
CLEMEX intelligent microscopy
 CLEMEX intelligent microscopy Shape Detail and Volume Calculations in Micronized Powders Author Monique Dallaire >> Introduction Accuracy of volume calculations is of critical importance in the assessment
Three Dimensional Orientation of Anisotropic. Plasmonic Aggregates at Intracellular Nuclear. Indentation Sites by Integrated Light Sheet Super-
 Supporting Information Three Dimensional Orientation of Anisotropic Plasmonic Aggregates at Intracellular Nuclear Indentation Sites y Integrated Light Sheet Super- Resolution Microscopy Suresh Kumar Chakkarapani,
The University of Texas at Austin Mechanical Engineering Department, Cockrell School of Engineering Austin, TX
 In-Situ Thermal Image Correlation with Mechanical Properties of Nylon-12 in SLS Walker Wroe, Jessica Gladstone, Timothy Phillips, Austin McElroy, Scott Fish, Joseph Beaman The University of Texas at Austin
A Preliminary Report on Phygen s Chromium Nitride Coatings. John B. Woodford, Ph.D. and. Mohumad al-zoubi, Ph.D. Argonne National Laboratory
 A Preliminary Report on Phygen s Chromium Nitride Coatings by John B. Woodford, Ph.D and Mohumad al-zoubi, Ph.D Argonne National Laboratory Introduction To protect a vulnerable surface from wear or chemical
LIST OF FIGURES Figure 1.1: Figure 1.2: Figure 1.3: Figure 2.1: Figure 2.2: Figure 2.3: Figure 2.4: Figure 2.5: (a) (b) (c): (d) (e) (f):
 (b) (c): (d) (e) (f):") LIST OF FIGURES Figure 1.1: Types of surface coatings....4 Figure 1.2: PVD processing techniques...8 Figure 1.3: Schematic of PVD process... 11 Figure 2.1: Formation of intrusion and extrusion marks on
LIST OF FIGURES Figure 1.1: Types of surface coatings....4 Figure 1.2: PVD processing techniques...8 Figure 1.3: Schematic of PVD process... 11 Figure 2.1: Formation of intrusion and extrusion marks on
Crystallographic Textures Measurement
 Crystallographic Textures Measurement D. V. Subramanya Sarma Department of Metallurgical and Materials Engineering Indian Institute of Technology Madras E-mail: vsarma@iitm.ac.in Macrotexture through pole
Recent Progress in Droplet-Based Manufacturing Research
 Recent Progress in Droplet-Based Manufacturing Research H.-Y. Kim, J.-P. Cherng, and J.-H. Chun Abstract This article reports the recent progress of research made in the Droplet-Based Manufacturing Laboratory
 LA-UR-01-3685 Approved for public release; distribution is unlimited. Title: USING A MULTI-DISCIPLINARY APPROACH, THE FIRST ELECTRON BACKSCATTERED KIKUCHI PATTERNS WERE CAPTURED FOR A PLUTONIUM ALLOY Author(s):
Image Recognition Method for Defect on Coke with Low-quality Coal
 , pp. 2512 2518 Image Recognition Method for Defect on Coke with Low-quality Coal Yasuhiro SAITO, 1) * Tetsuya KANAI, 1) Daisuke IGAWA, 1) Yukinori MIYAMOTO, 1) Shohei MATSUO, 1) Yohsuke MATSUSHITA, 1)
Correlation of Near Surface Morphology of Polypropylene and Paint Adhesion Studied by Grazing Incidence X-Ray Diffraction
 Copyright(C)JCPDS-International Centre for Diffraction Data 2, Advances in X-ray Analysis, Vol.42 646 Copyright(C)JCPDS-International Centre for Diffraction Data 2, Advances in X-ray Analysis, Vol.42 646
9/28/2013 9:26 PM. Chapter 3. The structure of crystalline solids. Dr. Mohammad Abuhaiba, PE
 Chapter 3 The structure of crystalline solids 1 2 Why study the structure of crystalline solids? Properties of some materials are directly related to their crystal structure. Significant property differences
Supplementary Information
 Supplementary Information Supplementary Figure 1 Characterization of precursor coated on salt template. (a) SEM image of Mo precursor coated on NaCl. Scale bar, 50 μm. (b) EDS of Mo precursor coated on
Аutomated method for determining the etch pits density on crystallographic planes of large semiconductor crystals
 PACS 07.05.Bx, 42.30.-d, 61.72.Ff Аutomated method for determining the etch pits density on crystallographic planes of large semiconductor crystals G.S. Pekar, А.А. Singaevsky, А.F. Singaevsky V. Lashkaryov
Information Visualization April 21, 2008 Carsten Görg
 Visual Perception Information Visualization April 21, 2008 Carsten Görg Slides adapted from John Stasko Housekeeping HISPOS Remark for 2 nd assignment Forum Register for class by Wednesday Send me related/interesting
Imaging System for the Automated Determination of Microscopical Properties in Hardened Portland Concrete. Federal Manufacturing & Technologies
 Imaging System for the Automated Determination of Microscopical Properties in Hardened Portland Concrete Federal Manufacturing & Technologies C. W. Baumgart, S.P. Cave, K.E. Linder KCP-613-6306 Published
Optical Observation - Hyperspectral Characterization of Nano-scale Materials In-situ
 Optical Observation - Hyperspectral Characterization of Nano-scale Materials In-situ Research at the nanoscale is more effective, when research teams can quickly and easily observe and characterize a wide
TEMPERATURE DEPENDENCY OF THE HYDRATION OF DENSE CEMENT PASTE SYSTEMS CONTAINING MICRO SILICA AND FLY ASH
 1 TEMPERATURE DEPENDENCY OF THE HYDRATION OF DENSE CEMENT PASTE SYSTEMS CONTAINING MICRO SILICA AND FLY ASH 1. INTRODUCTION Tommy B. Hansen Ph.D., Project Manager AALBORG WHITE Technical Team Aalborg Portland
Stuart I. Wright EDAX-TSL, Draper, Utah
 Stuart I. Wright EDAX-TSL, Draper, Utah EBSD Probably the Best Measurement in the World Austin Day, Microscopy & Microanalysis, 11, 502-503 (2005) OIM 3D Introduction to EBSD 3D Data Acquisition Serial
9/16/ :30 PM. Chapter 3. The structure of crystalline solids. Mohammad Suliman Abuhaiba, Ph.D., PE
 Chapter 3 The structure of crystalline solids 1 Mohammad Suliman Abuhaiba, Ph.D., PE 2 Home Work Assignments HW 1 2, 7, 12, 17, 22, 29, 34, 39, 44, 48, 53, 58, 63 Due Sunday 17/9/2015 3 Why study the structure
Growth of Micro-Ikebana on a Floating Substrate: A Method to Monitor Local Supersaturation Levels
 Electronic Supplementary Material (ESI) for Physical Chemistry Chemical Physics. This journal is the Owner Societies 2015 Supporting Information Growth of Micro-Ikebana on a Floating Substrate: A Method
Microstructural Controls on Trace Element Variability in Ore Minerals
 2 Microstructural Controls on Trace Element Variability in Ore Minerals Question: Does EBSD provide new insight into ore mineral microstructure and the chemical enrichment of elements in hydrothermal ore
X-Ray Diffraction by Macromolecules
 N. Kasai M. Kakudo X-Ray Diffraction by Macromolecules With 351 Figures and 56 Tables Kodansha ~Springer ... Contents Preface v Part I Fundamental 1. Essential Properties of X-Rays................. 3 1.1
Fabrication of regular silicon microstructures by photo-electrochemical etching of silicon
 phys. stat. sol. (c) 2, No. 9, 3198 3202 (2005) / DOI 10.1002/pssc.200461110 Fabrication of regular silicon microstructures by photo-electrochemical etching of silicon G. Barillaro *, P. Bruschi, A. Diligenti,
Towards the Epitaxial Growth of Silver on Germanium by Galvanic Displacement
 Electronic Supplementary Material (ESI) for CrystEngComm. This journal is The Royal Society of Chemistry 2014 Towards the Epitaxial Growth of Silver on Germanium by Galvanic Displacement Sayed Youssef
QUANTITATIVE MICROSTRUCTURE ANALYSIS OF DISPERSION STRENGTHENED Al-Al 4 C 3 MATERIAL BY EBSD TECHNIQUE
 Acta Metallurgica Slovaca, Vol. 16, 2010, No.2, p. 97-101 97 QUANTITATIVE MICROSTRUCTURE ANALYSIS OF DISPERSION STRENGTHENED Al-Al 4 C 3 MATERIAL BY EBSD TECHNIQUE M. Varchola, M. Besterci, K. Sülleiová
Fast processes are preferred in
 UV Light-Curing Adhesives for Increased Productivity By Dr. John Herold and Dr. Martin Kluke Table 1 Fast processes are preferred in nearly every industrial production process. Single production steps
Problems in Quantification of Pitting Corrosion
 Problems in Quantification of Pitting Corrosion Jürgen Gelz 1, Muhammad Yasir 2, Gregor Mori 2, Burkhard Meyer 3, Helmut Wieser 4 1 Hochschule Aalen, Germany 2 Christian Doppler Laboratory of Localized
Structure of Carbon Fibers
 CHAPTER 3 Structure of Carbon Fibers The properties of carbon fibers strongly depend on the structure. The properties include tensile modulus, tensile strength, electrical resistivity, and thermal conductivity.
Practical 2P8 Transmission Electron Microscopy
 Practical 2P8 Transmission Electron Microscopy Originators: Dr. N.P. Young and Prof. J. M. Titchmarsh What you should learn from this practical Science This practical ties-in with the lecture course on
Distribution and Energies of Grain Boundaries in Magnesia as a Function of. Five Degrees of Freedom
 Distribution and Energies of Grain Boundaries in Magnesia as a Function of Five Degrees of Freedom David M. Saylor a, Adam Morawiec b, Gregory S. Rohrer c Materials Science and Engineering Dept., Carnegie
Multiplexed 3D FRET imaging in deep tissue of live embryos Ming Zhao, Xiaoyang Wan, Yu Li, Weibin Zhou and Leilei Peng
 Scientific Reports Multiplexed 3D FRET imaging in deep tissue of live embryos Ming Zhao, Xiaoyang Wan, Yu Li, Weibin Zhou and Leilei Peng 1 Supplementary figures and notes Supplementary Figure S1 Volumetric
Supporting Information. Anisotropic Etching of Hexagonal Boron Nitride and. Graphene: Question of Edge Terminations.
 Supporting Information Anisotropic Etching of Hexagonal Boron Nitride and Graphene: Question of Edge Terminations. Yijing Y. Stehle *, Xiahan Sang, Raymond R. Unocic, Dmitry Voylov, Roderick K. Jackson,
LECTURE 7. Dr. Teresa D. Golden University of North Texas Department of Chemistry
 LECTURE 7 Dr. Teresa D. Golden University of North Texas Department of Chemistry Diffraction Methods Powder Method For powders, the crystal is reduced to a very fine powder or microscopic grains. The sample,
Transmission Electron Microscopy (TEM) Prof.Dr.Figen KAYA
 Prof.Dr.Figen KAYA") Transmission Electron Microscopy (TEM) Prof.Dr.Figen KAYA Transmission Electron Microscope A transmission electron microscope, similar to a transmission light microscope, has the following components along
Transmission Electron Microscopy (TEM) Prof.Dr.Figen KAYA Transmission Electron Microscope A transmission electron microscope, similar to a transmission light microscope, has the following components along
High Spectral Resolution X-Ray Optics based on Pyrolytic Graphite
 High Spectral Resolution X-Ray Optics based on Pyrolytic Graphite H. Legall, H. Stiel (MBI), V. Arkadiev (IAP e.v.) A. Antonov, I. Grigorieva (Optigraph GmbH) A. Bjeoumikhov (IfG GmbH), A. Erko (BESSY
MEMS Fabrication. Beyond Integrated Circuits. MEMS Basic Concepts
 MEMS Fabrication Beyond Integrated Circuits MEMS Basic Concepts Uses integrated circuit fabrication techniques to make mechanical as well as electrical components on a single chip. Small size 1µm 1mm Typically
INFLUENCE OF NEEDLED FELT C/C PROCESSING ON FRICTION PERFORMANCE
 INFLUENCE OF NEEDLED FELT C/C PROCESSING ON FRICTION PERFORMANCE Christopher Byrne Southern Illinois University at Carbondale Center for Advanced Friction Studies Mechanical Engineering and Energy Processes
In-situ Heating Characterisation Using EBSD
 Webinar In-situ Heating Characterisation Using EBSD Speakers Dr. Ali Gholinia Dr. Neil Othen Dr. Jenny Goulden Topics Introduction to EBSD Why do in-situ experiments? EBSD equipment requirements for in-situ
Study on Estimation Methods of Applied Stress using Fractography Analysis
 156 Study on Estimation Methods of Applied Stress using Fractography Analysis Hideaki Kaneko* 1 Hiroshi Ishikawa* 1 Takashi Konishi* 1 Masahiro Yamada* 1 The damage mode and applied stress must be estimated
Investigating the crystal orientation of SiC CVD using orientation imaging microscopy (OIM) & X-ray diffraction (XRD) by Deepak Ravindra
 & X-ray diffraction (XRD) by Deepak Ravindra") Investigating the crystal orientation of SiC CVD using orientation imaging microscopy (OIM) & X-ray diffraction (XRD) by Deepak Ravindra Project Details SiC coating is ~200 microns thick on SiC substrate
Investigating the crystal orientation of SiC CVD using orientation imaging microscopy (OIM) & X-ray diffraction (XRD) by Deepak Ravindra Project Details SiC coating is ~200 microns thick on SiC substrate
Microstructural Characterization of Materials
 Microstructural Characterization of Materials 2nd Edition DAVID BRANDON AND WAYNE D. KAPLAN Technion, Israel Institute of Technology, Israel John Wiley & Sons, Ltd Contents Preface to the Second Edition
K. M. Nemati and P. J.M. Monteiro
 EFFECT OF CONFNEMENT ON THE FRACTURE BEHAVOR OF CONCRETE UNDER COMPRESSON K. M. Nemati and P. J.M. Monteiro Department of Civil Engineering Division of Structural Engineering, Mechanics, and Materials