Advanced Characterization Testing of the Port Authority of NY/NJ s Hot Mix Asphalt Materials
|
|
|
- Cameron Allison
- 6 years ago
- Views:
Transcription
1 PA-RU9247 Advanced Characterization Testing of the Port Authority of NY/NJ s Hot Mix Asphalt Materials FINAL REPORT June 2006 Submitted by Dr. Ali Maher * Professor/Director Mr. Thomas Bennert * Research Engineer * Center for Advanced Infrastructure & Transportation (CAIT) Civil & Environmental Engineering Department Rutgers, the State University of New Jersey Piscataway, NJ In cooperation with The Port Authority of NY/NJ, Materials Engineering Division And U.S. Department of Transportation Federal Highway Administration
2 Disclaimer Statement "The contents of this report reflect the views of the author(s) who is (are) responsible for the facts and the accuracy of the data presented herein. The contents do not necessarily reflect the official views or policies of the New Jersey Department of Transportation or the Federal Highway Administration. This report does not constitute a standard, specification, or regulation." The contents of this report reflect the views of the authors, who are responsible for the facts and the accuracy of the information presented herein. This document is disseminated under the sponsorship of the New Jersey Department of Transportation, in the interest of information exchange. The U.S. Government assumes no liability for the contents or use thereof.
3 1. Report No. PA-RU Government Accession No. TECHNICAL REPORT STANDARD TITLE PAGE 3. Recipient s Catalog No. 4. Title and Subtitle Advanced Characterization Testing of the Port Authority of NY/NJ s Hot Mix Asphalt Materials 7. Author(s) Dr. Ali Maher and Mr. Thomas Bennert 5. Report Date June Performing Organization Code CAIT/Rutgers 8. Performing Organization Report No. PA-RU Performing Organization Name and Address 10. Work Unit No. Center for Advanced Infrastructure & Transportation (CAIT) Rutgers, The State University of New Jersey 100 Brett Rd Piscataway, NJ Sponsoring Agency Name and Address U.S. Department of Transportation Research & Innovative Technology Administration (RITA) th Street, SW Washington, DC Contract or Grant No. 13. Type of Report and Period Covered 14. Sponsoring Agency Code 15. Supplementary Notes The Port Authority of NY/NJ Materials Engineering Division Port Authority Technical Center 241 Erie Street Jersey City, NJ Abstract Final Report 1/1/2006 6/30/2006 The PANYNJ is moving towards performance-based evaluations of hot mix asphalt (HMA) to verify the cost new and innovative HMA mixes for use on the George Washington Bridge and on airports, such as Newark Liberty International. HMA mixes for the George Washington Bridge were evaluated using repeated load testing, the Asphalt Pavement Analyzer, Flexural Beam Fatigue, and Dynamic Modulus. The various mixes evaluated consisted of Epoxy-based HMA, asphalt-rubber HMA, Rosphalt (which is an asphalt rubber based mix), and a PG76-22 asphalt binder with fibers. Laboratory testing concluded that the Epoxy-based HMA provided excellent rutting and fatigue properties, however, the mix has a tendency set-up and cure at sometimes unpredictable times, thereby, not lending itself to traditional paving delays that occur. The Rosphalt mix performed almost as well as the Epoxy-based HMA, but without the set-up issues. All innovative HMA mixes tested outperformed the current in-place I-5 PG76-22 in both rutting and fatigue testing. Work conducted on the interface bond testing of HMA cores taken from Newark Liberty International Airport showed clearly showed that HMA with a granite-gneiss aggregate had lower repetitions to debonding than HMA with Trap Rock aggregates. The laboratory results were validated by field observations of debonding in areas where granite-gneiss aggregates were used. Testing was conducted used a bi-axial repeated load test to simulate the axial and shear stresses developed during airplane trafficking. Asphalt Pavement Analyzer (APA) testing of different a FAA #3 surface course mix with various PG-graded asphalt binders showed that, as expected, asphalt binders with higher PG grades are less susceptible to rutting. The results indicated that the fuel resistance asphalt binder, high PG graded at 94 o C, accumulated half of the total APA rutting as the PG Key Words Hot Mix Paving Mixtures, Steel Plates, Interfaces, Debonding, Polymer- Asphalt 18. Distribution Statement 19. Security Classif (of this report) 20. Security Classif. (of this page) 21. No of Pages 22. Price Unclassified Unclassified 71 Form DOT F (8-69)
4 TABLE OF CONTENTS ABSTRACT PANYNJ HMA FOR THE GEORGE WASHINGTON BRIDGE PANYNJ SMA and I4A Repeated Load Testing of SMA and I4A Discussion of Results SMA and I4A Mixes Evaluation of Baseline Mix for George Washington Bridge Repeated Load SPT Testing Flexural Fatigue Test Results Discussion of Results Baseline Mixes for George Washington 11 Bridge 2.0 EVALUATION OF EPOXY ASPHALT FOR THE GEORGE 13 WASHINGTON BRIDGE 2.1 Epoxy HMA Test Results Repeated Load Epoxy HMA Test Results Flexural Beam Fatigue Discussion of Results Epoxy HMA for George Washington Bridge ROSPHALT 50 PERFORMANCE EVALUATION FOR THE 21 GEORGE WASHINGTON BRIDGE 3.1 Flexural Fatigue Test Results Repeated Load Permanent Deformation Test Results Asphalt Pavement Analyzer Test Results Discussion of Results Rosphalt 50 for the George Washington Bridge Summary of Test Results for All Materials Evaluated for the George 28 Washington Bridge 4.0 EVALUATION OF HMA INTERFACE BONDING Laboratory Evaluation of HMA Interface Bond Strength INFLUENCE OF HIGH PG GRADE ON RUTTING POTENTIAL Materials Used and Marshall Mix Design Permanent Deformation Testing RELATED REFERENCES 48 APPENDIX A SIMPLE PERFORMANCE TEST (REPEATED 49 LOAD) SPECIFICATIONS APPENDIX B - TESTING SPECIFICATION FOR FLEXURAL BEAM 59 FATIGUE TEST 1
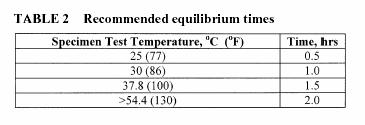
5 ABSTRACT The PANYNJ is moving towards performance-based evaluations of hot mix asphalt (HMA) to verify the cost new and innovative HMA mixes for use on the George Washington Bridge and on airports, such as Newark Liberty International. HMA mixes for the George Washington Bridge were evaluated using repeated load testing, the Asphalt Pavement Analyzer, Flexural Beam Fatigue, and Dynamic Modulus. The various mixes evaluated consisted of Epoxy-based HMA, asphalt-rubber HMA, Rosphalt (which is an asphalt rubber based mix), and a PG76-22 asphalt binder with fibers. Laboratory testing concluded that the Epoxy-based HMA provided excellent rutting and fatigue properties, however, the mix has a tendency set-up and cure at sometimes unpredictable times, thereby, not lending itself to traditional paving delays that occur. The Rosphalt mix performed almost as well as the Epoxy-based HMA, but without the set-up issues. All innovative HMA mixes tested outperformed the current in-place I- 5 PG76-22 in both rutting and fatigue testing. Work conducted on the interface bond testing of HMA cores taken from Newark Liberty International Airport showed clearly showed that HMA with a granite-gneiss aggregate had lower repetitions to debonding than HMA with Trap Rock aggregates. The laboratory results were validated by field observations of debonding in areas where granite-gneiss aggregates were used. Testing was conducted used a bi-axial repeated load test to simulate the axial and shear stresses developed during airplane trafficking. Asphalt Pavement Analyzer (APA) testing of different a FAA #3 surface course mix with various PG-graded asphalt binders showed that, as expected, asphalt binders with higher PG grades are less susceptible to rutting. The results indicated that the fuel resistance asphalt binder, high PG graded at 94 o C, accumulated half of the total APA rutting as the PG PANYNJ HMA FOR THE GEORGE WASHINGTON BRIDGE The scope of work encompasses the advanced characterization of the Port Authority of NY/NJ s hot mix asphalt materials. The advanced characterization is comprised of using the Repeated Load Simple Performance Test (SPT), as described by NCHRP 465, and the Flexural Beam Fatigue device. The SPT was used to evaluate the rutting potential of HMA, while the Flexural Beam Fatigue was used to evaluate the fatigue properties of the HMA materials. 1.1 PANYNJ SMA and I-4A The HMA material testing occurred in two phases. The first phase (Phase I) was an evaluation of an SMA and an I-4A mix. The samples were compacted and cored by the Materials Engineering Division of the Port Authority of NY/NJ (PANYNJ). The evaluation was solely based on the Repeated Load Simple Performance Test (SPT), as described by NCHRP 465. In this test, the permanent deformation properties of the HMA samples were measured by applying a 20 psi cyclic stress on a cylindrical sample 2
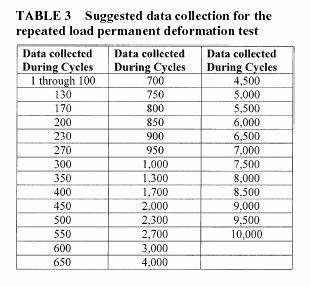
6 that had been heated to 140 o F. Work conducted under NCHRP 465 had recommended 130 o F; however, officials from the PANYNJ specified a test temperature of 140 o F. The second phase (Phase II) of the evaluation utilized both permanent deformation testing (Repeated Load SPT) and flexural fatigue testing. The HMA material tested in the second phase was an I-5 mix that contained a PG76-22 asphalt binder and polyester fibers. Virgin materials were delivered to the Rutgers Asphalt/Pavement Laboratory (RAPL) for mixing and compaction. However, two different asphalt binder contents were used; 5.9% and 6.3%. The asphalt binder contents were specified for the identical aggregate gradation, although to be compacted to different final air voids. The I-5 samples that contained 5.9% AC were to be compacted to 6.0% (± 0.5%) air voids, while the I-5 samples that contained 6.3% AC were to be compacted to 5.0% (± 0.5%) air voids. For the Repeated Load SPT testing, the permanent deformation properties of the HMA samples were measured by applying a 20 psi cyclic stress on a cylindrical sample that had been heated to 140 o F. The testing specifications followed those outlined in NCHRP 465. For the flexural fatigue testing, a Flexural Beam Fatigue device, described by AASHTO 321, was used to evaluate the fatigue properties of the two mixes. The fatigue testing was conducted under a constant-strain test mode at a test temperature of 15 o C (59 o F). A haversine waveform was applied at a rate of 2 Hz (2 loads per second). More details of the Repeated Load SPT and Flexural Beam Fatigue testing are included in the Appendix Repeated Load Testing of SMA and I-4A After the specimens were fabricated, three LVDT (linear variable differential transformers) were glued to the sides of the HMA specimen at 120 degrees apart with a final gage length of 100 mm. The samples were then heated to 140 o F. A dummy sample, instrumented with internal and skin thermocouples, was used to ensure the test sample reaches the required test temperature. Once temperature was achieved, the samples were cyclically loaded using a haversine waveform. A deviatoric cyclic stress of 20 psi was applied for a duration of 0.1 seconds and then followed by a 0.9 second rest period. The Flow Number is determined by plotting the rate of change of axial strain versus the number of loading cycles. The number of loading cycles pertaining to the part of the curve where the slope is zero is designated as the Flow Number. Preliminary specifications from NCHRP 465 (Witczak et al., 2002) are located in Appendix A. Three samples of an SMA and a Port Authority I-4A HMA mix were tested under repeated load testing conditions to compare the permanent deformation properties. The samples were loaded with a 20 psi deviatoric stress at a temperature of 140 o F. Three properties were evaluated from the testing: 1. Flow Number (F N ) The larger the flow number, the more resistant the HMA mix is to permanent deformation; 3
7 2. Slope of the Linear Portion of the Permanent Strain vs Cycles Plot (b) The larger the slope, the greater the potential for rutting in the field and the faster the rutting accumulates; and 3. Accumulated Permanent Deformation at 1,000 Loading Cycles (ε P N = 1,000) The larger the e P 1,000 cycles, the greater the potential for rutting in the field. These three parameters were shown to provide the best correlation to measured field rutting (NCHRP 465) when conducting the repeated load permanent deformation test. The correlation results determined in NCHRP 465 are shown in Table 1.1. The table clearly shows that at the test temperature of 130 o F, the R 2 values for the 3 parameters when compared to measured field rutting were all greater than This should also correspond to the requested test temperature of 140 o F used in this study. The final results are shown in Table 1.2. A statistical analysis was conducted using a Student s t-test analysis (two samples assuming equal or unequal variances) to compare the derived parameters of the two mixes. Prior to using the t-test, the F-Test was used to determine if the variances were equal or unequal. The results of the F-Test were used to select the appropriate condition of the t-test (equal or unequal variances). The analysis was utilized to determine if the samples were statistically equal or statistically not equal among the common test results and parameters. A 95 % confidence interval was chosen for the analysis. Table 1.1 Results of Test Parameter Correlation to Field Rutting (NCHRP 465) 4
8 Table 1.2 Summary of Test Results from the Repeated Load Permanent Deformation Test for SMA and I-4A Test Property Flow Number (F N ) Slope (b) ε P N = 1,000 # SMA # 6 1, # 7 1, Average = 1, # I-4A # # 4 1, Average = 1, The statistical analysis comparisons indicate that: The flow number (F N ) of the SMA and I-4A mix are not significantly different at a 95% confidence level, although a direct comparison of the mean shows that the I-4A performed slightly better. The slopes of the permanent strain curve (b) were significantly different at a 95% confidence level. The results show that the SMA mix had a larger slope, which would indicate that this mix would have a greater potential for permanent deformation in the field. The permanent deformation determined at the 1,000 th loading cycle was found to be significantly different at a 95% confidence level. The results show that the SMA mix accrued more than twice the amount of permanent deformation than the I-4A mix at the 1,000 th loading cycle. Therefore, based on the work conducted within the NCHRP 465 project, the SMA mix would have a greater potential to develop permanent deformation than the I-4A mix. Plots of the tests are shown as Figures 1.1 and Discussion of Results for SMA and I-4A Mixes Based on the comparison of the Flow Number, (F N ), the Permanent Deformation Slope (b), and the Permanent Deformation (ε P ) measured at the 1,000 th cycle from the Repeated Load Permanent Deformation test, the I-4A mix is more resistant to permanent deformation than the SMA. Although the Flow Number results were shown to be statistically equal, both the Slope (b) and the Permanent Deformation (ε P ) at the 1,000 th loading cycle indicate that the I-4A mix will accumulate less permanent deformation than the SMA mix. 5
9 Test Temp = 140 o F, Applied Stress = 20 psi 2.00 Vertical Strain (%) F N I-4A #3 = 900 F N I-4A #1 = 790 F N I-4A #4 = 1, ,000 1,500 2,000 2,500 3,000 3,500 4,000 4,500 5,000 5,500 6,000 Number of Loading Cycles Figure 1.1 Repeated Load Permanent Deformation Test Results for the Port Authority I-4A HMA Mix 4.50 Test Temp = 140 o F, Applied Stress = 20 psi Vertical Strain (%) F N SMA #7 = 978 F N SMA #6 = 1,050 F N SMA #3 = 1, ,000 1,500 2,000 2,500 3,000 Number of Loading Cycles Figure 1.2 Repeated Load Permanent Deformation Test Results for Port Authority SMA Mix 6
10 1.2 Evaluation of Baseline Mix for George Washington Bridge Repeated Load SPT Testing Three samples each of the 5.9% AC and 6.3% AC I-5 mix were tested using the Repeated Load Permanent Deformation test. The same permanent deformation properties used for evaluation in Phase I were also utilized in Phase II. For review, the properties were: 1. Flow Number (F N ) The larger the flow number, the more resistant the HMA mix is to permanent deformation; 2. Slope of the Linear Portion of the Permanent Strain vs Cycles Plot (b) The larger the slope, the greater the potential for rutting in the field and the faster the rutting accumulates; and 3. Accumulated Permanent Deformation at 1,000 Loading Cycles (ε P N = 1,000) The larger the e P 1,000 cycles, the greater the potential for rutting in the field. A summary of the permanent deformation parameters are shown in Table 1.3. A statistical analysis was conducted using a Student s t-test analysis (two samples assuming equal or unequal variances) to compare the derived parameters of the two mixes. Prior to using the t-test, the F-Test was used to determine if the variances were equal or unequal. The results of the F-Test were used to select the appropriate condition of the t-test (equal or unequal variances). The analysis was utilized to determine if the samples were statistically equal or statistically not equal among the common test results and parameters. A 95 % confidence interval was chosen for the analysis. Table Summary of Test Results from the Repeated Load Permanent Deformation Test for I-5 Mix Test Property Air Voids (%) Flow Number (F N ) Slope (b) ε P N = 1,000 A 5.6 1, % AC C 5.8 1, E 5.8 1, Average = , B 4.7 1, % AC C 5.3 1, D 5.1 1, Average = , The statistical analysis comparisons indicate that: The flow number (F N ) of the 5.9% AC mix and 6.3% AC mix are not significantly different at a 95% confidence level, although a direct comparison of the mean shows that the 5.9% AC mix performed slightly better. The slopes of the permanent strain curve (b) were significantly different at a 95% confidence level. The results show that the 6.3% AC mix had a slightly larger slope, which would indicate that this mix would have a greater potential for 7
11 permanent deformation in the field, as well as accumulate permanent deformation slightly faster. The permanent deformation determined at the 1,000 th loading cycle was found to be significantly different at a 95% confidence level. The results show that the 6.3% AC mix developed more permanent deformation than the 5.9% AC mix in the first 1,000 loading cycles. Therefore, based on the work conducted within the NCHRP 465 project, the 6.3% AC mix would have a greater potential for rutting than the 5.9% AC mix. Plots of the Repeated Load Permanent Deformation testing are shown as Figures 1.3 and Average Flow Number (F N ) = 1, Vertical Strain (%) % AC (E) F N = 1, % AC (A) F N = 1, % AC (C) F N = 1, ,000 1,500 2,000 2,500 3,000 3,500 4,000 4,500 5,000 5,500 6,000 Number of Loading Cycles Figure 1.3 Repeated Load Permanent Deformation Test Results for I-5 with 5.9% AC 8
12 Average Flow Number (F N ) = 1, Vertical Strain (%) % AC (E) F N = 1, % AC (D) F N = 1, % AC (B) F N = 1, ,000 1,500 2,000 2,500 3,000 3,500 4,000 4,500 5,000 5,500 6,000 Number of Loading Cycles Figure 1.4 Repeated Load Permanent Deformation Test Results for I-5 with 6.3% AC Flexural Fatigue Test Results All samples were tested at a test temperature of 15 o C. The test specimens were tested until 1,000,000 loading cycles, or until the specimen s flexural strength reached a predetermined minimum value. Samples that were tested out until 1,000,000 cycles lasted 5.7 days due to the slower loading frequency (2 Hz or 2 loads per second). This was achieved at both the 200 and 400 μstrain levels for the 5.9% AC and 6.3% AC samples. The limit of load cycles was chosen due to time constraints associated with the testing. Each mix, 5.9% AC and 6.3% AC, had samples tested at 200, 400, 600, 750, and 900 μ-strains. Throughout the test, the flexural stiffness of the samples were calculated and recorded. The stiffness of the beams was plotted against the load cycles and the resulting data was fitted to an exponential function as follows (AASHTO T321): where, bn S = S O e (11.) S = flexural stiffness after the n load cycles; S O = initial flexural stiffness; 9
13 e = natural algorithm to the base e b = constant from regression analysis N = number of load cycles Equation (1.1) was then modified to determine the number of loading cycles to achieve 50% of the initial flexural stiffness. This was conducted for the five different applied strain levels to provide a regression equation in the form of Equation (1.2). N f k 1 t k 2 = ε (1.2) where, N f = number of loading repetitions until fatigue failure (50% of the initial stiffness) k 1, k 2 = regression coefficients depending on material type and test conditions ε t = tensile strain Tables 1.4 and 1.5 show the calculated values determined from equations (1.1) and (1.2). The number of cycles until fatigue failure (N f, 50% ) for the 5.9% AC and 6.3% AC samples are shown in Figure 1.5. The results indicate that at the lower applied strain levels, the fatigue life of the samples was approximately equal, although the 6.3% AC samples showed slightly better fatigue resistance. This is rational and follows the theory of Fatigue Endurance Limit. Fatigue Endurance Limit states that at a small enough applied tensile strain, the material will have an infinite fatigue life (Monismith et al., 1970; Carpenter et al., 2003). However, as the applied tensile strain increases, the fatigue performance starts to differentiate between one another. The figure clearly shows that the samples with 6.3% AC have a greater fatigue life than the 5.9% AC samples when the tensile strains increase. Table 1.4 Flexural Beam Fatigue Results for I-5, 5.9% AC Samples I-5, 5.9% AC Tensile Strain Air Voids Initial Stiffness, S Cycles to Failure, N O f, 50% (μ strain) (%) (MPa) Slope, b ,465, E ,406, E , E , E , E-05 10
14 Table 1.5 Flexural Beam Fatigue Results for I-5, 6.3% AC Samples I-5, 6.3% AC Tensile Strain Air Voids Initial Stiffness, S Cycles to Failure, N O f, 50% (μ strain) (%) (MPa) Slope, b ,123, E ,216, E , E , E , E ,000,000 Cycles to Failure (N f, 50% ) 10,000,000 1,000, ,000 10,000 I-5, 6.3% AC I-5, 5.9% AC N f = k 1 (1/ε t ) k2 5.9% AC 6.3% AC k 1 = 7.001E E-08 k 2 = N f, 50% Tensile Strain (mm/mm) 5.9% AC 6.3% AC ,465,599 6,123, ,406,150 1,216, ,279 91, ,796 71, ,558 17,712 1, Tensile Strain (mm/mm) Figure 1.5 Fatigue Properties of I-5 Samples with 5.9% and 6.3% AC Discussion of Results Baseline Mixes for George Washington Bridge The permanent deformation and fatigue resistance properties of an I-5 HMA mix, with two different asphalt binder contents and compacted air void levels, were determined using advanced material characterization testing procedures. The permanent deformation properties were evaluated using the Repeated Load Permanent Deformation test procedure as described by NCHRP 465. The flexural fatigue properties were evaluated using the Flexural Beam Fatigue device and test procedure described in AASHTO T321. Based on the performance testing, the following conclusions were drawn: From the flow number (F N ), permanent deformation slope (b), and the accumulated permanent strain at the 1,000 th loading cycle (ε P ) properties 11
15 determined from the permanent deformation testing, the I-5 mix containing 5.9% asphalt binder had slightly better rutting resistance properties than the I-5 mix containing 6.3% asphalt binder. The flexural beam fatigue tests showed that the two mixes had approximately equal fatigue resistance at lower applied strains, with the 6.3% AC samples having slightly better fatigue resistance. This follows the Fatigue Endurance Limit theory which states that at a particularly low tensile strain, the HMA samples will have an infinite fatigue life. However, as the applied tensile strain increased, the 6.3% AC samples showed to have better flexural fatigue properties. This is clearly illustrated in Figure 1.5, which shows the trendline of 6.3% AC samples moving further away from the 5.9% AC samples as the applied tensile strain increased. 12

16 2.0 EVALUATION OF EPOXY ASPHALT FOR GEORGE WASHINGTON BRIDGE Virgin materials were delivered to the Rutgers Asphalt/Pavement Laboratory (RAPL) for mixing and compaction of the epoxy HMA. The epoxy binder is a 2-part binder system, with each part needing to be heated to a different temperature. For accurate heating of the epoxy mix, 1-gallon can heaters were used with a calibrated thermocouple controller that is accurate to 0.1 o F (Figure 2.1). All heating, mixing, and compaction temperatures, as well as the HMA mixture design, were supplied by the PANYNJ, and also later verified by the epoxy binder manufacturer. Figure 2.1 Gallon Can Heaters Used for Blending and Mixing the Epoxy Asphalt Binder All epoxy HMA samples were compacted to have a final air void content of 2.0% (± 0.5%) air voids. For the Repeated Load SPT testing, the permanent deformation properties of the HMA samples were measured by applying a 20 psi cyclic stress on a cylindrical sample that had been heated to 140 o F. The testing specifications followed those outlined in NCHRP 465. For the flexural fatigue testing, a Flexural Beam Fatigue device, described by AASHTO 321, was used to evaluate the fatigue properties of the two mixes. The fatigue testing was conducted under a constant-strain test mode at a test temperature of 15 o C (59 o F). A haversine waveform was applied at a rate of 2 Hz (2 loads per second). 13
17 2.1 Epoxy HMA Test Results Repeated Load After the specimens were fabricated, three LVDT (linear variable differential transformers) were glued to the sides of the HMA specimen at 120 degrees apart with a final gage length of 100 mm. The samples were then heated to 140 o F. A dummy sample, instrumented with internal and skin thermocouples, was used to ensure the test sample reaches the required test temperature. Once temperature was achieved, the samples were cyclically loaded using a haversine waveform. A deviatoric cyclic stress of 20 psi was applied for a duration of 0.1 seconds and then followed by a 0.9 second rest period. The Flow Number is determined by plotting the rate of change of axial strain versus the number of loading cycles. The number of loading cycles pertaining to the part of the curve where the slope is zero is designated as the Flow Number. Three samples of the epoxy asphalt mix were tested under repeated load testing conditions to determine the permanent deformation properties. The samples were loaded with a 20 psi deviatoric stress at a temperature of 140 o F. Three properties were evaluated from the testing: 4. Flow Number (F N ) The larger the flow number, the more resistant the HMA mix is to permanent deformation; 5. Slope of the Linear Portion of the Permanent Strain vs Cycles Plot (b) The larger the slope, the greater the potential for rutting in the field and the faster the rutting accumulates; and 6. Accumulated Permanent Deformation at 1,000 Loading Cycles (ε P N = 1,000) The larger the e P 1,000 cycles, the greater the potential for rutting in the field. These three parameters were shown to provide the best correlation to measured field rutting (NCHRP 465) when conducting the repeated load permanent deformation test. The correlation results determined in NCHRP 465 are shown in Table 2.1. The table clearly shows that at the test temperature of 130 o F, the R 2 values for the 3 parameters when compared to measured field rutting were all greater than This should also correspond to the requested test temperature of 140 o F used in this study. The final repeated load results of the Epoxy Asphalt are shown in Table 2.2, along with the test results from the two previous HMA mixes. A statistical analysis was conducted using a Student s t-test analysis (two samples assuming equal or unequal variances) to compare the derived parameters of the Epoxy Asphalt to the other 2 mixes. Prior to using the t-test, the F-Test was used to determine if the variances were equal or unequal. The results of the F-Test were used to select the appropriate condition of the t-test (equal or unequal variances). The analysis was utilized to determine if the samples were statistically equal or statistically not equal among the common test results and parameters. A 95 % confidence interval was chosen for the analysis. 14
18 Table 2.1 Results of Test Parameter Correlation to Field Rutting (NCHRP 465) Table 2.2 Summary of Test Results from the Repeated Load Permanent Deformation Test Test Property 5.9% AC PG % AC PG76-22 Epoxy Asphalt Air Voids (%) Flow Number (F N ) Slope (b) ε P N = 1,000 A 5.6 1, C 5.8 1, E 5.8 1, Average = , B 4.7 1, C 5.3 1, D 5.1 1, Average = , # > 20, # > 20, # > 20, Average = 1.67 > 20, The statistical analysis comparisons indicate that: The flow number (F N ) of the Epoxy Asphalt and the two previous PG76-22 mixes are significantly different at a 95% confidence level, with the Epoxy Asphalt never obtaining a Flow Number after 20,000 loading cycles (the samples never failed assumed F N = 20,000 for statistical analysis). Results from NCHRP 465 indicated that the larger the Flow Number, the more rut resistant the HMA. The slope of the permanent strain curve, b, from the Epoxy Asphalt samples was significantly different at a 95% confidence level. The results show that the Epoxy Asphalt had a permanent deformation rate (slope) almost 4 times lower than the previous PG76-22 mixes. Results from NCHRP 465 indicated that the smaller the slope (b) parameter, the more rut resistant the HMA. 15
19 The permanent deformation determined at the 1,000 th loading cycle from the Epoxy Asphalt samples was found to be significantly different at a 95% confidence level when compared to the previously tested PG76-22 samples. The results show that the Epoxy Asphalt accumulated approximately 30 times less permanent axial strain when compared to the previous two PG76-22 mixes. Results from NCHRP 465 indicated that the smaller the permanent deformation at the 1,000 th loading cycle, the more rut resistant the HMA. Plots of the repeated load tests for the Epoxy Asphalt mix are shown as Figure 2.2. Figure 2.3 shows the repeated load results of the Epoxy Asphalt compared to one of the previous PG76-22 mixes. Both PG76-22 mixes performed almost identically under the repeated loading in the previous study. Figure 2.3 illustrates the drastic difference between the Epoxy Asphalt and the PG76-22 I-5 when tested using the repeated load test at 140 o F and an applied deviatoric stress of 20 psi Average Flow Number (F N ) = > 20, Vertical Strain (%) Sample #2 Sample #7 Sample # ,000 4,000 6,000 8,000 10,000 12,000 14,000 16,000 18,000 20,000 Number of Loading Cycles Figure 2.2 Repeated Load Permanent Deformation Test Results for the Port Authority Epoxy HMA Mix 16
20 PG76-22 I-5 5.9% AC Ave F N = 1,538 Vertical Strain (%) Epoxy HMA Ave F N = >20, ,500 5,000 7,500 10,000 12,500 15,000 17,500 20,000 Number of Loading Cycles Figure 2.3 Comparison of Repeated Load Permanent Deformation Test Results for the PANYNJ Epoxy HMA and PG76-22 I-5 Mix (5.9% AC) 2.2 Epoxy HMA Test Results Flexural Beam Fatigue All samples were tested at a test temperature of 15 o C. The test specimens were tested until a minimum of 3,000,000 loading cycles, or until the specimen s flexural strength reached 50% of its initial flexural stiffness. Samples that were tested out until 3,000,000 cycles lasted at least 17 days due to the slower loading frequency (2 Hz or 2 loads per second). This was achieved at the 200, 400, and 900 μstrain levels (600 and 750 μ- strains have not been completed to date). The limit of load cycles was chosen due to time constraints associated with the testing. The Epoxy HMA samples were to be tested at 200, 400, 600, 750, and 900 μ-strains. Throughout the test, the flexural stiffness of the samples were calculated and recorded. The stiffness of the beams was plotted against the load cycles and the resulting data was fitted to an exponential function as follows (AASHTO T321): where, bn S = S O e (2.1) S = flexural stiffness after the n load cycles; S O = initial flexural stiffness; e = natural algorithm to the base e b = constant from regression analysis 17
21 N = number of load cycles Equation (2.1) was then modified to determine the number of loading cycles to achieve 50% of the initial flexural stiffness. This was conducted for the five different applied strain levels to provide a regression equation in the form of Equation (2.2). N f k 1 t k 2 = ε (2.2) where, N f = number of loading repetitions until fatigue failure (50% of the initial stiffness) k 1, k 2 = regression coefficients depending on material type and test conditions ε t = tensile strain Table 2.3 shows the fatigue results for Epoxy Asphalt samples tested. Table 2.4, which contains the fatigue results from the previously tested PG76-22 I-5 mix, is also shown for comparative purposes. The fatigue lives of the Epoxy Asphalt samples, for the different tensile strain levels, are far greater than those achieved by the PG76-22 I-5 samples. Figure 2.4 shows the fatigue life (N f ) Tensile Strain (ε t ) relationship. Obviously, the higher the regression curve, the more fatigue-type loading the material can withstand before failing due to fatigue cracking. Table 2.3 Flexural Beam Fatigue Results for Epoxy Asphalt Samples Epoxy Asphalt Tensile Strain Air Voids Initial Stiffness, S Cycles to Failure, N O f, 50% (μ strain) (%) (MPa) Slope, b ,194,016 10, E ,818,123 10, E ,359,429 9, E ,440,498 8, E ,626,222 7, E-08 Table 2.4 Flexural Beam Fatigue Results for I-5, 6.3% AC Samples I-5, 6.3% AC Tensile Strain Air Voids Initial Stiffness, S Cycles to Failure, N O f, 50% (μ strain) (%) (MPa) Slope, b ,123, E ,216, E , E , E , E-05 18
22 1,000,000,000 Cycles to Failure (N f, 50% ) 100,000,000 10,000,000 1,000, ,000 10,000 I-5, 6.3% AC Epoxy Asphalt N f = k 1 (1/ε t ) k2 Epoxy 6.3% AC k 1 = E-08 k 2 = , Tensile Strain (mm/mm) Figure 2.4 Fatigue Properties of Epoxy Asphalt and PG76-22 I-5 Samples (6.3% AC) It should be noted that the fatigue lives of the 200 and 400 micro-strain Epoxy Asphalt samples were highly dependent on the Power Law regression used (meaning that they could be a little more or less). This is mainly due to the extremely high fatigue lives (> 100,000,000 cycles) and the relatively short testing times (only up to 3.5 million cycles or 3 weeks). 2.3 Discussion of Results Epoxy HMA for George Washington Bridge The permanent deformation and fatigue resistance properties of an Epoxy Asphalt mix were determined using advanced material characterization testing procedures. The permanent deformation properties were evaluated using the Repeated Load Permanent Deformation test procedure as described by NCHRP 465. The flexural fatigue properties were evaluated using the Flexural Beam Fatigue device and test procedure described in AASHTO T321. For comparative purposes, a previously tested PG76-22 I-5 mix was also shown. Based on the performance testing, the following conclusions were drawn: From the flow number (F N ), permanent deformation slope (b), and the accumulated permanent strain at the 1,000 th loading cycle (ε P ) properties determined from the permanent deformation testing, the Epoxy Asphalt mix was found to be more rut resistant than the PG76-22 I-5 mix. 19
23 The flexural beam fatigue tests showed that the Epoxy Asphalt mix has excellent fatigue properties, especially when compared to the PG76-22 I-5 mix. The direct comparison of the fatigue life at each tensile strain shows the Epoxy Asphalt has a fatigue life of 2 to 3 orders of magnitude greater than the PG76-22 I-5 mix. When directly comparing the 900 micro-strain test results, which researchers have indicated closely simulates the actual movement in steel orthotropic bridge decks (Medani et al, 2004), the Epoxy Asphalt has a fatigue life of 3 orders of magnitude greater than the PG76-22 I-5 mix (Figure 2.5). 100,000 Flexural Stiffness (MPa) 10,000 1,000 PG76-22 I-5 (6.3% AC) n f,50% = 17,712 Epoxy Asphalt n f,50% = 16,626, E E E E E E E+07 Loading Cycles (n) Figure 2.5 Fatigue Life of Epoxy Asphalt and PG76-22 I-5 (6.3% AC) at 900 Microstrains 20
24 3.0 ROSPHALT 50 PERFORMANCE EVALUATION FOR THE GEORGE WASHINGTON BRIDGE The Rosphalt 50 hot mix asphalt (R-50) was evaluated for both permanent deformation and flexural fatigue properties. The PANYNJ provided two different mix designs proposed for use with the Rosphalt material. The first design was conducted to a design air void level of 1%, while the second design was conducted to a design air void level of 3%. The PANYNJ requested testing conducted at the design air void level and 2.0% above design air void level for the flexural fatigue tests. Permanent deformation testing was only conducted on the 1% design air void level mix. For the flexural fatigue testing, a Flexural Beam Fatigue device described by AASHTO 321, was used to evaluate the fatigue properties of the R-50 designed and compacted in four different manners; 1) R-50 designed at 1% air voids and tested at 1% air voids, 2) R- 50 designed at 1% air voids and tested at 3% air voids, 3) R-50 designed at 3% air voids and tested at 3% air voids, and 4) R-50 designed at 3% air voids and tested at 5% air voids. The fatigue testing was conducted under a constant-strain test mode at a test temperature of 15 o C (59 o F). A haversine waveform was applied at a rate of 2 Hz (2 loads per second) and a magnitude of 900 micro-strains. The loading type described was supposed to simulate the typical loading and bending action on the orthotropic steel decks on the George Washington Bridge. For the Repeated Load Permanent Deformation testing, the permanent deformation properties of the HMA samples were measured by applying a 20 psi cyclic stress on a cylindrical sample that had been heated to 140 o F. The testing specifications followed those outlined in NCHRP 465. Permanent deformation testing was only conducted on the R-50 designed at 1% air voids and tested at 1% air voids and also the R-50 designed at 1% air voids and tested at 3% air voids, as requested by the PANYNJ. 3.1 Flexural Fatigue Test Results All samples were tested at a test temperature of 15 o C. The test specimens were tested until approximately 3,000,000 loading cycles, or until the specimen s flexural strength reached a pre-determined minimum value. Samples that were tested out until 3,000,000 cycles lasted 17 days due to the slower loading frequency (2 Hz or 2 loads per second). Testing was only conducted at 900 μ-strains due to the extremely, high fatigue resistance of the Rosphalt 50 material. Throughout the test, the flexural stiffness of the samples was calculated and recorded. The stiffness of the beams was plotted against the load cycles and the resulting data was fitted to an exponential function as follows (AASHTO T321): bn S = S O e (3.1) where, S = flexural stiffness after the n load cycles; 21
25 S O = initial flexural stiffness; e = natural algorithm to the base e b = constant from regression analysis N = number of load cycles Equation (3.1) was then modified to determine the number of loading cycles to achieve 50% of the initial flexural stiffness The test results for the four different Rosphalt 50 HMA mixes are shown in Figure 3.1 and Table 3.1. The flexural beam fatigue results show that as long as the compacted air voids are less than 3% air voids, the R-50 material will provide excellent fatigue resistance. Flexural Stiffness (MPa) 10,000 1,000 AASHTO T321, 15 o C, 2 Hz, 900 μ-strain 1% Air Void Design, 1% Air Void Compacted: Nf = 2,832,294 1% Air Void Design, 3% Air Void Compacted: Nf = 3,191,433 3% Air Void Design, 3% Air Void Compacted: Nf = 2,939,057 3% Air Void Design, 5% Air Void Compacted: Nf = 259, E E E E E E E E+08 Loading Cycles (n) Figure 3.1 Flexural Beam Fatigue Test Results for the Rosphalt 50 Material Table 3.1 Flexural Beam Fatigue Test Results for Rosphalt 50 Material Sample Type 1% Air Void Design, 1% Air Void Compacted 1% Air Void Design, 3% Air Void Compacted 3% Air Void Design, 3% Air Void Compacted 3% Air Void Design, 5% Air Void Compacted Air Voids Initial Stiffness, S O Fatigue Life, N Exp. Constant, b f, 50% (%) (MPa) (cycles) 1.4 1,347,7-2.45E-07 2,832, E-07 3,191, E-07 2,939, E ,538 22
26 3.2 Repeated Load Permanent Deformation Test Results Three samples each of the 1% design/tested at 1% air voids and 1% design/tested at 3% air voids were tested using the Repeated Load Permanent Deformation test. The permanent deformation properties used for evaluation/comparison, and outlined in NCHRP Report 465, were: 1. Flow Number (F N ) The larger the flow number, the more resistant the HMA mix is to permanent deformation; 2. Slope of the Linear Portion of the Permanent Strain vs Cycles Plot (b) The larger the slope, the greater the potential for rutting in the field and the faster the rutting accumulates; and 3. Accumulated Permanent Deformation at 1,000 Loading Cycles (ε P N = 1,000) The larger the e P 1,000 cycles, the greater the potential for rutting in the field. These three parameters were shown to provide the best correlation to measured field rutting (NCHRP 465) when conducting the repeated load permanent deformation test. The correlation results determined in NCHRP 465 are shown in Table 3.2. The table clearly shows that at the test temperature of 130 o F, the R 2 values for the 3 parameters when compared to measured field rutting were all greater than This should also correspond to the requested test temperature of 140 o F used in this study. Table 3.2 Results of Test Parameter Correlation to Field Rutting (NCHRP 465) A summary of the permanent deformation parameters are shown in Table 3 and the permanent deformation plots are shown in Figure 3.2 and Figure 3.3. Samples #1 and #2 were not used in the calculation of the average values. During the sample preparation process, coring in particular, both Sample #1 and #2 witnessed extreme bleeding of the asphalt binder and almost seized the core barrel during coring. It is believed that during 23
27 this coring process, as well as the extraction process of the samples from inside the core barrel, Sample #1 and Sample #2 may have been damaged. This is in agreement with the permanent deformation results shown in Table 3.3, Figures 3.2 and 3.3. A resolution to the excessive bleeding and seizing problem was quickly found by freezing the samples overnight prior coring. Table Summary of Test Results from the Repeated Load Permanent Deformation Test for Rosphalt HMA Sample Type 1% Air Void Design, 1% Air Void Compacted 1% Air Void Design, 3% Air Void Compacted Sample ID Air Voids Flow Number Permanent Strain (%) Slope (%) 1,000 10,000 Cycles (b) #1 1.2 > 20, #3 0.5 > 20, #6 0.7 > 20, Average 0.6 > 20, # , #4 2.7 > 20, #8 2.5 > 20, Average 2.6 > 20, Permanent Strain (%) % Air Void Design, 1% Compacted Air Voids Test Temp = 140 o F, Applied Stress = 20 psi Sample #1, 1.2% Air Voids Sample #3, 0.5% Air Voids Sample #6, 0.7% Air Voids 0 2,000 4,000 6,000 8,000 10,000 12,000 14,000 16,000 18,000 20,000 Number of Loading Cycles Figure 3.2 Permanent Deformation Plots of 1% Air Void Design and 1% Air Void Compacted 24
28 Permanent Strain (%) % Air Void Design, 3% Compacted Air Voids Test Temp = 140 o F, Applied Stress = 20 psi Sample #2, 2.9% Air Voids Sample #4, 2.7% Air Voids Sample #8, 2.5% Air Voids 0 2,000 4,000 6,000 8,000 10,000 12,000 14,000 16,000 18,000 20,000 Number of Loading Cycles Figure 3.3 Permanent Deformation Plots of 1% Air Void Design and 3% Air Void Compacted The results of the permanent deformation testing indicated that: The flow number (F N ) of the 1% Air Void Compacted mix and 3% Air Void Compacted mix were shown to both be >20,000 loading cycles. It should be noted that the testing procedure used in the study was held to a maximum of 20,000 loading cycles. The slope of the permanent strain curve (b) for the 1% Air Void Compacted mix was found to be slightly less than that of the 3% Air Void Compacted mix. This would indicate that the 1% Air Void Compacted mix would accumulate permanent deformation at a lesser rate when compared to the 3% Air Void Compacted mix. The permanent deformation measured at the 1,000 th loading cycle for the 1% Air Void Compacted mix was slightly lower than the 3% Air Void Compacted mix. This would indicate that the 1% Air Void Compacted mix would accumulate a lesser amount of permanent strain than the 3% Air Void Compacted mix. 3.3 Asphalt Pavement Analyzer Test Results Although not part of the testing plan, the Asphalt Pavement Analyzer (APA) was also used to determine the rutting potential of the Rosphalt HMA. The APA is a loaded wheel testing unit that tests the rutting potential of HMA by running a loaded wheel over a pressurized hose which lies directly on the HMA samples. The testing was conducted 25
29 using a 100 psi pressurized hose with a 100 lb wheel load being applied to the hose. All testing was conducted at 147 o F (64 o C). To compare the test results, the APA rutting at 8,000 loading cycles is typically used by industry for comparative purposes. All Rosphalt 50 samples tested were compacted to the same target air voids as the Repeated Load Permanent Deformation tests. The APA tests results are shown in Figure 3.4. The results indicate that the 1% Air Void Design, 1% Air Void Compacted samples is slightly less susceptible to rutting than the 1% Air Void Design, 3% Air Void Compacted samples. APA Rutting (mm) o C Test Temp.; 100 psi Hose Pressure; 100 lb Wheel Load APA 8,000 Loading Cycles 1% Air Void Design, 1% Air Void Compacted = 1.45mm 1% Air Void Design, 3% Air Void Compacted = 1.96mm 0 2,000 4,000 6,000 8,000 10,000 12,000 14,000 16,000 18,000 20,000 Number of Loading Cycles Figure 3.4 Asphalt Pavement Analyzer Test Results for Rosphalt 50 Samples 3.4 Discussion of Results Rosphalt 50 for the George Washington Bridge The permanent deformation and fatigue resistance properties of the Rosphalt 50 materials were determined using advanced material characterization testing procedures. The permanent deformation properties were evaluated using the Repeated Load Permanent Deformation test procedure as described by NCHRP 465, as well as the Asphalt Pavement Analyzer. The flexural fatigue properties were evaluated using the Flexural Beam Fatigue device and test procedure described in AASHTO T321. Based on the performance testing, the following conclusions were drawn: The Flexural Beam Fatigue test results showed that the Rosphalt 50 material should provide excellent fatigue resistance when the compacted air voids are less 26
30 than 3% for the mixes evaluated in this study. The one sample, 3% Air Void Design, 5% Air Void Compacted, had the lowest fatigue life of 259,538 cycles, while the other three samples had a fatigue life one order of magnitude greater. The Repeated Load Permanent Deformation testing showed that 1% Air Void Design, 1% Air Void Compacted had a slightly better rutting resistance than the 1% Air Void Design, 3% Air Void Compacted samples. The same conclusion was drawn from the Asphalt Pavement Analyzer testing. A summary of all the samples that have been tested to date regarding the rehabilitation of the George Washington Bridge is provided. 27
31 3.5 Summary of Test Results for All Materials Evaluated for the George Washington Bridge Table 3.4 Summary of Flexural Beam Fatigue Tests Conducted at 900 μ-strains Sample Type R-50 1% Air Void Design, 1% Air Void Compacted R-50 1% Air Void Design, 3% Air Void Compacted R-50 3% Air Void Design, 3% Air Void Compacted R-50 3% Air Void Design, 5% Air Void Compacted Air Voids Initial Stiffness, S O Fatigue Life, N Exp. Constant, b f, 50% (%) (MPa) (cycles) 1.4 1,347,7-2.45E-07 2,832, E-07 3,191, E-07 Epoxy HMA 1.4 7, E-08 2,939, E ,538 16,626,222 I-5, PG76-22, 5.9% AC 5.8 3, E-05 11,558 I-5, PG76-22, 6.3% AC 5.1 2, E-05 17,712 Table 3.5 Summary of Repeated Load Permanent Deformation Tests Sample Type R-50 1% Air Void Design, 1% Air Void Compacted R-50 1% Air Void Design, 3% Air Void Compacted Epoxy HMA I-5, PG76-22, 5.9% AC I-5, PG76-22, 6.3% AC Sample ID Air Voids Flow Number Permanent Strain (%) Slope (%) 1,000 10,000 Cycles (b) #3 0.5 > 20, #6 0.7 > 20, Average 0.6 > 20, #4 2.7 > 20, #8 2.5 > 20, Average 2.6 > 20, # > 20, # > 20, # > 20, Average 1.85 > 20, A 5.6 1, > C 5.8 1, > E 5.8 1, > Average 5.8 1, > B 4.7 1, > C 5.3 1, > D 5.1 1, > Average 5.2 1, >
32 APA Rutting (mm) Test Temp. = 64C (147F), 100 psi Hose Pressure, 100 lb Wheel Load Rosphalt (1% AV, 3% AV) = 1.96 mm Epoxy Mix, 2% AV = 0.43 mm I-5, 5.9% AC, 6% AV = 2.47 mm I-5, 6.3% AC, 5% AV = 2.48 mm Rosphalt (1% AV, 1% AV) = 1.59 mm ,000 4,000 6,000 8,000 10,000 12,000 14,000 16,000 18,000 20,000 Loading Cycles Figure 3.5 Asphalt Pavement Analyzer Test Results 29
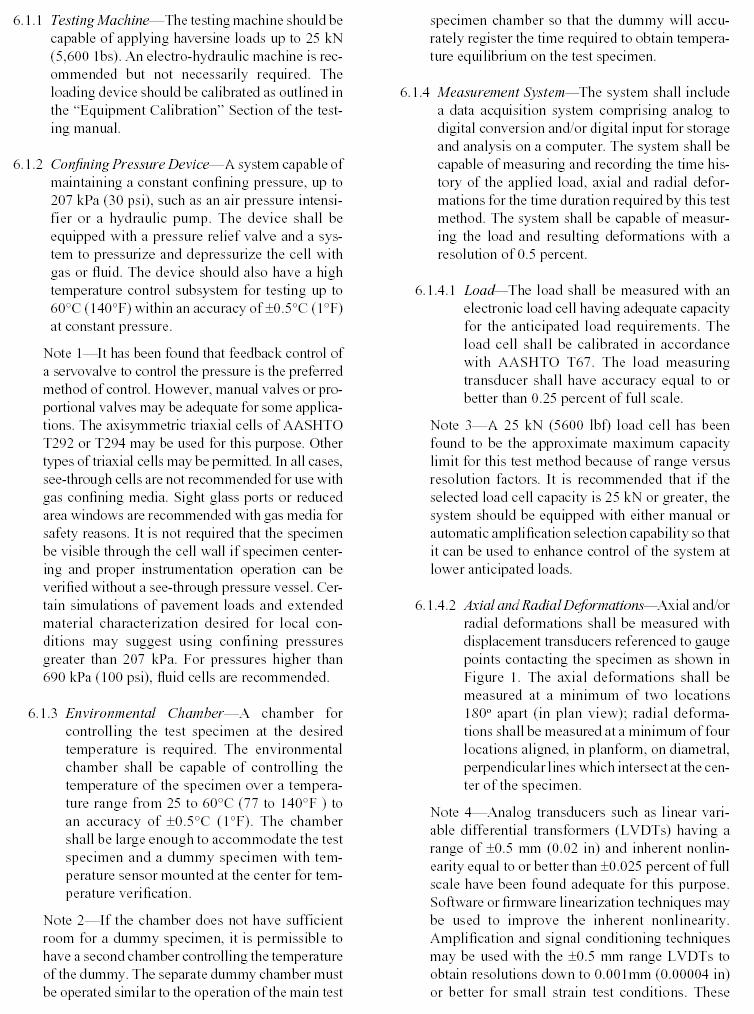
33 4.0 EVALUATION OF HMA INTERFACE BONDING The scope of work encompassed testing the bond strength between successive HMA lifts that were placed on a runway at Newark Liberty International Airport. Visual surveys indicated that sections of the runway that contained a Granite/Gneiss had significant debonding (Figures 4.1 and 4.2). The debonding at the HMA lift interface caused the top section of the runway to slide in the same direction where excessive breaking and turning of the aircrafts occurred. The Superpave Shear Tester (SST) was used to simulate typical loading conditions found in the field (Figure 4.3). This consisted of applying a shear and axial stress on the specimen at the same time, called biaxial loading. The biaxial loading condition models the applied stress due to a moving, yet breaking, wheel load over the asphalt section. The axial and shear stresses were applied in a cyclic manner at a rate of 2 Hz (0.5 second load duration) with a 1 second rest period at a test temperature of 100 o F. Results of the testing indicated that the Granitic Gneiss samples, on average, debonded after 3,384 cycles, while the Trap Rock samples showed no evidence of debonding within the 10,000 loading cycle period. This trend corresponds to the field observations of the Granite/Gneiss section debonding on the runway. 4.1 Laboratory Evaluation of HMA Interface Bond Strength Runway cores taken from Newark Liberty International Airport were delivered to the Rutgers Asphalt Pavement Laboratory (RAPL) for sample preparation and testing. Sample preparation encompassed trimming the cores samples to a final specimen height of 2 inches. This allowed for 1 inch of asphalt to be above and below the lift interface. The specimens were first tested for their respective bulk specific gravity (AASHTO T166) and the remaining HMA from the cores were used to determine the maximum specific gravity (AASHTO T209). The results of the specimens are shown in Table 4.1. Table 4.1 Bulk and Maximum Specific Gravity Properties of the Specimens Sample # Bulk Specific Gravity Maximum Specific Gravity Air Voids (g/cm 3 ) (g/cm 3 ) (%) Trap Rock # * 3.9 Trap Rock # * 3.8 Trap Rock # * 4.3 Trap Rock Average = 4.0 Granite/Gneiss # * 3.7 Granite/Gneiss # * 3.1 Granite/Gneiss # * 3.5 Granite/Gneiss Average =


34 Figure 4.1 Slipping at Newark Airport Middle of Paving Lane Figure 4.2 Slipping at New Airport Longitudinal Joint 31
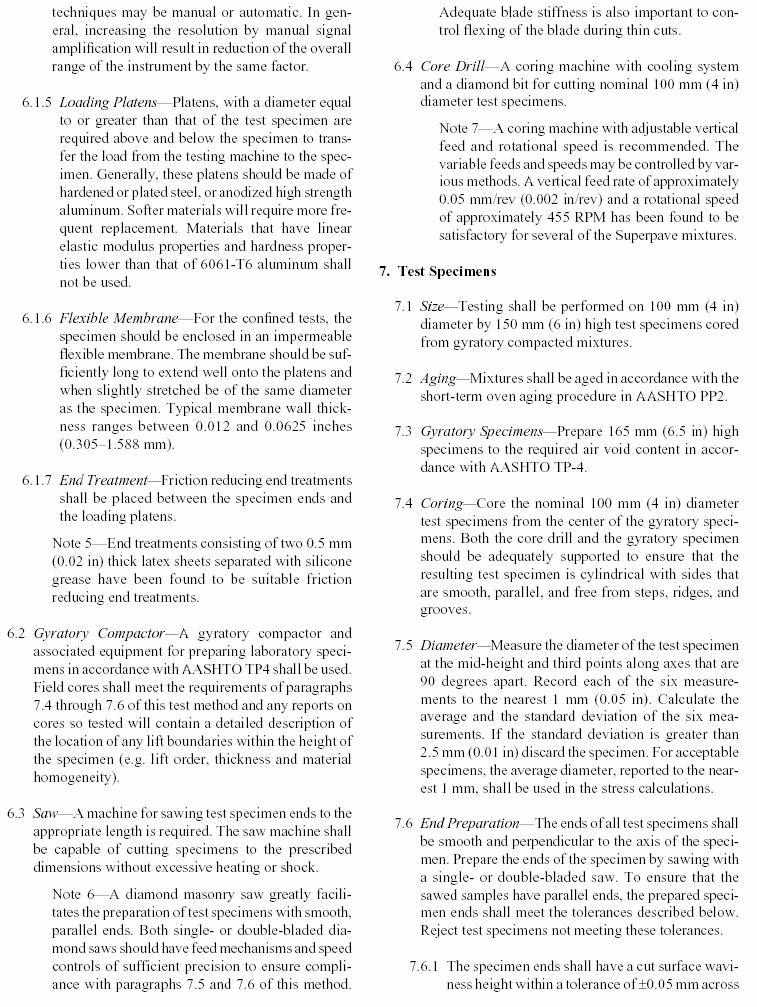
35 Axial Force (Wheel Load) Shear Force (Braking) Shear at Interface Interface Axial Stress Asphalt Sample Aluminum Platens Interface Shear Stress Figure 4.3 Comparison of Field Stress and Laboratory Applied Stress Conditions 32
. Figure 4.")
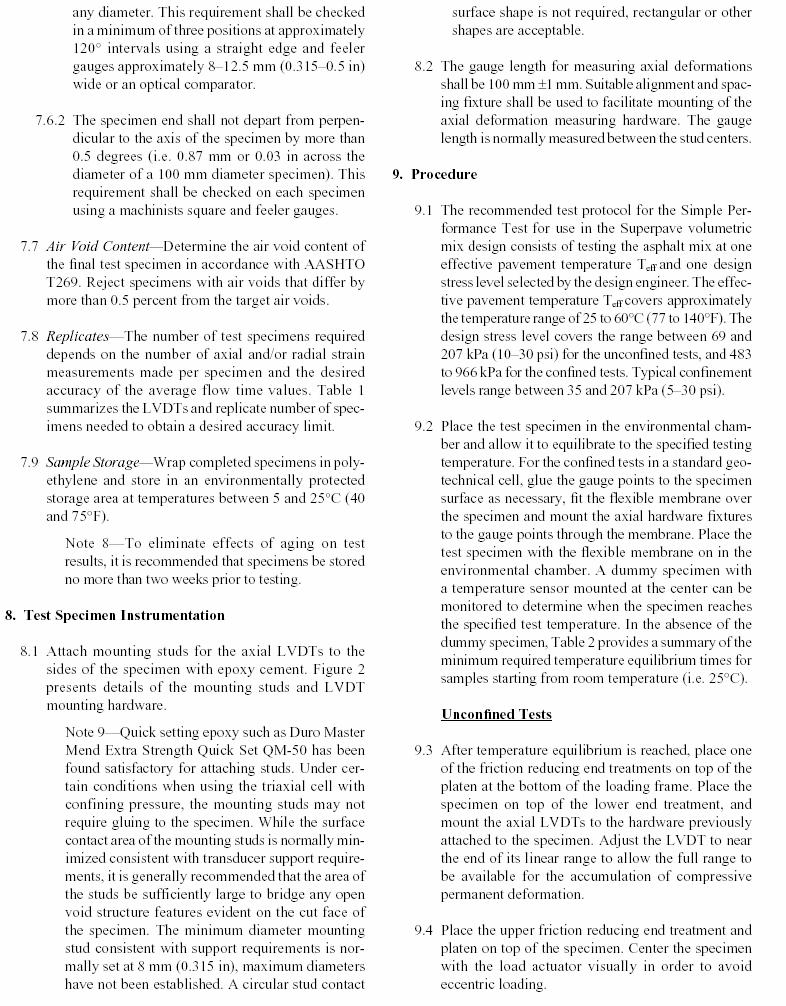
36 Before testing, each specimen was placed in the environmental chamber of the SST for a minimum of 4 hours at a test temperature 100 o F. After the 4 hour conditioning time, the samples were clamped in the SST unit for bond strength testing (Figure 4.4). Figure 4.4 Superpave Shear Tester (SST) The test specimens were instrumented with 2 Linear Variable Differential Transducers (LVDT s) to measure the change in height (axial strain) and change in horizontal distance (shear strain). The shear strain measured in the SST device would model the horizontal movement of the HMA layer, while the axial strain would model the vertical separation of the two layers. The test procedure used for the testing consisted of the following: Test temperature = 100 o F Loading Frequency = 2 Hz (or the load pulse was applied in 0.5 seconds) Rest Period = 1 second (the time in-between each applied load) Applied Shear Stress = 15 psi Applied Axial Stress = psi Applied Stress Ratio (Axial : Shear) = 1.25 Number of Loading Cycles = 10,000 33
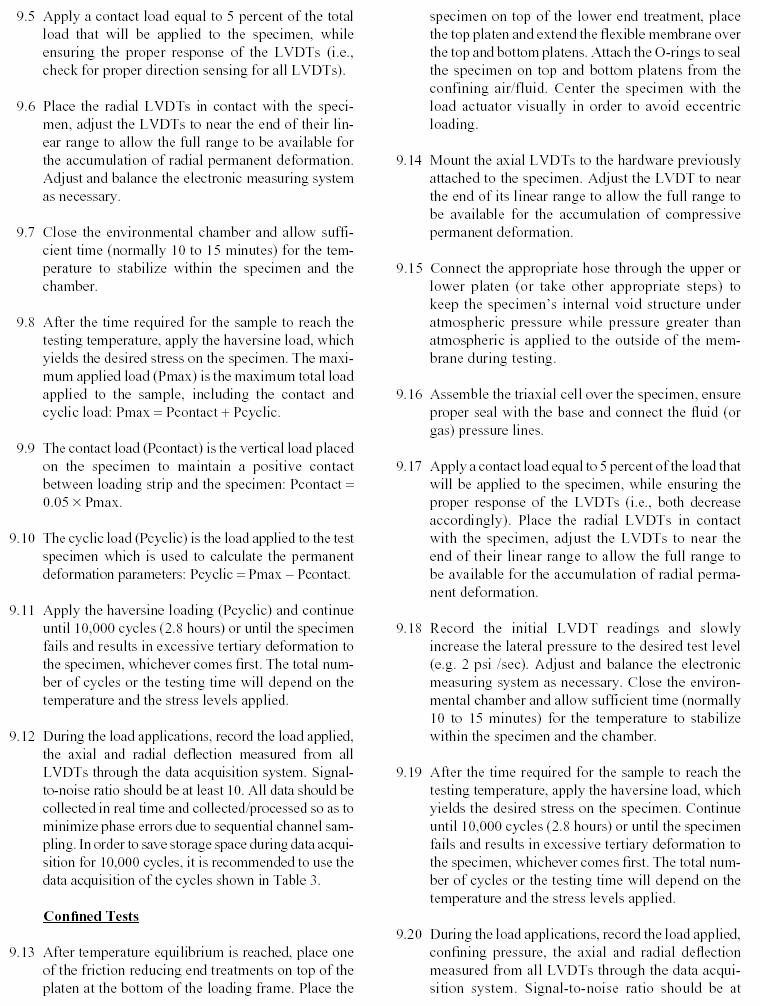
37 The test results for the Granite/Gneiss aggregate samples are shown in Figures 4.5 through 4.7. There are two distinct changes in the performance of the Granite/Gneiss samples that indicate the interface bond had been broken. 1. Sudden Change in the Slope of the Permanent Shear Strain Curve As the sample is being loaded in the shear direction, permanent shear strain starts to develop. This is typical for most HMA samples due to this shear-type of loading and it simulates permanent deformation (rutting). However, what is not typical of the Shear Strain curve, shown as the Black line in the figures, is that there is a sudden jump at a particular point in the loading. This sudden jump signifies the start of where the rate of permanent shear strain becomes greater (i.e. the rate at which the sample deforms in the horizontal direction increases). This point at which the sudden increase occurs is where the bond at the interface has been broken and results in a faster accumulation of shear strain due to the weakened plain. 2. Sudden Change in the Slope of the Axial Strain Curve As the bond at the interface of the sample begins to break, there is a sudden increase in the axial strain (increase in sample height) due to the aggregates from each layer starting to move over one another. The axial strain curve, once the break has occurred, also continues to increase (distance between HMA lifts continues to move apart from one another). Based on the above two criteria for the indication of the interface bond break, a comparison of the three Granite/Gneiss samples shows that the interface bond broke between 2,800 and 4,450 cycles, with an average of 3,384 loading cycles until the interface bond breaks. When evaluating the same performance curves for the Trap Rock aggregate samples (Figures 4.8 through 4.10), there was no indication that a bond had been broken. In fact, the Trap Rock samples perform in an identical manner to HMA samples that do not have a bonded interface. This indicates a strong interface bond where the two HMA lifts perform in a manner that would represent one single layer in the field. 34
38 Permenant Shear Strain (%) Granite/Gneiss Aggregate - Sample #1 Stress Ratio = 1.25 (Axial psi: Shear 15 psi) Shear Strain Axial Strain Debonding/Dilation - Layers Starting to move off each other Horizontal Bond 2,800 Cycles Permanent Axial Strain (%) Loading Cycles Figure 4.5 Granite/Gneiss Core #1 5 Granite/Gneiss Aggregate - Sample #4 Stress Ratio = 1.25 (Axial psi: Shear 15 psi) Shear Strain 0.4 Permenant Shear Strain (%) Axial Strain Horizontal Bond 4,450 Cycles Debonding/Dilation - Layers Starting to move off each other Permanent Axial Strain (%) Loading Cycles Figure 4.6 Granite/Gneiss Core #4 35
39 Permenant Shear Strain (%) Granite/Gneiss Aggregate - Sample #5 Stress Ratio = 1.25 (Axial psi: Shear 15 psi) Shear Strain Axial Strain Horizontal Bond 2,900 Cycles Debonding/Dilation - Layers Starting to move off each other Permanent Axial Strain (%) Loading Cycles Figure 4.7 Granite/Gneiss Core #5 Permenant Shear Strain (%) Trap Rock Aggregate - Sample #3 Stress Ratio = 1.25 (Axial psi: Shear 15 psi) Shear Strain Axial Strain Permanent Axial Strain (%) Loading Cycles Figure 4.8 Trap Rock Core #3 36
40 Permenant Shear Strain (%) Trap Rock Aggregate - Sample #4 Stress Ratio = 1.25 (Axial psi: Shear 15 psi) Shear Strain Axial Strain Permanent Axial Strain (%) Loading Cycles Figure 4.9 Trap Rock Core #4 Permenant Shear Strain (%) Trap Rock Aggregate - Sample #5 Stress Ratio = 1.25 (Axial psi: Shear 15 psi) Shear Strain Axial Strain Permanent Axial Strain (%) Loading Cycles Figure 4.10 Trap Rock Core #5 37
41 5.0 INFLUENCE OF HIGH PG GRADE ON RUTTING POTENTIAL The scope of work encompassed evaluating the affect of different performance-graded asphalt binders on the rutting performance of a FAA #3 Surface Course Mix tested under repeated load conditions (permanent deformation testing). A FAA #3 mix design was developed at the Rutgers Asphalt Pavement Laboratory (RAPL) using aggregates supplied by Tilcon s Mt. Hope facility. Four different performance-graded asphalt binders where used in the study; 1) CITGO Fuel Resistant Binder (graded as a 94-22), 2) PG82-22, 3) PG76-22, and 4) PG All asphalt binders were supplied by CITGO Asphalt s Paulsboro, NJ facility. 5.1 Materials Used and Marshall Mix Design The aggregate gradation chosen was based on a preliminary mix design currently on the books at the Mt. Hope facility, and was approved by Port Authority of New York/New Jersey (PANYNJ) personnel. The gradation band was specified by the PANYNJ and is noted as Top Course Mix #3 in Section 02561, Asphalt Paving Concrete (FAA). The final gradation used in the study is shown in Figure 5.1. The materials supplied by the Tilcon Mt. Hope facility were used for a 75 Blow Marshall design. A design air void requirement of 4.0% was used. The 75 Blow Marshall mix design volumetrics are shown in Figure 5.2 for review. The optimum asphalt content selected for use in the study was 6.1%. The optimum asphalt content was determined using the PG76-22 asphalt binder and assumed to be the same for the remaining asphalt binders used in the study. Stability and Flow measurements were not conducted. 38
42 FAA #3 - Surface Mix Aggregate Gradation Percent Passing Blend 1 Blend 3 Blend 4 Blend Sieve Size (mm) Figure 5.1 Aggregate Gradation of FAA #3 Surface Course Mix Used in Study (Mt. Hope Aggregates) 39
43 Unit Weight (pcf) R 2 = % Asphalt % Air Voids y = x R 2 = % Asphalt Stability (lbs) % Voids Filled (VFA) R 2 = % Asphalt % Asphalt Flow (1/100 inches) % Voids in Mineral Agg. (VMA) % Asphalt AirVoid Spec = 4.0 % % Asphalt Optimum Asphalt Content Average = 6.1% Figure Blow Marshall Design Results for FAA #3 Surface Course Mix R 2 = Permanent Deformation Testing To evaluate the permanent deformation potential of the different mixes, repeated load testing was conducted using the Simple Performance Test (SPT) set-up. The SPT test set-up requires a sample be compacted using the gyratory compactor to 7 inches in height and 6 inches in diameter. After compaction, a final sample is cored out from the inside of gyratory sample and then trimmed using a masonry saw (Figure 5.3). Once the sample is trimmed, it is checked to verify the dimensions meet the tolerance as specified in AASHTO TP63. After the specimens were fabricated, three LVDT (linear variable differential transformers) were glued to the sides of the HMA specimen at 120 degrees apart with a final gage length of 100 mm (Figure 4). The samples were then heated to 140 o F. A dummy sample, instrumented with internal and skin thermocouples, was used to ensure the test sample obtained the required test temperature. Once temperature was achieved, 40


44 the samples were cyclically loaded using a haversine waveform. A deviatoric cyclic stress of 25 psi was applied for a duration of 0.1 seconds and then followed by a 0.9 second rest period. Figure 5.3 Sample Preparation for Repeated Load Using the SPT Set-up Figure 5.4 Instrumented Simple Performance Test Specimen 41
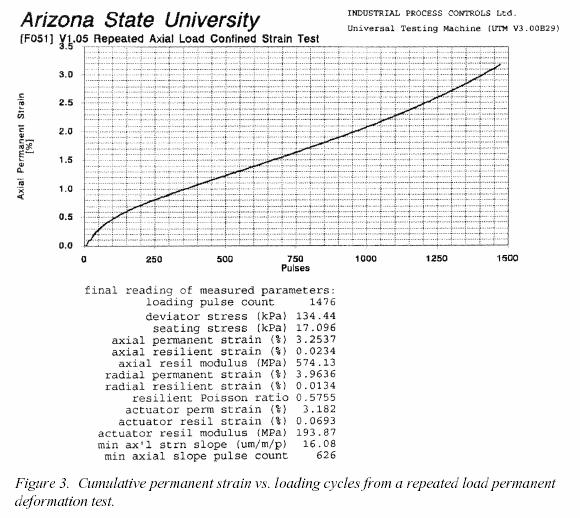
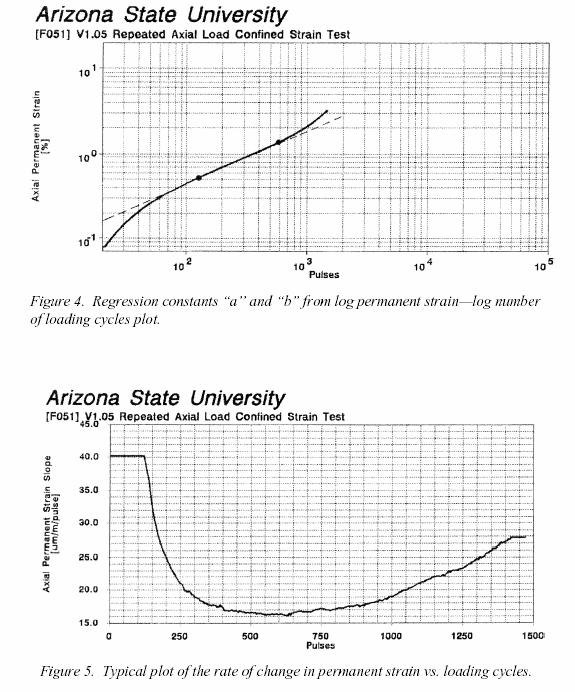
45 Three test properties are determined and compared from the repeated load testing: 7. Flow Number (F N ) The Flow Number is determined by plotting the rate of change of axial strain versus the number of loading cycles (Figure 5.5). The number of loading cycles pertaining to the part of the curve where the slope is zero is designated as the Flow Number. The larger the flow number, the more resistant the HMA mix is to permanent deformation; 8. Slope of the Linear Portion of the Permanent Strain vs Cycles Plot (b) The larger the slope, the greater the potential for rutting in the field and the faster the rutting accumulates (Figure 5.6); and 9. Accumulated Permanent Deformation at 1,000 Loading Cycles (ε P N = 1,000) The larger the ε P 1,000 cycles, the greater the potential for rutting in the field. Figure 5.5 Example of Flow Number During Repeated Load Test Figure 5.6 Example of Slope, b, During the Repeated Load Test These three parameters were shown to provide the best correlation to measured field rutting (NCHRP 465) when conducting the repeated load permanent deformation test. The correlation results determined in NCHRP 465 are shown in Table
 The table clearly shows that at the test temperature of 130 o F, the R 2 values for the 3 parameters when compared to measured")
46 Table 5.1 Results of Test Parameter Correlation to Field Rutting (NCHRP 465) The table clearly shows that at the test temperature of 130 o F, the R 2 values for the 3 parameters when compared to measured field rutting were all greater than This should also correspond to the requested test temperature of 140 o F used in this study. The SPT repeated loaded permanent deformation test results are shown in Table 5.2 and Figures 5.7, 5.8, 5.9, and A direct comparison of each of the test parameters is shown in Figures 5.11, 5.12 and The test results clearly show that as the hightemperature performance grade of the asphalt binder increases, the resistance to permanent deformation increases. Therefore, the best performing asphalt binder was the CITGO FR binder (PG94-22), and the poorest performing asphalt binder was the PG Table 5.2 Summary of Test Results from the Repeated Load Permanent Deformation Test for Laboratory Produced Mixes with Varying Asphalt Binder Grades Research Air Voids Flow Number, F N 1,000 10,000 Mix Type Sample ID Slope, b Phase (%) (cycles) (%) (%) FAA#3 Surface Mix, # >20, Blow, 6.1% AC, FR # >20, Binder, 4% # >20, AV Design Average , FAA#3 Surface Mix, # , Blow, 6.1% AC, # > 20, PG82-22 Binder, # , % AV Design Average , FAA#3 Surface Mix, # , Blow, 6.1% AC, # PG76-22 Binder, # % AV Design Average > 3.0 FAA#3 Surface Mix, # Blow, 6.1% AC, # PG64-22 Binder, # % AV Design Average > 3.0 > 3.0 * - For averaging purposes, a Flow Number of >20,000 was assumed as 20,000 FAA #3 Surface Course Mix with Varying Asphalt Binder Grades SPT Repeated Load Test Results (140 o F, 25 psi Applied Stress) 43
47 Vertical Strain (%) Test Temp = 140 o F, Applied Stress = 25 psi FAA #3 Surface Mix Design; 75 Blow Marshall Design; AC% = 6.1% Sample #1: 5.7% Air Voids Sample #5: 5.3% Air Voids Sample #6: 5.4% Air Voids 0 2,000 4,000 6,000 8,000 10,000 12,000 14,000 16,000 18,000 20,000 Number of Loading Cycles Figure 5.7 FAA #3 Surface Course Mix with CITGO Fuel Resistant Asphalt Binder Vertical Strain (%) Test Temp = 140 o F, Applied Stress = 25 psi FAA #3 Surface Mix Design; 75 Blow Marshall Design; AC% = 6.1% F N - Sample #6 F N - Sample #8 Sample #6: 6.0% AV Sample #7: 5.4% AV Sample #8: 5.9% AC 0 2,000 4,000 6,000 8,000 10,000 12,000 14,000 16,000 18,000 20,000 Number of Loading Cycles Figure 5.8 FAA #3 Surface Course Mix with PG82-22 Asphalt Binder (CITGO Asphalt) 44
48 Vertical Strain (%) Test Temp = 140 o F, Applied Stress = 25 psi FAA #3 Surface Mix Design; 75 Blow Marshall Design; AC% = 6.1% F N - Sample #3 F N - Sample #1 F N - Sample #2 Sample #1: 5.4% AV Sample #2: 5.7% AV Sample #3: 5.5% AV ,000 1,500 2,000 2,500 3,000 3,500 4,000 4,500 5,000 Number of Loading Cycles Vertical Strain (%) Figure 5.9 FAA #3 Surface Course Mix with PG76-22 Asphalt Binder (CITGO Asphalt) 3.00 Test Temp = 140 o F, Applied Stress = 25 psi FAA #3 Surface Mix Design; 75 Blow Marshall Design; AC% = 6.1% F N - Sample #2 F N - Sample #3 F N - Sample #1 Sample #1: 5.6% AV Sample #2: 5.3% AV Sample #3: 5.4% AV ,000 Number of Loading Cycles Figure 5.10 FAA #3 Surface Course Mix with PG64-22 Asphalt Binder (CITGO Asphalt) 45
49 22,500 20,000 > 20,000 FAA #3 Surface Course Mix 6.1% Binder Content Flow Number (F N ) 17,500 15,000 12,500 10,000 7,500 8,978 All Repeated Load Samples Compacted to 5.5% AV (+/- 0.5%) 5,000 2, CITGO FR PG82-22 PG76-22 PG64-22 Figure 5.11 Summary of Flow Number Results from Repeated Load Permanent Deformation Testing (Higher F N, Lower Rutting Potential) FAA #3 Surface Course Mix 6.1% Binder Content All Repeated Load Samples Compacted to 5.5% AV (+/- 0.5%) Rutting Slope, b CITGO FR PG82-22 PG76-22 PG64-22 Figure 5.12 Summary of Rutting Slope, b, Results from Repeated Load Permanent Deformation Testing (Higher b, Higher Rutting Potential) 46
50 3.5 Permanent 1,000 Cycles (%) FAA #3 Surface Course Mix 6.1% Binder Content All Repeated Load Samples Compacted to 5.5% AV (+/- 0.5%) > CITGO FR PG82-22 PG76-22 PG64-22 Figure Summary of Permanent 1,000 Loading Cycles from Repeated Load Permanent Deformation Testing (Higher Permanent Deformation, Higher Rutting Potential) 47
51 RELATED REFERENCES Carpenter, S., Ghuzlan, K., and Shen, S., 2003, A Fatigue Endurance Limit for Highway and Airport Pavements, Presented at the Annual Meeting of the Transportation Research Board, January, Monismith, C.L., Epps, J.A., Kasianchuk, D.A., and McLean, D.B., 1970, Asphalt Mixture Behavior in Repeated Flexure, Report No. TE 70-5, Insititute of Transportation and Traffic Engineering, University of California, Berkeley. Monismith, C.L., N. Ogawa, and C. Freeme, 1975, Permanent Deformation of Subgrade Soils Due to Repeated Loadings, Transportation Research Record 537, Transportation Research Board, National Research Council, Washington D.C. Witczak, M.W., K.E. Kaloush, T. Pellinen, M. El-Basyouny, and H. Von Quintus, 2002, Simple Performance Test for Superpave Mix Design, NCHRP Report
52 APPENDIX A SIMPLE PERFORMANCE TEST (REPEATED LOAD) SPECIFICATIONS 49
53 50
54 51
55 52
56 53
57 54
58 55
59 56
60 57
61 58
62 APPENDIX B TESTING SPECIFICATION FOR FLEXURAL BEAM FATIGUE TEST 59
63 60
64 61
65 62
Relating Hot Mix Asphalt Pavement Density to Performance. Dr. Walaa S. Mogawer, PI Dr. Jo Sias Daniel, Co PI Alexander J.
 Relating Hot Mix Asphalt Pavement Density to Performance Dr. Walaa S. Mogawer, PI Dr. Jo Sias Daniel, Co PI Alexander J. Austerman Prepared for The New England Transportation Consortium April 1 st, 2010
NCHRP UPDATE. Northeast Asphalt User/Producer Group. Burlington VT 20 October 2005
 NCHRP UPDATE Northeast Asphalt User/Producer Group Burlington VT 20 October 2005 1 SIMPLE PERFORMANCE TESTS (SPTs) FOR HMA MIX DESIGN 2 9-19: Superpave Support and Performance Models Management, SPTs for
Performance Related Specifications (PRS) in the Northeast Hot Mix Asphalt Perspective
 in the Northeast Hot Mix Asphalt Perspective") Performance Related Specifications (PRS) in the Northeast Hot Mix Asphalt Perspective SHRP2 Performance Specifications for Rapid Renewal (R07) Thomas Bennert, Ph.D., Rutgers University September 21, 2016
Performance Related Specifications (PRS) in the Northeast Hot Mix Asphalt Perspective SHRP2 Performance Specifications for Rapid Renewal (R07) Thomas Bennert, Ph.D., Rutgers University September 21, 2016
Balanced Asphalt Mixture Design A Formula for Success
 Balanced Asphalt Mixture Design A Formula for Success October 18, 2017 Hartford, Connecticut Shane Buchanan Discussion Items 1. What is Balanced Mix Design (BMD)? 2. Why the need for BMD? 3. What are the
Laboratory Testing of Vancouver HMA Mixes Containing Recycled Asphalt Shingles
 Laboratory Testing of Vancouver HMA Mixes Containing Recycled Asphalt Shingles Ludomir Uzarowski, Ph.D., P.Eng., Golder Associates Ltd., Whitby, Ontario Hana Prilesky, P.Eng., Golder Associates Ltd., Vancouver,
EVALUATING THE IMPACT OF LIME ON PAVEMENT PERFORMANCE
 EVALUATING THE IMPACT OF LIME ON PAVEMENT PERFORMANCE NATIONAL LIME ASSOCIATION Suite 800 200 N. Glebe Rd Arlington, VA 22203 www.lime.org 703 243-5463 Final Report June 9, 20 UNIVERSITY OF NEVADA RENO
Performances Evaluation of Cecabase RT in Warm Mix Asphalt Technology
 Available online at www.sciencedirect.com ScienceDirect Procedia - Social and Behavioral Scien ce s 96 ( 2013 ) 2782 2790 13th COTA International Conference of Transportation Professionals (CICTP 2013)
Materials for Civil and Construction Engineers
 Materials for Civil and Construction Engineers CHAPTER 9 Asphalt Binders and Asphalt Mixtures Bituminous Materials Asphalt Natural or Refined from petroleum oil Tar Asphalt Cement Cutback Emulsion 2 Source
Kodippily, S, Holleran, G, Holleran, I, Henning, TFP & Wilson, D 1
 Kodippily, S, Holleran, G, Holleran, I, Henning, TFP & Wilson, D 1 1 2 3 4 5 6 7 8 TRANSPORTATION RESEARCH BOARD 93 RD ANNUAL MEETING 2014 Title: Performance of Recycled Asphalt Pavement Mixes Comparing
An Overview of the New AASHTO MEPDG Pavement Design Guide
 2011 AZ Pavements / Materials Conference An Overview of the New AASHTO MEPDG Pavement Design Guide 15-16 November 2011 Arizona State University Tempe, Arizona Dr. M.W. Witczak Principal Pavement Consultant
Warm Mix Asphalt Evaluation Protocol. Brian D. Prowell, P.E. Graham C. Hurley
 Warm Mix Asphalt Evaluation Protocol Brian D. Prowell, P.E. Graham C. Hurley Why Warm Asphalt? Reduce production and laydown temperatures Reduce emissions Reduce energy costs Reduce aging of binder Other
FINAL REPORT COMPARISON OF SEVERAL ASPHALT DESIGN METHODS. G. W. Maupin, Jr. Principal Research Scientist
 FINAL REPORT COMPARISON OF SEVERAL ASPHALT DESIGN METHODS G. W. Maupin, Jr. Principal Research Scientist (The opinions, findings, and conclusions expressed in this report are those of the author and not
Design Aids of NU I-Girders Bridges
 Nebraska Transportation Center Report SPR-P1(09) P322 Final Report 26-1120-0042-001 Design Aids of NU I-Girders Bridges Kromel E. Hanna, Ph.D. Department of Civil Engineering University of Nebraska-Lincoln
Comparison of Performance Properties of Terminal Blend Tire Rubber and Polymer Modified Asphalt Mixtures
 Comparison of Performance Properties of Terminal Blend Tire Rubber and Polymer Modified Asphalt Mixtures Alireza Zeinali 1, S.M.ASCE; Phillip B. Blankenship 2, PE; and Kamyar C. Mahboub 3, Ph.D., PE, F.ASCE
RESILIENT MODULUS TESTING OF OPEN GRADED DRAINAGE LAYER AGGREGATES FOR INTERLOCKING CONCRETE BLOCK PAVEMENTS
 RESILIENT MODULUS TESTING OF OPEN GRADED DRAINAGE LAYER AGGREGATES FOR INTERLOCKING CONCRETE BLOCK PAVEMENTS SUMMARY David Hein, P. Eng., Principal Engineer Applied Research Associates, Inc. 541 Eglinton
MECHANICAL PROPERTIES OF MIXTURES CONTAINING RAP
 MECHANICAL PROPERTIES OF MIXTURES CONTAINING RAP ISAP Working Group WG2: Meeting on Cold Recycling of RAP Elie Y. Hajj, Ph.D. Assistant Professor University of Nevada, Reno United States Fortaleza, Brazil
Laboratory Evaluation of Asphalt Concrete Mixtures Containing High Contents of Reclaimed Asphalt Pavement (RAP) and Binder
 and Binder") Laboratory Evaluation of Asphalt Concrete Mixtures Containing High Contents of Reclaimed Asphalt Pavement (RAP) and Binder http://www.virginiadot.org/vtrc/main/online_reports/pdf/15-r8.pdf PAUL C. BORIACK
Laboratory Evaluation of Asphalt Concrete Mixtures Containing High Contents of Reclaimed Asphalt Pavement (RAP) and Binder http://www.virginiadot.org/vtrc/main/online_reports/pdf/15-r8.pdf PAUL C. BORIACK
NUTC R211 A National University Transportation Center at Missouri University of Science & Technology
 Pultruded Composites Using Soy-based Polyurethane Resine by K. Chandrashekhara NUTC R211 A National University Transportation Center at Missouri University of Science & Technology Disclaimer The contents
Evaluation of FORTA Boeing Asphalt Mixture Using Advanced Material Characterization Tests
 Evaluation of FORTA Boeing Asphalt Mixture Using Advanced Material Characterization Tests Prepared by Kamil E. Kaloush, Ph.D., P.E. Assistant Professor Krishna P. Biligiri Maria Carolina Rodezno Luiz de
Targeting Quality Through Partnership
 Balanced Mix Design Is This The Future? Targeting Quality Through Partnership Shane Buchanan Oldcastle Materials Discussion Items Questions to be Answered 1. What is Balanced Mix Design (BMD)? 2. Why the
Asphalt Pavement Aging and Temperature Dependent Properties through a Functionally Graded Viscoelastic Model, Part-II: Applications
 Materials Science Forum Vols. 631-632 (2010) pp 53-58 (2010) Trans Tech Publications, Switzerland doi:10.4028/www.scientific.net/msf.631-632.53 Asphalt Pavement Aging and Temperature Dependent Properties
Foreword... iii Table of Contents...v List of Figures...vii List of Tables...viii. Chapter 1 : Background...1
 Foreword... iii Table of Contents...v List of Figures...vii List of Tables...viii Chapter 1 : Background...1 Introduction...1 Asphalt Mixtures... 2 Asphalt Binder Behavior... 2 Mineral Aggregate Behavior...
Impact of loading frequency on the fatigue behavior of SBS modified asphalt mixtures
 Available online at www.sciencedirect.com ScienceDirect Procedia - Social and Behavioral Scienc es 104 ( 2013 ) 69 78 2 nd Conference of Transportation Research Group of India (2nd CTRG) Impact of loading
Definition of HMA. In simple terms :
 Hot Mix Asphalt 101 Definition of HMA In simple terms : A mixture of asphalt binder and graded mineral aggregate, mixed at an elevated temperature and compacted to form a relatively dense pavement layer
Performance Characterization of Half Warm Mix Asphalt Using Foaming Technology
 Performance Characterization of Half Warm Mix Asphalt Using Foaming Technology V. S. Punith, A.M.ASCE 1 ; Feipeng Xiao ; and David Wingard 3 Downloaded from ascelibrary.org by Tongji University on 1/19/1.
Experimental investigation of the use of CFRP grid for shear strengthening of RC beams
 Journal of Asian Concrete Federation Vol. 2, No. 2, Dec. 2016, pp. 117-127 ISSN 2465-7964 / eissn 2465-7972 http://dx.doi.org/10.18702/acf.2016.12.2.2.117 Experimental investigation of the use of CFRP
Innovative SMA-MA mixture for bridge asphalt pavement
 Innovative SMA-MA mixture for bridge asphalt pavement Piotr Radziszewski 1, a, Michał Sarnowski 1, b, Jerzy Piłat 1, c, Paweł Mieczkowski 2, d, Karol J. Kowalski 1, e, Jan B. Król 1, f 1 Faculty of Civil
Overview. Mix Design with High RAP Contents SEAUPG 2010 ANNUAL CONFERENCE OKLAHOMA CITY, OK. December 7, 2010
 Overview High RAP Content Mix Design Southeast Asphalt User Producer Group OKC, Status of NCHRP 9 46 Preliminary Recommendations High RAP Mixes on the NCAT Test Track Mix Design with High RAP Contents
Balancing the Softening Effects of Asphalt Rejuvenators with Polymer Modified Asphalt in High RAP Content Mixtures
 Innovative Research in Asphalt Pavements Balancing the Softening Effects of Asphalt Rejuvenators with Polymer Modified Asphalt in High RAP Content Mixtures Dr. Walaa S. Mogawer, PE, F.ASCE Director - Highway
Idaho Transportation Department (ITD) Mohamed Zubery. Vince Spisak FHWA. By: Fouad Bayomy, PhD, PE. Department of Civil Engineering
 Mohamed Zubery. Vince Spisak FHWA. By: Fouad Bayomy, PhD, PE. Department of Civil Engineering") Acknowledgement: A Simple Fracture Test For HMA By: Fouad Bayomy, PhD, PE University it of Idaho Department of Civil Engineering 47 th Idaho Asphalt Conference October 25 th, 2007 Idaho Transportation
Acknowledgement: A Simple Fracture Test For HMA By: Fouad Bayomy, PhD, PE University it of Idaho Department of Civil Engineering 47 th Idaho Asphalt Conference October 25 th, 2007 Idaho Transportation
The dynamic response of Kansas Perpetual Pavements under vehicle loading. Stefan A. Romanoschi*, Andrew J. Gisi and Cristian Dumitru
 The dynamic response of Kansas Perpetual Pavements under vehicle loading by Stefan A. Romanoschi*, Andrew J. Gisi and Cristian Dumitru Stefan A. Romanoschi, Ph.D., P.E. Assistant Professor, Department
Nondestructive Evaluation of Four Sister Bridges in Virginia Using Manual NDE Technologies and Robotic Platform RABIT
 CAIT-UTC-059 Nondestructive Evaluation of Four Sister Bridges in Virginia Using Manual NDE Technologies and Robotic Platform RABIT Final Report July 2015 Jinyoung Kim Trung Duong Research Associate Kien
Overview. What is a Perpetual Pavement? Design Concept. PerRoad Pavement Design Software. Design Against Deep Structural Problems
 PerRoad Pavement Design Sotware SEAUPG Annual Meeting Nashville, TN December 13, 2 Overview Perpetual Pavements Deined Design Principles Design Sotware PerRoad 2.4 Case Study Bin-Bo Expressway, Shandong
Characterization and performance of high performance concrete for pavements
 Characterization and performance of high performance concrete for pavements D. G. Goulias Department of Civil and Environmental Engineering, University of Maryland, USA Abstract Several states in the U.S.
Reference data set for fatigue and stiffness properties by 4-point bending tests
 2 nd Workshop on Four Point Bending, Pais (ed.), 2009. University of Minho. ISBN 978-972-8692-42-1 Reference data set for fatigue and stiffness properties by 4-point bending tests E. Hauser Institute for
Introduction to Asphalt Pavement Design and Specifications
 Introduction to Asphalt Pavement Design and Specifications Ensuring Good Performance in Flexible Pavement Design and Construction: accomplished through: 1. Proper structural (thickness) design for the
Investigation of Low and High Temperature Properties of Plant-Produced RAP Mixtures
 Investigation of Low and High Temperature Properties of Plant-Produced RAP Mixtures by Ayesha Shah, Research Engineer and Rebecca S. McDaniel, Technical Director North Central Superpave Center Purdue University
STUDIES ON MARSHALL AND MODIFIED MARSHALL SPECIMENS BY USING CRMB
 Int. J. Struct. & Civil Engg. Res. 2014 Sk. Wasim Anwar, 2014 Research Paper ISSN 2319 6009 www.ijscer.com Vol. 3, No. 4, November 2014 2014 IJSCER. All Rights Reserved STUDIES ON MARSHALL AND MODIFIED
This article appeared in a journal published by Elsevier. The attached copy is furnished to the author for internal non-commercial research and
 This article appeared in a journal published by Elsevier. The attached copy is furnished to the author for internal non-commercial research and education use, including for instruction at the authors institution
Project Description US 30, Montpelier SCL to Dingle Rd. MP (3.22 Miles)
") Evaluation of Fiber Reinforced Asphalt Pavements Idaho Case Study US 3 at Montpelier, Idaho ITD Project Phase 1 (RP 237) Lab Evaluation of Materials Project Team: UI Fouad Bayomy (PI), Ahmed Muftah (Grad
Evaluation of Fiber Reinforced Asphalt Pavements Idaho Case Study US 3 at Montpelier, Idaho ITD Project Phase 1 (RP 237) Lab Evaluation of Materials Project Team: UI Fouad Bayomy (PI), Ahmed Muftah (Grad
Sensitivity Study of Design Input Parameters for Two Flexible Pavement Systems Using the Mechanistic-Empirical Pavement Design Guide
 Sensitivity Study of Design Input Parameters for Two Flexible Pavement Systems Using the Mechanistic-Empirical Pavement Design Guide Sunghwan Kim Department of Civil, Construction and Environmental Engineering
Tack Coat Materials and Methods for Optimizing for Thin HMA Applications
 Tack Coat Materials and Methods for Optimizing for Thin HMA Applications May 2011 2011 Road Science, LLC. BondTekk is a registered servicemark of Road Science, LLC. Objectives The presentation will describe
THE APPLICATION OF ASBUTON AND POLYMER MODIFIED BITUMEN FOR PAVEMENT MIXTURE DESIGN AT HOT AND ARID REGION
 THE APPLICATION OF ASBUTON AND POLYMER MODIFIED BITUMEN FOR PAVEMENT MIXTURE DESIGN AT HOT AND ARID REGION Mohammed I. D. Matar 1), Ary Setyawan 2), Kusno Adi Sambowo 3) Post Graduate Civil Engineering
Design of Superpave HMA for Low Volume Roads. Professor Walaa S. Mogawer, Ph.D. PE Rajib Mallick, Ph.D. PE
 Design of Superpave HMA for Low Volume Roads Professor Walaa S. Mogawer, Ph.D. PE Rajib Mallick, Ph.D. PE Prepared for The New England Transportation Consortium December 31 st, 2004 NETCR 51 NETC 01-03
Unique chemistries to help you build and maintain better roads. Anova Asphalt Solutions
 Unique chemistries to help you build and maintain better roads. Asphalt Solutions There s nothing better than seeing a newly paved road stretching for miles. Smooth blacktop for as far as the eye can see.
Go Stronger Go Longer Get FORTAfied!
 Go Stronger Go Longer Get FORTAfied! Program Sustainability / Udržitelnost Criteria for sustainable pavements / Kritéria pro udržitelné vozovky Transportation and climate change / Doprava a klimatické
Dynamic Shear Rheometer: DSR
 1 Dynamic Shear Rheometer: DSR Load Dynamic loading vs. static loading. Load Load Time Time Time Static Loading Dynamic Loading Types of loading. Compression, area is normal to load direction Tension,
Mogawer, Austerman, & Roussel 1. Performance Characteristics of Asphalt Rubber Mixtures Containing RAP and Warm Mix Asphalt Technology
 Mogawer, Austerman, & Roussel Performance Characteristics of Asphalt Rubber s Containing RAP and Warm Mix Asphalt Technology Dr. Walaa S. Mogawer, P.E. Corresponding Author Civil and Environmental Engineering
Performance Graded (PG) Asphalts
 Asphalts") Performance Graded (PG) Asphalts A Driving Force In Asphalt SUPERPAVE Update for NJDOT/NEAUPG Mechanistic Pavement Design Seminar Princeton, NJ - Feb. 25, 2003 What is SUPERPAVE? New Asphalt Binder specification
Performance Graded (PG) Asphalts A Driving Force In Asphalt SUPERPAVE Update for NJDOT/NEAUPG Mechanistic Pavement Design Seminar Princeton, NJ - Feb. 25, 2003 What is SUPERPAVE? New Asphalt Binder specification
THE STRENGTH AND STIFFNESS MODULUS OF THIN LAYER HOT MIX ASPHALT CONCRETE AT VARIOUS TEMPERATURE
 THE STRENGTH AND STIFFNESS MODULUS OF THIN LAYER HOT MIX ASPHALT CONCRETE AT VARIOUS TEMPERATURE Abdulhakim Mustafa Elshawesh 1), Ary Setyawan 2), Sholihin As ad 3) Post Graduate Civil Engineering ProgramsUniversitas
New HMA Products and Trends for NJDOT
 New HMA Products and Trends for NJDOT Bridge Deck Water-Proof Wearing Course (BDWC) Water Proof Wearing Course Mix Mix designed to provide a thin, rut and fatigue resistance mixture for bridge deck overlays
CIV204 MATERIALS OF CONSTRUCTION (2+2 ECTS 6)
") CIV204 MATERIALS OF CONSTRUCTION Aims of the Course (2+2 ECTS 6) To provide students comprehensive information on the basic engineering properties of most common construction materials. To introduce technologies
CIV204 MATERIALS OF CONSTRUCTION Aims of the Course (2+2 ECTS 6) To provide students comprehensive information on the basic engineering properties of most common construction materials. To introduce technologies
PERFORMANCE CHARACTERIZATION OF HIGH ASPHALT BINDER REPLACEMENT WITH RECYCLED ASPHALT SHINGLES (RAS) FOR A LOW N-DESIGN MIXTURE
 FOR A LOW N-DESIGN MIXTURE") Ozer, Al-Qadi, Kanaan, and Lippert 0 0 0 PERFORMANCE CHARACTERIZATION OF HIGH ASPHALT BINDER REPLACEMENT WITH RECYCLED ASPHALT SHINGLES (RAS) FOR A LOW N-DESIGN MIXTURE Hasan Ozer, Imad L. Al-Qadi, Ahmad
Ozer, Al-Qadi, Kanaan, and Lippert 0 0 0 PERFORMANCE CHARACTERIZATION OF HIGH ASPHALT BINDER REPLACEMENT WITH RECYCLED ASPHALT SHINGLES (RAS) FOR A LOW N-DESIGN MIXTURE Hasan Ozer, Imad L. Al-Qadi, Ahmad
Rutting Causes Analysis on Yi-Huai-Jiang Expressway
 ASCE 2011 3585 Rutting Causes Analysis on Yi-Huai-Jiang Expressway Jian LI 1, Fujian NI 2, Xiang MA 3, Cheng LING 4 1 College of Transportation Engineering, Southeast University, 2# Sipailou, Nanjing,
Typical Dynamic Modulus Data for HMA Mixture and EMC SQUARED Stabilized Aggregate Mixture
 Dynamic modulus is the main input required for design of Hot Mix Asphalt (HMA) pavements using the nationally recognized AASHTO Mechanistic-Emperical Pavement Design Guide (MEPDG). HMA pavement materials
DEVELOPMENT OF CRITICAL FIELD PERMEABILITY AND PAVEMENT DENSITY VALUES FOR COARSE-GRADED SUPERPAVE PAVEMENTS
 NCAT Report 1-3 DEVELOPMENT OF CRITICAL FIELD PERMEABILITY AND PAVEMENT DENSITY VALUES FOR COARSE-GRADED SUPERPAVE PAVEMENTS By L. Allen Cooley Jr. E. Ray Brown Saeed Maghsoodloo September 21 277 Technology
Guideline for the Implementation of the Mechanistic Empirical Pavement Design Guide (MEPDG) for the Concessionary NovaDutra
 for the Concessionary NovaDutra") Guideline for the Implementation of the Mechanistic Empirical Pavement Design Guide (MEPDG) for the Concessionary NovaDutra 7 th Brazilian Congress on Highways and Concessions (CBR&C) Maria Carolina Rodezno
Guideline for the Implementation of the Mechanistic Empirical Pavement Design Guide (MEPDG) for the Concessionary NovaDutra 7 th Brazilian Congress on Highways and Concessions (CBR&C) Maria Carolina Rodezno
Advances in Tes,ng of Asphalt Pavements & Materials. Randy West NCAT Director
 Advances in Tes,ng of Asphalt Pavements & Materials Randy West NCAT Director 1 Some Tests I ll Talk About Bond Strength Three- Wheel Polishing Device Load- Related Cracking Tests Bending Beam FaDgue Texas
Design and Evaluation of WMA
 Design and Evaluation of WMA Brandon Milar Technical Marketing Manager Summary 1. What is Warm Mix Asphalt (WMA)? 2. Why are we shifting to WMA? 3. How do we produce WMA? 4. Implementation 5. WMA/RAP/RAS
Determination of Structural Layer Coefficient for Roadway Recycling Using Foamed Asphalt
 Determination of Structural Layer Coefficient for Roadway Recycling Using Foamed Asphalt Final Report Submitted to the Recycled Materials Resource Center University of New Hampshire Submitted by Brian
MECHANICAL CHARACTERIZATION OF SANDWICH STRUCTURE COMPRISED OF GLASS FIBER REINFORCED CORE: PART 1
 Composites in Construction 2005 Third International Conference Lyon, France, July 11 13, 2005 MECHANICAL CHARACTERIZATION OF SANDWICH STRCTRE COMPRISED OF GLASS FIBER REINFORCED CORE: PART 1 S.V. Rocca
Evaluation of Laboratory Performance Tests for Cracking of Asphalt Pavements
 Evaluation of Laboratory Performance Tests for Cracking of Asphalt Pavements 50 th Mid-Atlantic Quality Assurance Workshop 2015 FHWA Cooperative Study at Asphalt Institute Phillip B. Blankenship Senior
Materials Selection in Pavement Design. Flexible Pavements
 Materials Selection in Pavement Design Flexible Pavements Pavement Design AASHTO Pavement Design Guide (1993) AASHTOWare Pavement ME Dr. Witczak Traffic = 100 Trucks/day Over 20 Years (730,000 ESAL s)
IMPACTS OF HOT IN-PLACE RECYCLING TECHNIQUES IN PAKISTAN
 IMPACTS OF HOT IN-PLACE RECYCLING TECHNIQUES IN PAKISTAN Dr. Salahuddin Azad National University of Science and Technology Pakistan Abstract A hot in-place recycling (HIR) technique was employed for the
ASSESSMENT OF CRACK SEALING MATERIALS AND TECHNIQUES FOR EPOXY ASPHALT PAVEMENT ON STEEL BRIDGE DECKS
 Chen, Qian and Luo 0 0 0 ASSESSMENT OF CRACK SEALING MATERIALS AND TECHNIQUES FOR EPOXY ASPHALT PAVEMENT ON STEEL BRIDGE DECKS Leilei Chen, Ph.D.Candidate Intelligent Transportation System Research Center
Effects of Hot Plant Fuel Characteristics and Combustion on Asphalt Concrete Quality
 SD2001-13-X Connecting South Dakota and the Nation South Dakota Department of Transportation Office of Research Effects of Hot Plant Fuel Characteristics and Combustion on Asphalt Concrete Quality Study
Top-Down Fatigue Cracking Initiation & Propagation
 AF2903 Road Construction and Maintenance Royal Institute of Technology, Stockholm Top-Down Fatigue Cracking Initiation & Propagation Yared Hailegiorgis Dinegdae PhD Student in Highway and Railway Engineering
Balanced Mix Design: The Need and the Process. Dave Newcomb Division Head, Materials & Pavements Texas A&M Transportation Institute
 Balanced Mix Design: The Need and the Process Dave Newcomb Division Head, Materials & Pavements Texas A&M Transportation Institute How have asphalt materials changed? 1901 2000 Age of Uncomplicated Almost
INNOVATIVE HYBRID WEARING SURFACES FOR FRP BRIDGE DECKS
 16 TH INTERNATIONAL CONFERENCE ON COMPOSITE MATERIALS INNOVATIVE HYBRID WEARING SURFACES FOR FRP BRIDGE DECKS Riyad S. Aboutaha Syracuse University Keywords: FRP decks, bridge decks, wearing surfaces Abstract
Traffic Safety Measures Using Multiple Streams Real Time Data
 CAIT-UTC-055 Traffic Safety Measures Using Multiple Streams Real Time Data FINAL REPORT January 2017 Submitted by: Mohsen Jafari Professor of Industrial and Systems Engineering Center for Advanced Infrastructure
STRUCTURAL BEHAVIOR OF BITUMINOUS CONCRETE OVERLAY ON CEMENT CONCRETE PAVEMENT
 STRUCTURAL BEHAVIOR OF BITUMINOUS CONCRETE OVERLAY ON CEMENT CONCRETE PAVEMENT B. R. Marwah, Indian Institute of Technology, India; and S. K. Khanna and M. G. Arora, University of Roorkee, India The use
AN INNOVATIVE DUCTILE COMPOSITE FABRIC FOR STRENGTHENING CONCRETE STRUCTURES. Abstract
 AN INNOVATIVE DUCTILE COMPOSITE FABRIC FOR STRENGTHENING CONCRETE STRUCTURES Nabil F. Grace, Lawrence Technological University, Southfield, MI George Abdel-Sayed, University of Windsor, Windsor, ON Wael
Texas Transportation Institute The Texas A&M University System College Station, Texas
 1. Report No. FHWA/TX-05/9-1502-01-P5 2. Government Accession No. 3. Recipient's Catalog No. 4. Title and Subtitle GUIDELINES FOR DEVELOPING INPUT PARAMETERS OF ENHANCED VESYS5 PROGRAM 5. Report Date August
Assessment of Nondestructive Testing Technologies for Quality Control/Quality Assurance of Asphalt Mixtures
 Tech Transfer Summaries Institute for Transportation 3-2015 Assessment of Nondestructive Testing Technologies for Quality Control/Quality Assurance of Asphalt Mixtures Jeramy C. Ashlock Iowa State University,
Development of a Simple and Fast Test Method for Measuring the Durability of Portland Cement Pervious Concrete
 PCA R&D Serial No. SN3149 Development of a Simple and Fast Test Method for Measuring the Durability of Portland Cement Pervious Concrete by Qiao Dong, Hao Wu, Baoshan Huang, Xiang Shu, and Kejin Wang Portland
DESIGN OF BITUMINOUS MIXTURES
 Test Procedure for DESIGN OF BITUMINOUS MIXTURES TxDOT Designation: Tex-204-F Effective Date: August 2016 1. SCOPE 1.1 Use the methods in this procedure to determine the proper proportions of approved
MECHANICAL RESPONSE OF SUPERPAVE RECYCLED HOT MIXTURES IN ONTARIO
 MECHANICAL RESPONSE OF SUPERPAVE RECYCLED HOT MIXTURES IN ONTARIO Xiomara Sanchez, Ph.D., Assistant Professor and D.C. Campbell Chair in Highway Construction and Pavement Research Department of Civil Engineering
REHABILITATION OF UNBOUND GRANULAR PAVEMENTS. Improved design criteria for each region based on precedent performance throughout each network
 REHABILITATION OF UNBOUND GRANULAR PAVEMENTS Improved design criteria for each region based on precedent performance throughout each network IMPROVED DESIGN CRITERIA FOR EACH REGION One of the more widely
The Influence of the Binder Viscosity on the Laboratory Short Term Aging
 Available online at www.sciencedirect.com Procedia - Social and Behavioral Sciences 53 ( 2012 ) 421 431 SIIV - 5th International Congress - Sustainability of Road Infrastructures The Influence of the Binder
Impact of Repeated Load on Crack Healing Cycles of Asphalt Concrete
 American Journal of Traffic and Transportation Engineering 2016; 1(3): 26-33 http://www.sciencepublishinggroup.com/j/ajtte doi: 10.11648/j.ajtte.20160103.11 Impact of Repeated Load on Crack Healing Cycles
GlasGrid Asphalt Pavement Reinforcement. October 21, 2016
 GlasGrid Asphalt Pavement Reinforcement October 21, 2016 Introduction to Cracks Crack sources are numerous and varied Cracks are consistent pavements aren t Solutions for cracks have had mixed results
Evaluation of Application of Roller Compacted Concrete versus Asphalt Concrete as Pavement Surface Layer for High Traffic Volume Routes
 J. Basic. Appl. Sci. Res., 3(5)330-335, 2013 2013, TextRoad Publication ISSN 2090-4304 Journal of Basic and Applied Scientific Research www.textroad.com Evaluation of Application of Roller Compacted Concrete
DEVELOPMENT OF HIGH PERFORMANCE ASPHALT CONCRETE USING LOW QUALITY AGGREGATES
 DEVELOPMENT OF HIGH PERFORMANCE ASPHALT CONCRETE USING LOW QUALITY AGGREGATES ABSTRACT Viktors Haritonovs, Martins Zaumanis, Janis Tihonovs, Juris Smirnovs Riga Technical University, Department of Roads
High Temperature Characteristics of Modified Asphalt Binders
 High Temperature Characteristics of Modified Asphalt Binders By: Jake Sumeraj University of Illinois at Urbana-Champaign 11/26/2016 Executive Summary Two separate modified binders were obtained, one modified
Technical Notes 39A - Testing for Engineered Brick Masonry - Determination of Allowable Design Stresses [July/Aug. 1981] (Reissued December 1987)
![Technical Notes 39A - Testing for Engineered Brick Masonry - Determination of Allowable Design Stresses [July/Aug. 1981] (Reissued December 1987)](/thumbs/75/72632512.jpg "Technical Notes 39A - Testing for Engineered Brick Masonry - Determination of Allowable Design Stresses [July/Aug. 1981] (Reissued December 1987)") Technical Notes 39A - Testing for Engineered Brick Masonry - Determination of Allowable Design Stresses [July/Aug. 1981] (Reissued December 1987) INTRODUCTION Prior to the development of a rational design
Technical Notes 39A - Testing for Engineered Brick Masonry - Determination of Allowable Design Stresses [July/Aug. 1981] (Reissued December 1987) INTRODUCTION Prior to the development of a rational design
Eퟤ ect of Short Aramid Fibers on Asphalt Performance
 Eퟤ ect of Short Aramid Fibers on Asphalt Performance 2 FEB 2017 BY SAEED BADELI, SAEED SALIANI AND ALAN CARTER Abstract It is well known that asphalt materials are more resistant in compression than in
PAVEMENT DESIGN BACKGROUND PLEASE NOTE:
 PAVEMENT DESIGN BACKGROUND In a New Zealand first Road Science can now manufacture EME structural asphalt mixes. RS EME is a very stiff, high rut resistant structural asphalt mix that was developed in
10,000. Peak Connection Strength, lb/ft 8,000 6,000 4,000 2,000
 Test Methods: ASTM D6638 & NCMA SRWU-1 Test Facility: Geogrid Type: Miragrid 8XT Test Date: December 16, 2011 Block Type: Positive Connection (PC) Block CONNECTION STRENGTH TEST DATA (a) Test Normal Peak
AUSTROADS Pavement Design
 AUSTROADS Pavement Design Dr Bryan Pidwerbesky Group Technical Manager Fulton Hogan Ltd Load, W P 0 P 0 Pavement P 1 Subgrade P 1 2 Load, W Pavement Subgrade Compression Tension 3 Pavement Life Cycle Strategies
Testing of Bond Coat Emulsions
 National Pavement Preservation Conference Nashville, TN Testing of Bond Coat Emulsions August, 2012 Arlis Kadrmas BASF Corporation 1 Testing of Tack/Bond Emulsions Presentation Outline Definition of a
Agenda ASU s experience in testing and evaluation of FRAC
 Fiber Reinforced Asphalt Pavements 54th ANNUAL IDAHO ASPHALT CONFERENCE October 23, 2014 Moscow, Idaho Kamil E. Kaloush, Ph.D., P.E. Agenda ASU s experience in testing and evaluation of FRAC Fiber Reinforced
Comparison of Bitumen Fatigue Testing Procedures Measured in Shear and Correlations with Four-Point Bending Mixture Fatigue
 2 nd Workshop on Four Point Bending, Pais (ed.), 2009. University of Minho. ISBN 978-972-8692-42-1 Comparison of Bitumen Fatigue Testing Procedures Measured in Shear and Correlations with Four-Point Bending
Barry Paye, PE Wisconsin DOT WAPA Annual Conference
 Barry Paye, PE Wisconsin DOT WAPA Annual Conference Why are our pavements turning grey so quickly? Our pavements don t seem to last as long as they used to. How come our pavements crack so quickly? Is
High RAP Asphalt Mixes and Asphalt Mixes with Shingles
 High RAP Asphalt Mixes and Asphalt Mixes with Shingles Pennsylvania Asphalt Pavement Association 56 th Annual Conference Hershey, PA January 27, 2016 Mansour Solaimanian Penn State University 1 Outline
Superpave Design Guidelines for Using Hot-Mix Recycled Asphalt Pavement and Recycled Asphalt Shingles
 APPENDIX H Superpave Design Guidelines for Using Hot-Mix Recycled Asphalt Pavement and Recycled Asphalt Shingles Recycling Hot-Mix Asphalt and Recycling Manufacturer Waste Asphalt Roofing Shingles General
Specialty Expansion Joint Systems
 www.dsbrown.com Specialty Expansion Joint Systems Bridges Expansion Joint Systems for Architectural, Parking Garage and Bridge Applications Bridge the World with Leading Infrastructure Solutions Corporate
Sulphur s Place in CE Foundation Performance Association, Houston
 Sulphur s Place in CE Foundation Performance Association, Houston Gary L. Fitts, P.E. SE Regional Manager Garden Ridge, TX DELIVERING INNOVATION TO YOUR ADVANTAGE http://www.shell.com/sulphur Presentation
COLD IN-PLACE RECYCLING (CIR) Starting with what is there i.e. in situ materials
 Starting with what is there i.e. in situ materials") COLD IN-PLACE RECYCLING (CIR) Starting with what is there i.e. in situ materials Definitions: ARRA (Asphalt Recycling/Reclaiming Ass.) Cold In-Place Recycling (CIR) is the on-site recycling process to
COLD IN-PLACE RECYCLING (CIR) Starting with what is there i.e. in situ materials Definitions: ARRA (Asphalt Recycling/Reclaiming Ass.) Cold In-Place Recycling (CIR) is the on-site recycling process to
Field Load Testing of the First Vehicular Timber Bridge in Korea
 Field Load Testing of the First Vehicular Timber Bridge in Korea Ji-Woon Yi Ph.D. Student Department of Civil & Environmental Engineering Seoul National University Seoul, Korea jwyi@sel.snu.ac.kr Wonsuk
FINAL REPORT. Prepared by
 FATIGUE OF STUD SHEAR CONNECTORS IN THE NEGATIVE MOMENT REGION OF STEEL GIRDER BRIDGES: A SYNOPSIS OF EXPERIMENTAL RESULTS AND DESIGN RECOMMENDATIONS FINAL REPORT Prepared by Magnus L. R. Carlsson and