Phase Transformations Workshop David Laughlin
|
|
|
- Maud McLaughlin
- 5 years ago
- Views:
Transcription
1 Phase Transformations Workshop David Laughlin Materials Science and Engineering Carnegie Mellon University Pittsburgh, PA 15213
2 Outline What is a Phase? Heterogeneous / Homogeneous Transformations Nucleation Thermodynamics Free Energy Phase Diagram Phase Rule Lever Rule Order parameter
3 Kinetics Arrhenius s law Diffusion TTT curves Nucleation Rate Johnson / Mehl / Avrami Driving Force Al Cu System Coarsening Spinodal Decomposition Disorder / Order Combined SD and Order The CuNiSn System
4 Definition A phase is a physically distinct region of a system which has attained thermodynamic equilibrium, and which has a specific set of parameters (h 1, h 2,..) which specify its physical properties. Such parameters are called order parameters and include composition, structure, atomic order, magnetic order, etc. A change of phase occurs when one or more of its order parameters changes discontinuously.
5 Types of Solid State Phase Transformations Reconstructive (grain boundary reaction) Replacive (atomic ordering) Displacive (martensite)
6 There are Two Basic Kinds of Transformations Homogeneous and Heterogeneous Homogeneous Transformations are those which occur at every part of the system and at the same time. Usually the process occurs in degrees Heterogeneous Transformations occur at specific sites in the system leaving the rest of the system untransformed.
7 Precipitation is a Heterogeneous Transformation α α + β The b phase forms at some places and not others
8
9 Heterogeneous Transformations Homogeneously Nucleated or Heterogeneously Nucleated In homogeneous nucleation, all sites of the system have the same probability of transforming Not so in heterogenous nucleation: some sits are favored
10 Heterogeneous Nucleation is more frequently encountered Dislocations Special Sites include: Grain boundaries Surfaces Structural defects like stacking faults
11 Tools used to understand Phase Transformations include: Thermodynamics Kinetics Crystallography Microstructure Properties electrical resistivity
12 Thermodynamics Why is a certain phase stable? Lowest Energy? So if atoms in a gas are brought together to form a condensed phase, their energy is lowered. What about the other direction? Condensed phases do become gases. Is the energy lowered in this case?
13 No! Why do gases form form condensed phases? ENTROPY! That famous word which cause undergraduate students (and others as well) to quake! The ENTROPY of the Universe is always increasing! (But not everywhere all the time!)
14 A Phase Change occurs as a compromise between the ENERGY and the ENTROPY of the system. At low Temperatures: ENERGY At High Temperatures: ENTROPY The trasnsformation Temperature is where they are equally important>
15 Gibbs pointed this out and defined a function he called Free Energy A U - TS G H - TS A is called the Helmholtz Free Energy G is called the Gibbs Free Energy
16 Precipitation from solid solution can be understood from this point of view. At high temperature entropy dominates, and equilibrium is single phase with all solute atoms dispersed throughout the matrix. At low temperatures energy dominates, so atoms come out of solution and form phases with lower configurational entropy.
17 This fact helps to explain allotropic transformations as well. Usually the high temperature phase is the one with higher entropy, which often correlates with the crystal structure Ti HCP and BCC Co is FCC at high temperature (high symmetry) and HCP at low T Fe BCC FCC BCC here the low T BCC is ferromagnetic!
18 Gibbs Free Energy G G = G (T, P, composition) G Liquid Solid Tm T G T = -S 0 The phase with the greatest slope has the highest entropy and is therefore the HIGH TEMPERATURE Phase
19 Free energy versus Temperature Curves for solid, liquid and gas phases of a material at one composition. Note that the envelope of the lowest free energy determines the equilibrium phase. S to L at T m L to G at T v
20 First note the curvature of the Free Energy curves Positive implies stability 2 G 2 c 0
21 if negative, the phase would decompose!
22 Now look at two or more phases BASIC PRINCIPLE: Equilibrium is obtained by the lowest free energy may be one phase or it may be two phases.
23
24 Gibbs Equilibrium Phase Rule P + F = C + 2 where P is the number of phases C is the number of components F is the number of degrees of freedom this is derived by equating the chemical potentials of all the phases in equilibrium
25 Application of the Phase Rule 1+F=2+1; F=2 X and T T L A α α + β β A % B B T E 2 + F = 2+1 F = 1 either x or T 3+F = F = 0
26 The Lever Rule T A L Alloy of Co at T 1 How much β? α α + β β T B T E C Co C β α A % B B w/o β = 100 (C ο -C α )/(C β -C α )
27 A series of free energy curves showing how a phase diagram is developed from free energy curves at different temperatures
28 Phase Diagram with an Intermediate Phase Note the T 0 curves
29
30 Order Parameters Another thermodynamic parameter (besides composition) exists in many alloys, which measures the degree of order within a phase. The order may be atomic ordering or it may be magnetic ordering etc. For perfect order, all A atoms at 000 and all B atoms at the center of cell
31 But this is not always the case. Sometimes only 72% of the A atoms may be at 000 and 28% of them in the center of the cell. The crystal is still ordered, but not completely so η = r F A 1 F A A
32 Two kinds of Order- Disorder Transitions First and Higher Order Sometimes called discontinuous and Continuous Transitions
33 Free Energy vs. Order Parameter for a First Order transition Note that away from equilibrium the transition can become continuous!
34 Free Energy vs. order parameter and composition. Note that at some compositions the reaction is continuous and others it is not.
35 Precipitation of an ordered phase showing regions of instability. On cooling, a disordered phase becomes unstable with respect to ordering below T i
36 Now let us look at the Free Energy of the b phase Up to now we assumed the phase was in equilibrium with the a phase. This means that we assumed the effects of surface energy and strain energy were neglected! G b = g b V If we include the surface energy: G b = g b V + s A where g b free energy unit vol. V volume A surface area s surface energy per unit area
37 For a spherical particle V = 4/3 p r 3 A = 4 p r 2 Thus, since G b = g b V + s A G b / V = g b + s 3/r For large r same as before For small r, the free energy is larger
38 Let us look at how this affects phase equilibria β coh G α W β inc A B C inc C coh
39 Thus smaller particles have a higher solubility The phase diagram can look like:
40 Now the same kind of thing happens for the addition of the strain energy term G b = g b V + s A + W V where W is the strain energy per unit volume This also raises the free energy curve of the precipitate phase A strained phase has greater solubility in the matrix than an unstrained one.
41 Kinetics How fast does a phase form This is often more important than what phase is the equilibrium one! I = K exp( -Dg * /kt) I is the rate of nucleation Dg * is barrier to nucleation (all precipitation reactions have a barrier to their initiation)
42 Let us look at the form of this equation rate = K exp( -Q/kT) as T increases, the rate increases or as Q decreases, the rate increases Q is called activation energy The equation is Arrhenius law
43 Typical plots are as shown below The slope is -Q/R Rate 1/T
44 Another important equation that has this form is the one for the temperature dependence of the diffusion coefficient D = D O exp( - Q RT D ) Here, Q D is the activation energy for diffusion which in substitutional solid solutions is usually the sum of the activation energies of the formation of vacancies and the motion of vacancies
45 Time-Temperature-Transformation Time T No transformation Transformation nearly complete The lower region follows Arrhenius law. Why not the upper?
46 Look at the nucleation rate equation I = K exp( -Dg * /kt) As the temperature approaches the transition temperature, Dg * gets larger and larger because it is equal to Dg * = 16 p s 3 / 3 Dg v 2 and Dg v goes to zero at the transition temperature
47 Time-Temperature-Transformation Time T No transformation Transformation nearly complete Importance of quench rate Knee of the curve, etc
48 X = 1 - exp( -kt n ) This equation is sometimes called the Johnson/Mehl/ Avrami equation
49 X = 1 - exp( -kt n ) Thus dx dt = nkt n-1 (1 - X) Also d 2 dt X 2 = (n - 1)nkt n-1 (1 - X) + knt n-1 (- dx ) dt Set equal to zero to find the inflection point t n = n - 1 nk or X = 1 - exp( - n - 1 ) n
50 Back to the Nucleation rate equation Dg * = 16 p s 3 / 3 Dg v 2 Note the importance of the surface energy term, s and the driving force term, Dg v Let us look at Dg v How do we obtain this value? From the Free Energy Curves!
51 Note that the value of Dg v is largest for the more stable phase. At first sight it looks like this means that the barrier to nucleation is smallest for the stable phase. BUT we must look at the surface energy term! This term comes in as a cubic. This is the secret to why less stable phases form faster than stable ones! It is almost always because the surface energy term of the less stable is smaller than that of the stable phase. Hence the value of the barrier to nucleation, Dg * is smaller!
52 The Al-Cu system exemplifies this very well
53 Different crystal structures of metastable phases in Al-Cu alloys. Note the similar lattice parameters of the metastable phases to the Al matrix. This gives small surface energy.
54 Note how the least stable phase (GP) is he one which forms first. This is because it is most like the Al matrix.
55 How do we get smaller values of the surface energy? Coherent interfaces usually have smaller values of s Ordered phases bases on the matrix phase can be coherent and therefore have smaller surface energies. In CuNiSn the phases L1 2 and DO 22 are crystallographic derivatives of the FCC solid solution. Thus they have small surface energies and can precipitate faster,
56 We have assumed up to now homogeneous nucleation. What happens if nucleation occurs on a special site? There is a decrease in the effective s term which increase the kinetics! In general the equation: G b = g b V + s A + W V shows that we can lower the barrier by either nucleating on a special site and thereby lower the surface energy or by nucleating on a site with strain energy and lower the overall strain energy of the system. Hence dislocations and grain boundaries act as special sites!
57 Such nucleation is called heterogeneous nucleation. Grain Boundary reactions are heterogeneous Spinodal Decomposition on the other hand is homogeneous, occurring within the grains at all sites.
58 Crystallography The crystallography of a phase greatly affects its thermodynamics and the kinetics of formation Example: d in Al-Li alloys d has the L1 2 structure. Since it is a crystallographic derivative of FCC, it can form coherently on all faces with the Al matrix. Thus its surface energy is low and hence it will nucleate very fast! The same is true for (CuNi) 3 Sn L1 2 phase
59 Coarsening Early Theories Deal With the Kinetics (r) 3 -(r o ) 3 = kt k D g X e
60 Note the proper way to plot this! 3 3 r - r o Time NOT r vs ln(t), because the term r o may be important
61 This equation was derived under severe assumptions: zero volume fraction of second phase ideal solution thermodynamics spherical precipitates no strain effects random distribution BUT it seems to hold well for many cases.
62 Free Energy Construction for the Driving Force for Coarsening
63 Note that the gradient that exists which gives rise to the diffusion of solute comes from the differences between the composition of phases due to their size: For two particles of size r 1 < r 2 we have X X 2 X1 X 2gVm = 1+ RTr 2gVm 1 = 1+ ( - RT r r 2 ) Thus for r 1 < r 2 X 1 > X 2 so solute will flow from the smaller particle to the larger one!
64 Three parameters that control rate of coarsening D, the diffusion constant of solute in the matrix g the surface energy of the precipitates X e the solubility of the solute in the matrix
65 Homogenization During solidification the solute is not able to maintain equilibrium with respect to the matrix. This is due to the small values of diffusion in the solid state relative to diffusion in the liquid. There are two kinds of segregation: positive and negative. These are defined below
66 For this case k = X S /X L < 1.
67 If the solidus and solvus have the opposite slope, k > 1. T k =X S /X L X L X S
68 Homogenize Within One Hour? X Dt X X = (10 6mm -14 m s s) Now if D is changed to 10 X = 60mm -12 To make D larger we go to higher T
69 1 D D T T if 1 D D T T if )) T 1 T 1 ( R Q exp( D D ) RT Q exp( D D ) RT Q exp( D D T T 1 2 T T T T 2 o T 1 o T > < < > - - = - = - =
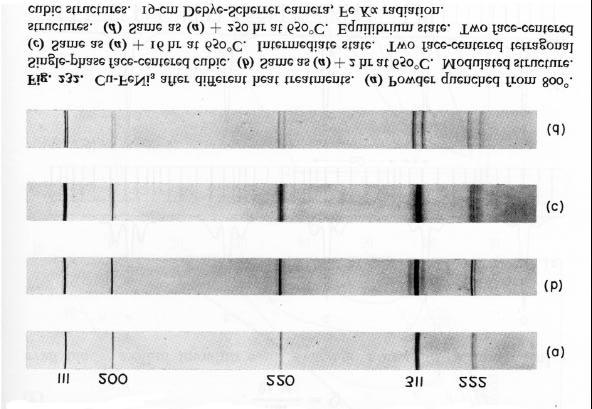
70 Spinodal Decomposition Early History Gibbs On the Equilibrium of Heterogeneous Substances (1874) CuNiFe, Daniel & Lipson, 1943,4 Hillert, MIT thesis (1956) Cahn and Hilliard (1958)
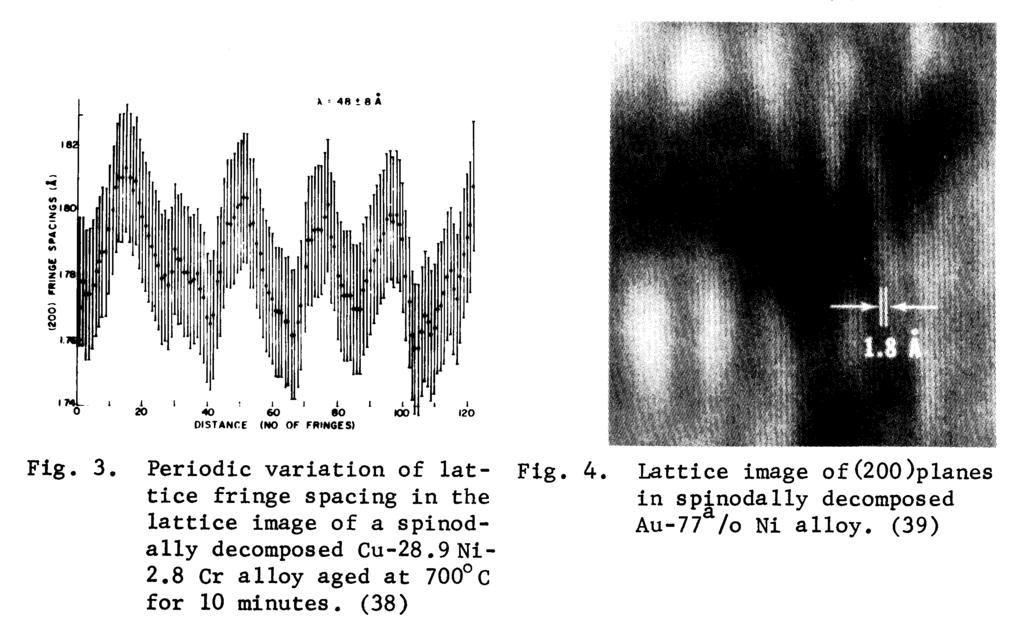
71
72 The negative curvature signals instability with respect to decomposition!
73
74
75 Cahn s Linear Theory Predicts Microstructure 1. Periodicity 2. Alignment in Elastically anisotropic materials Anisotropy 1 Y = (c 2 where 11 + c 12 )B B = Ø Œ3 - º c ( 2c 44 - c 11 c11 + 2c c )(l m m n 2 + l 2 n 2 ø ) œ ß For most cubic materials, <100> is minimum


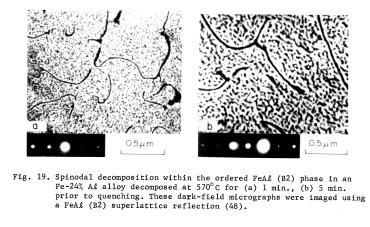
76 Isotropic Spinodal Decomposition, FeCrCo alloy and simulation
77
78

79 Cu-Ni-Fe with 25 nm modulations

80 Grain Boundary, note that SD occurs right up to the boundary

81 Fe-Be Alloy having undergone SD
82
83 Disorder / Order Transformations
84
85
86
87
88 The DO 3 structure has a sites Sn and the other three sites random dispersion of Ni and Cu
89
90
91
92
93 Ground State (T=0) Diagrams for BCC Derivative Structures
94 Ground State (T=0) Diagrams for FCC Derivative Structures
95 Can Spinodal Decomposition and Ordering Occur in the Same Alloy? It would seem not. Regular solution thermodynamics allows the interaction constant to be plus or minus. When plus, clustering When minus, atomic ordering
96 But this implies only near neighbors are important. There are some ordered phases which have the same number of opposite first neighbors as the disordered parent phase. (e..g. CuPt) Thus we should include second neighbors as well Look at CsCl 8 opposite near neighbors 6 same next near neighbors
97 Most nn are opposite but most nnn are not the same. To get all nn opposite and all nnn the same we put all the dark atoms in one section of the system (cluster) and then order!
98 The Cu Ni Sn System Cellular Decomposition Grain boundary precipitation Spinodal Decomposition Atomic Ordering
99 Ternary Phase Diagrams Location of the alloy A 0.6 B 0.3 C 0.1 on a ternary phase diagram
100 The atomic percentages, r i are obtained from weight percentages w i by the relation: r 1 w1 100 = Ł A1 ł n wi 1 Ł Ai ł For Cu 15 w/o Ni and 8 w/o Sn we get Cu 16.7 a/o Ni and 4.4 a/o Sn For Cu 7.5w/o Ni and 5w/o Sn we get Cu 8.3 a/o Ni and 2.7a/o Sn atomic mass Cu (A i ) Ni 58.7 Sn
101 FCC L1 2 Cu 3 Au L1 0 CuAu II
102 DO 22 DO 3
103 Isopleth for 15 w/o Ni CuNiSn Diagram (from Zhao et al.)
104
105 Look at the Discontinuous Transformation at 799 K (526 C) it takes 100 s to start at 680 K (407 C) it takes 1000 s to start 1 Q = K exp[ Q = K exp[ Solving, we get Q = 42,050 cal What T for 1000 s? ] = exp[ - ][ 2 ] 1 T - 1 ] 680 T = 735K or 462 C The Q is close to activation energy for grain boundary diffusion
106 Copper 7.5 w/o Ni and 5 w/o Sn, after Zhao et al.
107 Isopleth for 7.5 w/o Ni CuNiSn Diagram (from Zhao et al.)
108
109 L1 2 and DO 22 have similar Energies
110 The mean electron concentration, N e (electrons per atom) is an accurate indicator of which of the two phases will be stable. If Ne > 8.5 DO 22 if Ne < 8.5 L1 2 Co 3 Ti: (3x9+4)/4 < 8 L1 2 Ni 3 V: (3x10+5)/4 =8.75 DO 22 (see previous slide)
111 Look at (CuNi) 3 Sn Cu has 11 electrons Ni has 10 electrons Sn has 2 electrons For (Cu 1.5 Ni 1.5 )Sn (1.5 X ( ) +2) / 4 = 33.5/4 = Close to 8.5! Favors L1 2
112 To stabilize the L1 2 phase we want to decrease the number of electrons in the phase. More Ni than there presently or Add Co in place of Cu or Ni (9 e s) Add a Group IIIA in place of Sn
113 Recent Results from CMU on CuNiSn Alloys will be presented DSC Scans TEM Bright Field Dark Field Diffraction Also Results from BrushWellman will be discussed
114
Diffusional Transformations in Solids
 Diffusional Transformations in Solids The majority of phase transformations that occur in the solid state take place by thermally activated atomic movements. The transformations that will be dealt with
Contents. Part I Basic Thermodynamics and Kinetics of Phase Transformations 1
 Contents Preface List of tables Notation page iii xiii xiv Part I Basic Thermodynamics and Kinetics of Phase Transformations 1 1 Introduction 3 1.1 What Is a Phase Transition? 3 1.2 Atoms and Materials
Physical Metallurgy Friday, January 28, 2011; 8:30 12:00 h
 Physical Metallurgy Friday, January 28, 2011; 8:30 12:00 h Always motivate your answers All sub-questions have equal weight in the assessment Question 1 Precipitation-hardening aluminium alloys are, after
Chapter 10, Phase Transformations
 Chapter Outline: Phase Transformations Heat Treatment (time and temperature) Microstructure Kinetics of phase transformations Homogeneous and heterogeneous nucleation Growth, rate of the phase transformation
Kinetics. Rate of change in response to thermodynamic forces
 Kinetics Rate of change in response to thermodynamic forces Deviation from local equilibrium continuous change T heat flow temperature changes µ atom flow composition changes Deviation from global equilibrium
Hypoeutectoid Carbon Steels. Hypereutectoid Carbon Steels
 Hypoeutectoid Carbon Steels Another example: Amount of carbon? 1035 Steel: white regions are proeutectoid ferrite grains By the end of this lecture you should be able to predict the amount of carbon in
Phase Transformations and Phase Diagrams W-151. Appendix 5A The GFE and Available Work
 Phase Transformations and Phase Diagrams W-151 Appendix 5 Appendix 5A The GFE and Available Work In this appendix we show that the GFE is the energy available to do work at constant temperature, pressure,
Chapter 5 Diffusional Transformation in Solids
 Chapter 5 Diffusional Transformation in Solids Homogeneous nucleation in solids Heterogeneous nucleation Precipitate growth Overall transformation kinetics - TTT diagrams Precipitation in age-hardening
Point Defects. Vacancies are the most important form. Vacancies Self-interstitials
 Grain Boundaries 1 Point Defects 2 Point Defects A Point Defect is a crystalline defect associated with one or, at most, several atomic sites. These are defects at a single atom position. Vacancies Self-interstitials
Learning Objectives. Chapter Outline. Solidification of Metals. Solidification of Metals
 Learning Objectives Study the principles of solidification as they apply to pure metals. Examine the mechanisms by which solidification occurs. - Chapter Outline Importance of Solidification Nucleation
Phase Transformation in Materials
 2015 Fall Phase Transformation in Materials 09. 02. 2015 Eun Soo Park Office: 33-313 Telephone: 880-7221 Email: espark@snu.ac.kr Office hours: by an appointment 1 Introduction Web lecture assistance: http://etl.snu.ac.kr
Module 29. Precipitation from solid solution I. Lecture 29. Precipitation from solid solution I
 Module 29 Precipitation from solid solution I Lecture 29 Precipitation from solid solution I 1 Keywords : Properties of two phase alloys, super saturated solid solutions, historical perspective, solution
Equilibria in Materials
 2009 fall Advanced Physical Metallurgy Phase Equilibria in Materials 09.01.2009 Eun Soo Park Office: 33-316 Telephone: 880-7221 Email: espark@snu.ac.kr Office hours: by an appointment 1 Text: A. PRINCE,
Introduction to Heat Treatment. Introduction
 MME444 Heat Treatment Sessional Week 01 Introduction to Heat Treatment Prof. A.K.M.B. Rashid Department of MME BUET, Dhaka Introduction Can you control the microstructure that formed during cooling of
Phase Transformation of Materials
 2009 fall Phase Transformation of Materials 10.08.2009 Eun Soo Park Office: 33-316 Telephone: 880-7221 Email: espark@snu.ac.kr Office hours: by an appointment 1 Contents for previous class Interstitial
Part IV. Solid-solid transformations I
 Part IV : Solid-Solid Phase Transformations I Module 1 : Precipitation Part IV. Solid-solid transformations I In this part, we discuss a few of the important solid-solid transformations, namely, precipitation,
Chapter 9 Phase Diagrams. Dr. Feras Fraige
 Chapter 9 Phase Diagrams Dr. Feras Fraige Chapter Outline Definitions and basic concepts Phases and microstructure Binary isomorphous systems (complete solid solubility) Binary eutectic systems (limited
Phase diagrams wt% of carbon in Fe microstructure of a lead tin alloy of eutectic composition
 Phase diagrams 0.44 wt% of carbon in Fe microstructure of a lead tin alloy of eutectic composition Primer Materials For Science Teaching Spring 2018 28.6.2018 What is a phase? A phase may be defined as
Part II : Interfaces Module 3 : Nucleation of precipitates from a supersaturated matrix
 Part II : Interfaces Module 3 : Nucleation of precipitates from a supersaturated matrix 3.1 Motivation A solid contains many defects: vacancies, dislocations, stacking faults, grain and interphase boundaries,
Introduction to Materials Science
 EPMA Powder Metallurgy Summer School 27 June 1 July 2016 Valencia, Spain Introduction to Materials Science Prof. Alberto Molinari University of Trento, Italy Some of the figures used in this presentation
Phase Transformation in Materials
 2016 Fall Phase Transformation in Materials 09. 05. 2016 Eun Soo Park Office: 33-313 Telephone: 880-7221 Email: espark@snu.ac.kr Office hours: by an appointment 1 Introduction Web lecture assistance: http://etl.snu.ac.kr
but T m (Sn0.62Pb0.38) = 183 C, so this is a common soldering alloy.
 = 183 C, so this is a common soldering alloy.") T m (Sn) = 232 C, T m (Pb) = 327 C but T m (Sn0.62Pb0.38) = 183 C, so this is a common soldering alloy. T m (Au) = 1064 C, T m (Si) = 2550 C but T m (Au0.97Si0.03) = 363 C, so thin layer of gold is used
T m (Sn) = 232 C, T m (Pb) = 327 C but T m (Sn0.62Pb0.38) = 183 C, so this is a common soldering alloy. T m (Au) = 1064 C, T m (Si) = 2550 C but T m (Au0.97Si0.03) = 363 C, so thin layer of gold is used
MT 348 Outline No MECHANICAL PROPERTIES
 MT 348 Outline No. 1 2009 MECHANICAL PROPERTIES I. Introduction A. Stresses and Strains, Normal and Shear Loading B. Elastic Behavior II. Stresses and Metal Failure A. ʺPrincipal Stressʺ Concept B. Plastic
Materials Engineering. Phase transformation Phase diagrams
 Materials Engineering Phase transformation Phase diagrams Phase Transformation Why is it important for us? o Temperature, chemical composition and pressure can change the properties of materials o Understanding
From sand to silicon wafer
 From sand to silicon wafer 25% of Earth surface is silicon Metallurgical grade silicon (MGS) Electronic grade silicon (EGS) Polycrystalline silicon (polysilicon) Single crystal Czochralski drawing Single
Metal working: Deformation processing II. Metal working: Deformation processing II
 Module 28 Metal working: Deformation processing II Lecture 28 Metal working: Deformation processing II 1 Keywords : Difference between cold & hot working, effect of macroscopic variables on deformation
Equilibrium phase diagram of metallic alloy
 Equilibrium phase diagram of metallic alloy Motivation New structure, concentration (mixing level) (at what temperature? for how long? ) Phase Diagrams - Introduction. Many materials systems can exist
Module 32. Heat treatment of steel II. Lecture 32. Heat treatment of steel II
 Module 32 Heat treatment of steel II Lecture 32 Heat treatment of steel II 1 Keywords : Kinetics of pearlitic transformation, Johnsom Mehl Avrami equation, effect of carbon content on T T T diagram, bainite:
Spinodal Decomposition
 Spinodal Decomposition Lauren Ayers December 17, 2012 1 Introduction Spinodal decomposition is one process by which an alloy decomposes into equilibrium phases. It occurs when there is no thermodynamic
Module-6. Dislocations and Strengthening Mechanisms
 Module-6 Dislocations and Strengthening Mechanisms Contents 1) Dislocations & Plastic deformation and Mechanisms of plastic deformation in metals 2) Strengthening mechanisms in metals 3) Recovery, Recrystallization
Phase Diagrams of Pure Substances Predicts the stable phase as a function of P total and T. Example: water can exist in solid, liquid and vapor
 PHASE DIAGRAMS Phase a chemically and structurally homogenous region of a material. Region of uniform physical and chemical characteristics. Phase boundaries separate two distinct phases. A single phase
8. Principles of Solidification
 CBE4010 Introduction to Materials Science for Chemical Engineers 8. Principles of Solidification The Driving Force a Phase Change We expect a material to solidify when the liquid cools to just below its
ME 254 MATERIALS ENGINEERING 1 st Semester 1431/ rd Mid-Term Exam (1 hr)
") 1 st Semester 1431/1432 3 rd Mid-Term Exam (1 hr) Question 1 a) Answer the following: 1. Do all metals have the same slip system? Why or why not? 2. For each of edge, screw and mixed dislocations, cite
1 st Semester 1431/1432 3 rd Mid-Term Exam (1 hr) Question 1 a) Answer the following: 1. Do all metals have the same slip system? Why or why not? 2. For each of edge, screw and mixed dislocations, cite
Phase Transformations in Metals Tuesday, December 24, 2013 Dr. Mohammad Suliman Abuhaiba, PE 1
 Ferrite - BCC Martensite - BCT Fe 3 C (cementite)- orthorhombic Austenite - FCC Chapter 10 Phase Transformations in Metals Tuesday, December 24, 2013 Dr. Mohammad Suliman Abuhaiba, PE 1 Why do we study
Binary Phase Diagrams - II
 Binary Phase Diagrams - II Note the alternating one phase / two phase pattern at any given temperature Binary Phase Diagrams - Cu-Al Can you spot the eutectoids? The peritectic points? How many eutectic
1. Use the Ellingham Diagram (reproduced here as Figure 0.1) to answer the following.
 to answer the following.") 315 Problems 1. Use the Ellingham Diagram (reproduced here as Figure 0.1) to answer the following. (a) Find the temperature and partial pressure of O 2 where Ni(s), Ni(l), and NiO(s) are in equilibrium.
315 Problems 1. Use the Ellingham Diagram (reproduced here as Figure 0.1) to answer the following. (a) Find the temperature and partial pressure of O 2 where Ni(s), Ni(l), and NiO(s) are in equilibrium.
Titanium and titanium alloys. Josef Stráský
 Titanium and titanium alloys Josef Stráský Lecture 2: Fundamentals of Ti alloys Polymorphism Alpha phase Beta phase Pure titanium Titanium alloys alloys alloys alloys Phase transformation β α phase Hardening
Tutorial 2 : Crystalline Solid, Solidification, Crystal Defect and Diffusion
 Tutorial 1 : Introduction and Atomic Bonding 1. Explain the difference between ionic and metallic bonding between atoms in engineering materials. 2. Show that the atomic packing factor for Face Centred
Strengthening Mechanisms
 Strengthening Mechanisms The ability of a metal/ alloy to plastically deform depends on the ability of dislocations to move. Strengthening techniques rely on restricting dislocation motion to render a
Objective To study the time and temperature variations in the hardness of Al-4% Cu alloy on isothermal aging.
 EXPERIMENT 8 PRECIPITATION HARDENING IN 2024 ALUMINUM Objective To study the time and temperature variations in the hardness of Al-4% Cu alloy on isothermal aging. Introduction Materials can be hardened
Continuous Cooling Diagrams
 Continuous Cooling Diagrams Isothermal transformation (TTT) diagrams are obtained by rapidly quenching to a given temperature and then measuring the volume fraction of the various constituents that form
E45 Midterm 01 Fall 2007! By the 0.2% offset method (shown on plot), YS = 500 MPa
, YS = 500 MPa") 1.!Mechanical Properties (20 points) Refer to the following stress-strain plot derived from a standard uniaxial tensile test of a high performance titanium alloy to answer the following questions. Show
1.!Mechanical Properties (20 points) Refer to the following stress-strain plot derived from a standard uniaxial tensile test of a high performance titanium alloy to answer the following questions. Show
Chapter 8 Strain Hardening and Annealing
 Chapter 8 Strain Hardening and Annealing This is a further application of our knowledge of plastic deformation and is an introduction to heat treatment. Part of this lecture is covered by Chapter 4 of
Dept.of BME Materials Science Dr.Jenan S.Kashan 1st semester 2nd level. Imperfections in Solids
 Why are defects important? Imperfections in Solids Defects have a profound impact on the various properties of materials: Production of advanced semiconductor devices require not only a rather perfect
Introduction to Point Defects. Version 2.1. Andrew Green, MATTER John Humphreys, UMIST/University of Manchester Ross Mackenzie, Open University
 Introduction to Point Defects Version 2.1 Andrew Green, MATTER John Humphreys, UMIST/University of Manchester Ross Mackenzie, Open University October 1997 Assumed Pre-knowledge This module has been developed
Module 31. Heat treatment of steel I. Lecture 31. Heat treatment of steel I
 Module 31 Heat treatment of steel I Lecture 31 Heat treatment of steel I 1 Keywords : Transformation characteristics of eutectoid steel, isothermal diagram, microstructures of pearlite, bainite and martensite,
Chapter 7: Dislocations and strengthening mechanisms. Strengthening by grain size reduction
 Chapter 7: Dislocations and strengthening mechanisms Mechanisms of strengthening in metals Strengthening by grain size reduction Solid-solution strengthening Strain hardening Recovery, recrystallization,
Point defects. process complicated. Now we shall discuss on defects, which will help to understand the atomic mechanism of diffusion.
 Point defects Diffusion of elements is possible because of the presence of defects. For example, substitutional diffusion occurs because of exchange of an atom with acancies. Further, impurities are present
Chapter 10: Phase Transformations
 Chapter 10: Phase Transformations ISSUES TO ADDRESS... Transforming one phase into another takes time. Fe C FCC g (Austenite) Eutectoid transformation Fe 3 C (cementite) + a (ferrite) (BCC) How does the
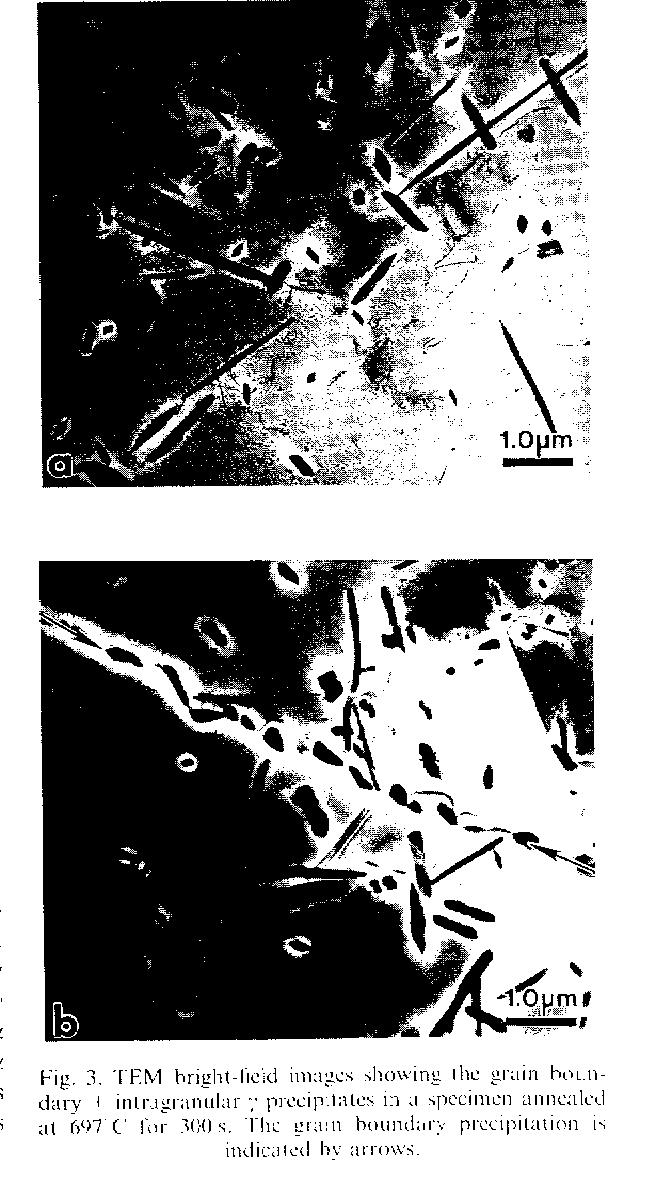
CHAPTER SEVEN EXPERIMENTAL RESULTS EFFECT OF THE STEEL S COMPOSITION 7.1 EFFECT OF ANNEALING TREATMENT ON STEEL B
 CHAPTER SEVEN EXPERIMENTAL RESULTS EFFECT OF THE STEEL S COMPOSITION 7 7.1 EFFECT OF ANNEALING TREATMENT ON STEEL B In order to understand the precipitation behaviour of the Laves phase more precisely,
CHAPTER 12. Phase Transformations
 CHAPTER 12 Phase Transformations Introduction Basic concepts The kinetics of phase transformations Metastable versus equilibrium states Isothermal transformation diagrams Continuous cooling transformation
Defects and Diffusion
 Defects and Diffusion Goals for the Unit Recognize various imperfections in crystals Point imperfections Impurities Line, surface and bulk imperfections Define various diffusion mechanisms Identify factors
CHAPTER 5: DIFFUSION IN SOLIDS
 CHAPTER 5: DIFFUSION IN SOLIDS ISSUES TO ADDRESS... How does diffusion occur? Why is it an important part of processing? How can the rate of diffusion be predicted for some simple cases? How does diffusion
Atomic Transport & Phase Transformations. PD Dr. Nikolay Zotov
 Atomic Transport & Phase Transformations PD Dr. Nikolay Zotov Atomic Transport & Phase Transformations Part II Lecture Diffusion Short Description 1 Introduction; Non-equilibrium thermodynamics 2 Diffusion,
Part IV : Solid-Solid Phase Transformations I Module 2 : Cellular precipitation
 Part IV : Solid-Solid Phase Transformations I Module 2 : Cellular precipitation 2. Cellular precipitation 2.1 Motivation Consider the microstructure (schematic) shown in Fig. 18. This is a typical microstructure
Part III : Nucleation and growth. Module 4 : Growth of precipitates and kinetics of nucleation and growth. 4.1 Motivating question/phenomenon
 Part III : Nucleation and growth Module 4 : Growth of precipitates and kinetics of nucleation and growth 4.1 Motivating question/phenomenon In Figure. 20 we show, schematically, a morphology of precipitates
Material Science. Prof. Satish V. Kailas Associate Professor Dept. of Mechanical Engineering, Indian Institute of Science, Bangalore India
 Material Science Prof. Satish V. Kailas Associate Professor Dept. of Mechanical Engineering, Indian Institute of Science, Bangalore 560012 India Chapter 6. Phase Diagrams Learning objectives: - To understand
Lecture 20: Eutectoid Transformation in Steels: kinetics of phase growth
 Lecture 0: Eutectoid Transformation in Steels: kinetics of phase growth Today s topics The growth of cellular precipitates requires the portioning of solute to the tips of the precipitates in contact with
J = D C A C B x A x B + D C A C. = x A kg /m 2
 1. (a) Compare interstitial and vacancy atomic mechanisms for diffusion. (b) Cite two reasons why interstitial diffusion is normally more rapid than vacancy diffusion. (a) With vacancy diffusion, atomic
27-302, Microstructure & Properties II, A.D. Rollett. Fall Homework 2, due Weds, Nov. 6 th
 27-32, Microstructure & Properties II, A.D. Rollett Fall 2 Homework 2, due Weds, Nov. 6 th 1. Materials Design In the first discussion, we discussed materials in preference to an engineered device that
TOPIC 2. STRUCTURE OF MATERIALS III
 Universidad Carlos III de Madrid www.uc3m.es MATERIALS SCIENCE AND ENGINEERING TOPIC 2. STRUCTURE OF MATERIALS III Topic 2.3: Crystalline defects. Solid solutions. 1 PERFECT AND IMPERFECT CRYSTALS Perfect
Crystal Defects. Perfect crystal - every atom of the same type in the correct equilibrium position (does not exist at T > 0 K)
") Crystal Defects Perfect crystal - every atom of the same type in the correct equilibrium position (does not exist at T > 0 K) Real crystal - all crystals have some imperfections - defects, most atoms are
Crystal Defects Perfect crystal - every atom of the same type in the correct equilibrium position (does not exist at T > 0 K) Real crystal - all crystals have some imperfections - defects, most atoms are
the Phase Diagrams Today s Topics
 MME 291: Lecture 03 Introduction to the Phase Diagrams Prof. A.K.M.B. Rashid Department of MME BUET, Dhaka Today s Topics Concept of alloying Classification of alloys Introduction to the phase diagram
Chapter Outline Dislocations and Strengthening Mechanisms. Introduction
 Chapter Outline Dislocations and Strengthening Mechanisms What is happening in material during plastic deformation? Dislocations and Plastic Deformation Motion of dislocations in response to stress Slip
Imperfections: Good or Bad? Structural imperfections (defects) Compositional imperfections (impurities)
 Compositional imperfections (impurities)") Imperfections: Good or Bad? Structural imperfections (defects) Compositional imperfections (impurities) 1 Structural Imperfections A perfect crystal has the lowest internal energy E Above absolute zero
Imperfections: Good or Bad? Structural imperfections (defects) Compositional imperfections (impurities) 1 Structural Imperfections A perfect crystal has the lowest internal energy E Above absolute zero
Imperfections, Defects and Diffusion
 Imperfections, Defects and Diffusion Lattice Defects Week5 Material Sciences and Engineering MatE271 1 Goals for the Unit I. Recognize various imperfections in crystals (Chapter 4) - Point imperfections
Single vs Polycrystals
 WEEK FIVE This week, we will Learn theoretical strength of single crystals Learn metallic crystal structures Learn critical resolved shear stress Slip by dislocation movement Single vs Polycrystals Polycrystals
Microstructural effects of phase transformations Marek Faryna
 Microstructural effects of phase transformations Marek Faryna Institute of Metallurgy and Materials Science m.faryna@imim.pl 012 2952828 mobile 697 225 186 Outline Transformation in solids Formal theories
Strengthening Mechanisms. Today s Topics
 MME 131: Lecture 17 Strengthening Mechanisms Prof. A.K.M.B. Rashid Department of MME BUET, Dhaka Today s Topics Strengthening strategies: Grain strengthening Solid solution strengthening Work hardening
Phase Transitions Module γ-2: VSM study of Curie Temperatures 1 Instructor: Silvija Gradečak
 3.014 Materials Laboratory November 13 th 18 th, 2006 Lab week 3 Phase Transitions Module γ-2: VSM study of Curie Temperatures 1 Instructor: Silvija Gradečak Objectives: a) Understand magnetic and thermal
Fe-Fe 3 C phase diagram is given on the last page of the exam. Multiple choices (2.5 points each):
:") Materials Science and Engineering Department MSE 200, Exam #3 ID number First letter of your last name: Name: No notes, books, or information stored in calculator memories may be used. Cheating will be
Materials Science and Engineering Department MSE 200, Exam #3 ID number First letter of your last name: Name: No notes, books, or information stored in calculator memories may be used. Cheating will be
Diffusion phenomenon
 Module-5 Diffusion Contents 1) Diffusion mechanisms and steady-state & non-steady-state diffusion 2) Factors that influence diffusion and nonequilibrium transformation & microstructure Diffusion phenomenon
Introduction to the phase diagram Uses and limitations of phase diagrams Classification of phase diagrams Construction of phase diagrams
 Prof. A.K.M.B. Rashid Department of MME BUET, Dhaka Concept of alloying Classification of alloys Introduction to the phase diagram Uses and limitations of phase diagrams Classification of phase diagrams
Phase Transformation in Materials
 2015 Fall Phase Transformation in Materials 12. 09. 2015 Eun Soo Park Office: 33-313 Telephone: 880-7221 Email: espark@snu.ac.kr Office hours: by an appointment 1 Contents in Phase Transformation Background
12/3/ :12 PM. Chapter 9. Phase Diagrams. Dr. Mohammad Abuhaiba, PE
 Chapter 9 Phase Diagrams 1 2 Learning Objectives 1. Isomorphous and eutectic phase diagrams: a. label various phase regions b. Label liquidus, solidus, and solvus lines 2. Given a binary phase diagram
TALAT Lecture Phase Diagrams. 14 pages, 13 Figures. Basic Level
 TALAT Lecture 1203 Phase Diagrams 14 pages, 13 Figures Basic Level prepared by M H Jacobs * Interdisciplinary Research Centre in Materials The University of Birmingham, UK (Based on approach adopted by
IMPERFECTIONSFOR BENEFIT. Sub-topics. Point defects Linear defects dislocations Plastic deformation through dislocations motion Surface
 IMPERFECTIONSFOR BENEFIT Sub-topics 1 Point defects Linear defects dislocations Plastic deformation through dislocations motion Surface IDEAL STRENGTH Ideally, the strength of a material is the force necessary
ENGR 151: Materials of Engineering LECTURE #15: PHASE DIAGRAMS
 ENGR 151: Materials of Engineering LECTURE #15: PHASE DIAGRAMS TENSILE TESTING VIDEO https://www.youtube.com/watch?v=-qukvzo2jse PROPERTIES OF ISOMORPHOUS ALLOYS Solid solution strengthening For Ni-Cu
Phase Equilibria, Phase Diagrams and Phase Transformations
 Mats Hillert Department of Materials Science and Engineering KTH, Stockholm Phase Equilibria, Phase Diagrams and Phase Transformations Their Thermodynamic Basis CAMBRIDGE UNIVERSITY PRESS Contents Preface
MICROSTRUCTURAL EVOLUTION IN MATERIALS
 MICROSTRUCTURAL EVOLUTION IN MATERIALS DEPARTMENT OF MATERIALS SCIENCE AND ENGINEERING MASSACHUSETTS INSTITUTE OF TECHNOLOGY Spring Semester, 2010 Final Exam Please read the exam through before starting.
Fundamentals of Plastic Deformation of Metals
 We have finished chapters 1 5 of Callister s book. Now we will discuss chapter 10 of Callister s book Fundamentals of Plastic Deformation of Metals Chapter 10 of Callister s book 1 Elastic Deformation
Lecture 31: Principles of Solidification of Steel. Key words: Solidification, planar growth, dendritic growth, casting, constitutional supercooling
 Lecture 31: Principles of Solidification of Steel Contents: Preamble Solidification variables Equilibrium solidification Non equilibrium solidification Microstructure development Key words: Solidification,
Chapter Outline How do atoms arrange themselves to form solids?
 Chapter Outline How do atoms arrange themselves to form solids? Fundamental concepts and language Unit cells Crystal structures Face-centered cubic Body-centered cubic Hexagonal close-packed Close packed
Chapter 10: Phase Transformations
 Chapter 10: Phase Transformations ISSUES TO ADDRESS... Transforming one phase into another takes time. Fe (Austenite) Eutectoid transformation Fe 3 C (cementite) + C FCC (ferrite) (BCC) How does the rate
Introduction to phase diagrams
 ASM Phase Diagram Database Diagram No. 901229 Department of Physics and Astronomy Introduction to phase diagrams William Meier Physics 590B Fall 2018 Outline Part 1 Introduction and basics Part 2 Fundamental
5 a l l o y i n g b e h av i o r
 has dissolved in A to form a substitutional solid solution (igure 5.1b). It can be said also that this is a single-phase alloy. The word phase simply implies that the crystal structure and the alloy composition
Solid State Transformations
 Solid State Transformations Symmetrical Tilt Boundary The misorientation θ between grains can be described in terms of dislocations (Fig. 1). Inserting an edge dislocation of Burgers vector b is like forcing
Modelling of long-term phase stability in Ni-based superalloys based on thermodynamic and kinetic CALPHAD calculations
 Modelling of long-term phase stability in Ni-based superalloys based on thermodynamic and kinetic CALPHAD calculations R. Rettig, R. F. Singer Institute of Science and Technology of Metals (WTM) DFG-Research
Chapter Outline. How do atoms arrange themselves to form solids?
 Chapter Outline How do atoms arrange themselves to form solids? Fundamental concepts and language Unit cells Crystal structures! Face-centered cubic! Body-centered cubic! Hexagonal close-packed Close packed
Phase field modeling of Microstructure Evolution in Zirconium base alloys
 Phase field modeling of Microstructure Evolution in Zirconium base alloys Gargi Choudhuri, S.Chakraborty, B.K.Shah, D. Si Srivastava, GKD G.K.Dey Bhabha Atomic Research Centre Mumbai, India- 400085 17
PHASE DIAGRAMS UNDERSTANDING BASICS THE. Edited. F.C. Campbell. Materials Park, Ohio The Materials Information Society.
 PHASE DIAGRAMS UNDERSTANDING THE BASICS Edited by F.C. Campbell The Materials Information Society ASM International Materials Park, Ohio 44073-0002 www.asm i nternational.org Phase Diagrams Understanding
SECTION A. NATURAL SCIENCES TRIPOS Part IA. Friday 4 June to 4.30 MATERIALS AND MINERAL SCIENCES
 NATURAL SCIENCES TRIPOS Part IA Friday 4 June 1999 1.30 to 4.30 MATERIALS AND MINERAL SCIENCES Answer five questions; two from each of sections A and B and one from section C. Begin each answer at the
Chapter 7 Dislocations and Strengthening Mechanisms. Dr. Feras Fraige
 Chapter 7 Dislocations and Strengthening Mechanisms Dr. Feras Fraige Chapter Outline Dislocations and Strengthening Mechanisms What is happening in material during plastic deformation? Dislocations and
PHASE EQUILIBRIUM P + F = C + 2
 PHASE EQUILIBRIUM Component: is either pure metal and/or compound of which an alloy is composed. They refer to the independent chemical species that comprise the system. Solid Solution: It consists of
Chapter 10: Phase Transformations
 Chapter 10: Phase Transformations ISSUES TO ADDRESS... Transforming one phase into another takes time. Fe C FCC (Austenite) Eutectoid transformation Fe 3 C (cementite) + (ferrite) (BCC) How does the rate
Recent Developments of Software and Databases
 Recent Developments of Software and Databases Aachen, Sept 1-2, 2016 Introduction 2015 Introduction 1000 Introduction 64 Introduction 46 Introduction Introduction 35 Outline - What we do About the company
Ferromagnetic Transitions
 Ferromagnetic Transitions Module γ -3: Phase Transitions and Magnetic Properties Jorge Feuchtwanger Objectives: 1. understand the chemical order-disorder transition and how it alters magnetic properties,
Time-Temperature-Transformation (TTT) Diagrams
 Diagrams") Time-Temperature-Transformation (TTT) Diagrams 1 Classification of Phase Transformations and Plasticity Civilian transformation Military transformation 2 Table 3.5 Classification of Nucleation and Growth
Time-Temperature-Transformation (TTT) Diagrams 1 Classification of Phase Transformations and Plasticity Civilian transformation Military transformation 2 Table 3.5 Classification of Nucleation and Growth
Phase Diagrams. Phases
 Phase Diagrams Reading: Callister Ch. 10 What is a phase? What is the equilibrium i state t when different elements are mixed? What phase diagrams tell us. How phases evolve with temperature and composition
MTLS 4L04 Steel Section. Lecture 6
 MTLS 4L04 Steel Section Lecture 6 Tempering of Martensite To get around the problem of the brittleness of the Martensite, Martensite is heat treated at elevated temperatures (200-700 C) to precipitate