VOLUME FRACTION ANALYSIS
|
|
|
- Edward George
- 5 years ago
- Views:
Transcription
 3 2 4 2 2M 0 0 e 1 2 1Cos 2 e 1 F 2 2 2 32r 4 m v Sin Cos 2 m External Standard Method w c w / / / / kc 1 kw 1 c = / / w w w / / / / m M w w w m w / w / w / w / w")
1 VOLUME FRCTON NLYSS Qualitative (dentification) Lattice parameter versus composition curve (single phase) JCPDS Files: 1) Locate d1 group; 2)Closest match to d2 3) d1, d2, d3 (-wise) 4) Compare all lines Quantitative (ntensity mount) M 0 0 e 1 2 1Cos 2 e 1 F r 4 m v Sin Cos 2 m External Standard Method w c w / / / / kc 1 kw 1 c = / / w w w / / / / m M w w w m w / w / w / w / w 1/ 1/ 1/ k 1 For, w Vol. fr. =, w w K C
2 Direct Comparison Method k 32r 4 m e kr cos 2 R F p e 2 2 v sin cos k R C 2 For and 2m R C R C k R C 2 2m Furthermore, C + C = 1 Calculated pattern: + M (1 wt% C) Cr K 2M Oil quenched Ni-V steel with 30 vol.%
3 GXRD profiles of chromium-coated and gasnitrided steel at 850 C for 6 h at different glancing angle. Cr2N is prominent only at higher angle of incidence (5 ) indicating that the surface mostly comprises CrN Variation of amount (vol.%) of CrN and Cr2N at different depths from surface with nitriding time for nitriding at 950 C calculated from the GXRD data obtained at different angles of incidence. Basu, J. Dutta Majumdar, S. Ghosh Chowdhury, P.K. jikumar, P. Shankar,.K. Tyagi, Baldev Raj and. Manna, Surface and Coatings Technology, 201, 2007,
4 nternal Standard Method Calibration curve for quartz analysis with fluorite as internal standard Q is the intensity of the d = 3.34 line of quartz and F is the intensity of the d = 3.16 line of fluorite For, For standard S, Now, and k3c m s kc 4 3 m s k C 3 k C w/ C w / w / w /... w / B B c c s s w s / s C w / w / w /... w / C C B B c c s s w ss w s s f w S is same in all composite samples: S kw 5 4 s w w (1 w ) Hence, 6 S S kw

5 Calibration curve for quartz analysis with fluorite as internal standard Q is the intensity of the d = 3.34 line of quartz and F is the intensity of the d = 3.16 line of fluorite Cu K radiation used for measurements on binary mixtures Q is the intensity of the reflection from the d = 3.34 planes of quartz in a mixture, Qp is the intensity of the same reflection from pure quartz
")
")
6 X-ray fluorescence Spectrometers (a) Wavelength-dispersive spectrometer (b) Energy-dispersive spectrometer
7 Variation with Z of the wavelength and energy of the strongest emission lines of the K and L series. X-ray spectrometer, flat-crystal type X-ray spectrometer, curved-crystal type
 plane, disordered and ordered ucu 3 Phase diagram of the Cu-u")
8 ORDER DSORDER TRNSFORMTON Unit cell of Random and Ordered ucu 3 S r F 1 F tom arrangement on a (100) plane, disordered and ordered ucu 3 Phase diagram of the Cu-u system
 completely ordered High resolution XRD showing superlattice peak of GaN (002).")
9 S r F 1 F Variation of LRO parameter with T/T c for ucu 3 / CuZn Powder patterns of ucu 3 (a) Disordered, (b) Partially ordered, (c) completely ordered High resolution XRD showing superlattice peak of GaN (002). Red line denotes results of computer simulation


10 Unit cells of the disordered and ordered forms of CuZn Unit cells of the two ordered forms of ucu Variation of the scattering factor correction f with / k see text for details, the two points on the curve show the corrections for the scattering of Zn K radiation by copper and zinc atoms
11 RESDUL STRESS MESUREMENT Examples of residual stress T = tension C = Compression Residual stress induced by plastic flow in bending (a) loaded below elastic limit (b) loaded beyond elastic limit (c) unloaded shaded regions have been plastically strained
12 Bar in pure tension, with X- rays reflected from planes parallel to axis Diffraction from strained tension axis vertical lattice planes shown belong to the same (hkl) set Np = reflecting plane normal
13 Plane spacing diagram (b) and (c) Orientation of x-ray relative to specimen. Ns = normal to specimen surface N p = normal to reflecting planes

14 Use of a diffractometer for stress measurement Stresses at the surface of a stressed body 3 = 0, the stress to be measured is. Vector diagram of plane spacing d for a tensile stress
 composite powder 20 40 60 80 100 2")
15 ntensity (arb units) l 3 Ti WC C C C RT n-situ XRD patterns recorded at RT and 300, 400, and 500 o C from the l 50 Ti 40 Si 10 (amorphous + nano l 3 Ti) composite powder (degree)
 pole figure of recrystallized commercial 0.04 %C sheet steel, (l killed) 0.9mm thick.")
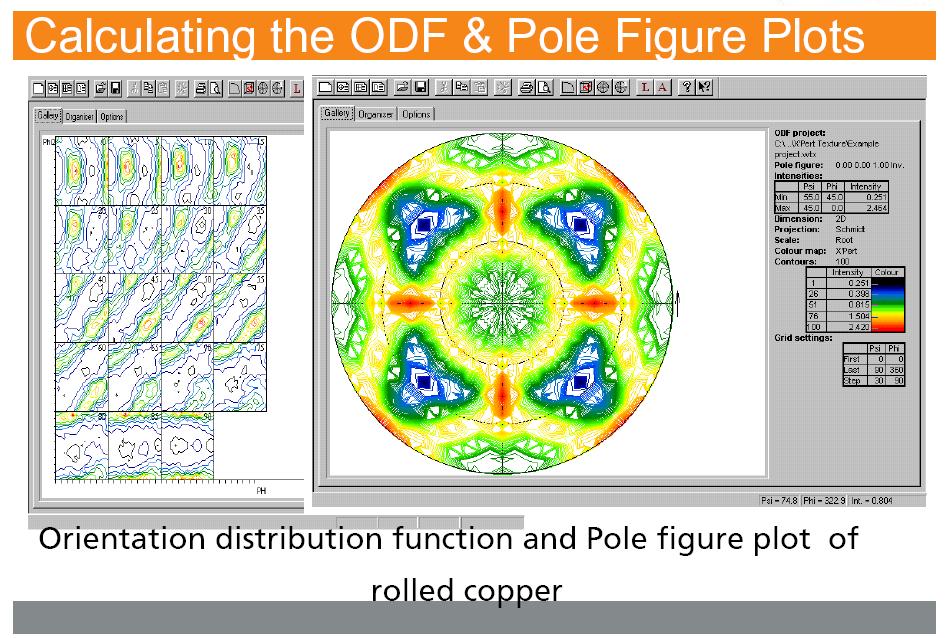
16 Texture nalysis by Pole Figure (111) pole figure of alpha brass sheet (70Cu-30Zn), cold rolled to a reduction in thickness of 95 percent (110) pole figure of recrystallized commercial 0.04 %C sheet steel, (l killed) 0.9mm thick. Pole densities in times random units.
17
18 Theory and pplications of X-ray Diffraction in Material Characterization Theory: 1. Production of X-ray 2. Properties of X-ray 3. Structure of solids 4. Crystal structure 5. Direction of diffraction 6. ntensity of diffraction c E h h x E sin 2 ( ) ' n 2d sin or 2dsin n n n n sin (h l k ) for cubic 4a 0.9 pplications: t B Bcos 1. Determination of crystal structure B t cos B 2. Determination of precise lattice parameter 3. Determination of solid solubility and solvus line 4. Determination of volume fraction of solid phases 5. Determination of residual stress in solid components 6. Determination of chemical composition (spectroscopy) 7. Determination of order-disorder parameter/transformation B BM B 8. Determination of preferred orientation (texture) - 2D and 3D n F f exp[2 i(hu kv lw )] S