KINETIC TESTING TO PREDICT ACID ROCK DRAINAGE
|
|
|
- Candice Reeves
- 5 years ago
- Views:
Transcription
")

1 KINETIC TESTING TO PREDICT ACID ROCK DRAINAGE By Louis de Wet PhD, FWISA, NYAS Waterlab (Pty) Ltd and NLA-SA SANAS Accredited Laboratory No T0391 Test & Measurement Conference 4 September 2012
2 Mineralogy On-Site Monitoring Data Kinetic Field Testing Static Testing ABA, NAG Prediction of Drainage Chemistry Laboratory Kinetic Testing Total Metals & Whole Rock Geochemical Modelling Retention Tests The Prediction Wheel for Mine Drainage Chemistry and the part of ABA (Morin & Hutt, 1999 ; Usher et al., 2003)
3 Kinetic Tests Kinetic testing is described as a group of test work procedures wherin acid-generation (and metal volatilization and transport) characteristics of a sample are measured with respect to time (Mills, 1998 ; Chemex, 1997 ; Usher et. al., 2003) A number of kinetic tests are generally used: - Column (leach) Tests - Humidity cells - Accelerated biological oxidation tests - Field Tests - Specialized test apparatus
4 Reasons why Kinetic Tests are conducted - Validation of static test results and classification - Determination of the rate of sulphide oxidation/acid generation - Determination of the rate of neutralization depletion - Determination of the availability of NP - Time to the onset of ARD - Evaluation and selection of ARD control methods - Prediction of water quality - Comparison of different mitigation methods
5 Design specifications for Humidity Cells The ASTM D (ASTM, 2000) (American Society for Testing and Materials) specify design specifications and a standardized methodology for the fabrication and operation of Humidity Cells. A Humidity Cell bank or setup consists of the following components: - Humidity Cells for either coarse waste/ore or tailings - Humidifier for delivering moist air - Dessicant column for delivering dry air - Compressed air supply with flow regulation - Collection bottles for collecting leachates
6 Water In Air Out Valve Crushed Core, Waste rock and Coarse tailings (6.3 mm) Sample Cell Height Cell diameter Sample bed depth Sample Quantity mm mm mm - 1kg Valve Support Grid Dry Air & Humid Air In Fine tailings (150µm) Cell Height Cell diameter Sample bed depth Sample Quantity mm mm mm - 1kg Valve Leachate Out Schematic diagram of a Humidity Cell (Morin & Hutt, 1998 ; 1999)


 012-349-1044/1066 (F) 012-349-2064 (E) ldewet@waterlab.co.")
7 Assembled view of Humidity Cell Torsion Nut Bottom-Plate view of Humidity Cell showing air inlets and perforated filter plate 150 mm Water Inlet Top-Plate view of Humidity Cell showing water inlet and torsion bars & -nuts Air vent Geotextile Layer Torsion Bolt Geotextile Layer Perforated Baseplate Dry Air Inlet Rock / Soil sample 100 mm Leach Outlet 200 mm Moist Air Inlet Waterlab (Pty) Ltd ; P.O. Box 283 Persequor Park 0020 ; (T) /1066 (F) (E) ldewet@waterlab.co.za Project: Humidity Cells Project No: 204 Project Coordinator: LPD de Wet Design Description: Humidity Cell Leach Column (Coarse Waste) Date:
8 Coarse Material Humidity Cells Tailings Humidity Cells` Water In / Air Out Water In / Air Out Wet / Dry Air In Wet / Dry Air In Leachate Out Leachate Out Wet Air Out DryAir Out Wet Air Humidifier Dry Air Manifold Air Dessicator Wet Air Inlet Tap W D Dry Air Inlet Tap F Air Flowmeter Air Mains In Waterlab (Pty) Ltd ; P.O. Box 283 Persequor Park 0020 ; (T) /1066 (F) (E) ldewet@waterlab.co.za Project: Humidity Cells Project No: 204 Project Coordinator: LPD de Wet Design Description: Humidity Cells Circuit Diagram Date:

9 Water Inlet Air Inlets Leachate Outlet Humidity Cells for coarse waste / ore

10 Water Inlet Air Outlet Air Inlets Leachate Outlet Humidity Cells for fine waste / tailings

11 Dry Air Inlet Digital Temperature Controller Compressor Air Supply Moist Air Inlet Air Inlets to Humidifier and Dessicant Column

12 Dessicant Column Flowmeter Inlet section showing flowmeter and Dessicant Column

 012-349-1044/1066 (F) 012-349-2064 (E) ldewet@waterlab.co.")
13 Project No: 204 Design Description: Humidity Cells Humidifier Humidifier Dimensions Inner Diameter : 130 mm Length : 1000 mm End Plates : 200 x 200 x 8 mm End Plates Side View Moist Air Outlets Bubble Aerator Water Level Aquarium Heater Thermocouple Rubber Seal Air Feed In Humidifier Toho CN-40 Digital Temperature Controller Waterlab (Pty) Ltd ; P.O. Box 283 Persequor Park 0020 ; (T) /1066 (F) (E) ldewet@waterlab.co.za Project: Humidity Cells Project Coordinator: LPD de Wet Date:
14 Humid Air Outlets Water Heater Air Diffuser Humidified close-up

15 Fabrication

16

17
18 Humidity Cells Operation Procedures Sample Preparation: Crush coarse rock samples such that at least 90% of the material passes through a <6mm screen. Tailings and Ash material should pass through a 150 µm screen (+90%) to ensure compliance to requirements. Place bidum or geotextile material on the bottom of each cell. Accurately weigh a dry 1kg sample of the material in each of the Humidity Cells. Pulverise a subsample of the original crushed material and conduct a comprehensive geochemical characterization (ABA, NAG, paste ph, XRD, XRF, Shakeflask)
19 Material combinations for Humidity Cells Materials placed in a humidity cell can be homogenous in composition, or a combination of a number of materials: - Sample of potentially ARD forming coal, rock or tailings only - Non ARD generating material such as soil overburden - Acid neutralizing material - Combination (blend) of ARD forming material and neutralizing material in a certain, or various ratios

20


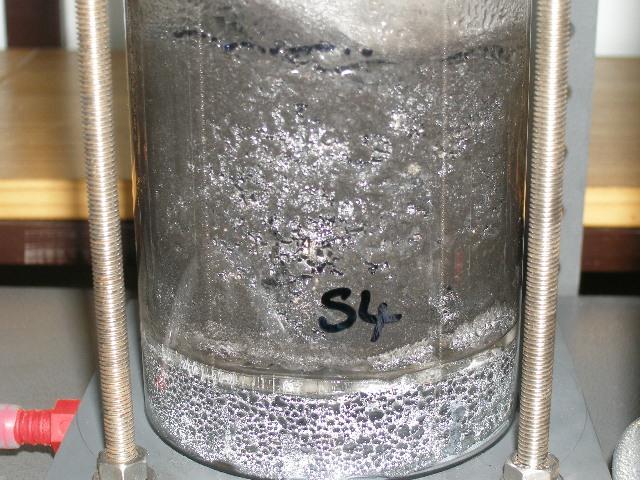

21 Humidity Cells in operation
22 Leach Cycles: Humidity Cells Leach Cycles - Startup Procedure (Initial Leach) (Week 0) - Weekly Leach Cycles (10 50 or more weeks) - Closedown Procedure (Last Leach) Weekly Leach Cycles: - Leach Cycle (1 day), followed by; - Dry Air Cycle (3 days), followed by; - Moist Air Cycle (3 days)
23 Procedures during Leach Cycle To each Humidity Cell add 750ml deonized water Allow each sample to soak for 2 hours Drain leachate into collection flask Record the volume of each leachate collected Filter leachate through a 45 µm filter into a polyethylene bottle Record the ph and EC of each leachate sample Submit the leachate of each sample to chemical analyses : Major cations & anions and metals (ICP) Submit data for geochemical modeling and prediction
24 Closedown Procedure Collect leachate from each Humidity Cell and conduct comprehensive chemical analyses Collect all original solids material from the Humidity Cell Air dry material and determine mass of sample Homogenize sample and collect representative sample for comprehensive geochemical characterization (ABA, NAG, paste ph, XRD, XRF) Submit data for geochemical modeling and prediction
25 Data Examples
26 Sample Paste PH ACID BASE ACCOUNTING: EPA-600 Modified Sobek Total S (%) Acid Generati on Potential (AP) CaCO 3 (kg/t) Neutralisation Potential (NP) CaCO 3 (kg/t) Netto Neutralisation Potential (NNP) CaCO 3 (kg/t) NP:AP Ratio HC : 0.01 I Rock Type HC : 0.01 I *Negative NP values are obtained when the volume of NaOH (0.1N) titrated (ph:8.3) is greater than the volume of HCl (0.1N) to reduce the ph of the sample to Any negative NP values are corrected to 0.00.
27 X-RAY DIFFRACTION MINERALOGICAL ANALYSES Mineral Composition (%) HC 1 HC 2 Gypsum 1 - Pyrrhotite 3 5 Pyrite 12 5 Magnetite 9 10 K-Feldspar+/Rutile - 4 Quartz Mica Kaolinite 5 - Kaolinite +/ Serpentine - 7 Amphibole 3 3 Garnet 7 7 Illite/Smectite Interstratification - 2 Samples are scanned from 2 to 65 2θ Cu Kα radiation at a speed of θ steps size / 1sec and generator settings of 40kV and 35mA. Phase concentrations are determined using relative peak heights/areas proportions (Brime, 1985).
28 X-RAY FLUORESCENCE SPECTROMETRY OF MAJOR ELEMENTS Major Elements Major Element Concentration (wt %) HC 1 HC 2 SiO TiO Al 2 O Fe 2 O 3 (t) MnO MgO CaO Na 2 O K 2 O P 2 O Cr 2 O L.O.I TOTAL H 2 O
29 X-RAY FLUORESCENCE SPECTROMETRY OF TRACE ELEMENTS Trace Elements Trace Element Concentration (ppm) HC 1 HC 2 As 47 <4 Ba 0.8% (8000 ppm) 1.1% ( ppm) Bi Ce Co Cr Cu Mo Nb Ni Pb 0.6% (6000 ppm) 0.8% (8000 ppm) Rb Sc 6 7 Sr Ta V Y Zn 0.9% (9000 ppm) 1.3% ( ppm) Zr
30 Chemical Parameter (mg/l) WEEK 0 WEEK 1 WEEK 2 WEEK 3 WEEK 4 WEEK 5 WEEK 6 WEEK 7 WEEK 8 ph EC (ms/m) Total Alkalinity as CaCO 3 <5 <5 <5 <5 <5 <5 <5 <5 <5 Ammonia as N Sulphate-SO Fluoride-F ICP-MS Scan (μg/l) WEEK 0 WEEK 1 WEEK 2 WEEK 3 WEEK 4 WEEK 5 WEEK 6 WEEK 7 WEEK 8 Al Ca Cd < Co Cu <0.05 < Fe K Mg Mn Ni Pb Zn

31 Data Trend over 200 Weeks Ref : INAP

32 Keno Hill Waste Dump Quartzite Ref : Infomine.com
33 Key Objectives of Kinetic Testing 1) Determine long-term stable reaction rates under kinetic conditions 2) Determine depletion times for acidgenerating, acid-neutralizing, and metal-leaching minerals Interpretation of these tests depend on calculating the above values
34 Calculations Acid Generation Acid Production Rate (mg CaCO 3 /kg/wk) = Acidity (mg CaCO 3 /L) * Volume Leachate Collected (L) / Sample Mass (kg) Sulphate Production Rate (mg/kg/wk) = Sulphate (mg/l) * Volume Leachate Collected (L) / Sample Mass (kg) Acid Neutralization and NP Consumption Alkalinity Production Rate (mg CaCO 3 /kg/wk) = Alkalinity (mg CaCO 3 /L) * Volume Leachate Collected (L) / Sample Mass (kg) Carbonate Ratio NP Consumption (mg CaCO 3 /kg/wk) = Carbonate Molar Ratio * Theoretical NP Consumption (mg/kg/wk), based on: 2H + + SO (Ca x, Mg 1-x )CO 3 (s) xca 2+ (1-x)Mg 2+ + SO H 2 CO 3 Or 2H + + SO (Ca x, Mg 1-x )CO 3 (s) 2xCa 2+ (2-2x)Mg 2+ + SO HCO 3 -
35 Metal Leaching Metal Leach Rates (mg/kg/wk) = Metal Concentration (mg/l) * Volume Leachate Collected (L) / Sample Mass (kg) Remaining Metal (% of original) = {Initial Metal Content (mg/kg) [(Cumulative Metal Leach Rate (mg/kg/wk) / Initial Metal Content (mg/kg)]} * 100%
36 In Conclusion Humidity Cells are excellent kinetic tests to supplement static ABA and NAG tests, supported by Geochemical Characterization (XRD and XRF) Humidity Cells supply rates of reaction and can provide a better assessment of on-site rates. Research has shown that the sulphate production rate to be an accurate assessment of the sulphide oxidation rate where high enough flusing rates are maintained to prevent secondary mineral precipitation
37 Costing of Humidity Cells Leach Tests Initial Geochemical Assessment (/ sample) : R *Humidity Cell Leaches, Operation & Analyses : R *Over a period of 10 weeks per cell Costing of Humidity Cells Fabrication Bank of Humidity Cells (10): Materials : Columns, Shelving, Pipes, Etc. : + R Labour : Fabrication & Assembly : + R
38 Thank You INAP : International Network for Acid Prevention host the ICARD (Int. Conf on ARD) every third year Infomine : IMWA : International Mine Water Association :