Arrium Mining. Continued Mining Success in the Face of Lower Iron Ore Prices. 11 th SAEMC 5 December 2014
|
|
|
- Mervin Daniels
- 5 years ago
- Views:
Transcription


1 Arrium Mining Continued Mining Success in the Face of Lower Iron Ore Prices 11 th SAEMC 5 December 2014
2 Disclaimer The information in this presentation that relates to Mineral Resources or Ore Reserves is based on information compiled by or under the supervision of Paul Leevers BSc (Hons), MSc Min Eng. Mr Leevers is a Member of The Australasian Institute of Mining and Metallurgy and is a full-time employee of OneSteel Manufacturing Pty Ltd. Mr Leevers has sufficient experience which is relevant to the style of mineralisation and type of deposit under consideration and to the activity being undertaken to qualify as a Competent Person as defined in the 2012 Edition of the 'Australasian Code for Reporting of Exploration Results, Mineral Resources and Ore Reserves. Mr Leevers consents to the inclusion in this report of the matters based on his information in the form and context in which it appears. The information in this presentation that relates to Exploration Results is based on information compiled by or under the supervision of Geoff Johnson BSc (Hons), PhD, Grad Dip Env Sc. Dr Johnson is a Fellow of the Australian Institute of Geoscientists and a Fellow of the Australasian Institute of Mining and Metallurgy and is a full-time employee of the Company. Dr Johnson has sufficient experience that is relevant to the style of mineralisation and type of deposit under consideration and to the activity undertaken to qualify as a Competent Person as defined in the 2012 Edition of the Australasian Code for Reporting of Exploration Results, Mineral Resources and Ore Reserves. Dr Johnson consents to the inclusion in this report of the matters based on his information in the form and context in which it appears. This presentation contains certain forward-looking statements with respect to the financial condition, results of operations and business of Arrium Limited and its Arrium Mining division and certain plans and objectives of the management of Arrium Limited and its Arrium Mining division. Forward-looking statements can generally be identified by the use of words such as project, foresee, plan, expect, aim, intend, anticipate, believe, estimate, may, should, will or similar expressions. All such forward looking statements involve known and unknown risks, significant uncertainties, assumptions, contingencies and other factors, many of which are outside the control of Arrium Limited, which may cause the actual results or performance of Arrium Limited to be materially different from any future results or performance expressed or implied by such forward looking statements. Such forward-looking statements speak only as of the date of this presentation. Factors that could cause actual results or performance to differ materially include without limitation the following: risks and uncertainties associated with the Australian and global economic environment and capital market conditions, previously undiscovered geological features, the cyclical nature of the steel industry globally, the level of activity in the construction and manufacturing industries in China, the occurrence of adverse weather events, the capacity, demand for and performance of the global shipping market, commodity price fluctuations, fluctuations in foreign currency exchange and interest rates, competition, Arrium Mining s relationships with, and the financial condition of, its suppliers and customers, legislative changes, regulatory changes or other changes in the laws which affect Arrium Mining s business, including environmental laws, a carbon tax, mining tax and operational risk. The foregoing list of important factors is not exhaustive. There can be no assurance that actual outcomes will not differ materially from these statements. This presentation contains certain non-statutory financial measures including average loaded cost on ship per tonne, average realised price, measurements of royalties and depreciation in respect of specific operations and assets, development and exploration costs, cash expenses and unconsolidated expenditure, revenue and other measures. These measures are used to assist the reader understand the financial performance of the Arrium Mining division's activities covered by this report. Non-statutory financial information has not been audited or reviewed as part of the Arrium Limited audited accounts. However, a process has been agreed with Arrium Limited s auditor to agree the financial inputs utilised by Arrium Mining to derive the measures stated in the report. 2
3 Presentation Overview Arrium Mining Footprint - Operations + Tenements Middleback Ranges Infrastructure Reserve Growth Exploration 3
 Tailored customer base (~70% contract, ~30% spot) Track record of delivering large scale projects per plan")
4 Mining Operations & Tenements Attractive quality blended export hematite ore products Leader in magnetite ore and processing Two operations Middleback Ranges and Southern Iron Whyalla Port ~13mtpa capacity Products: Whyalla & Opal Blend (average grade 60% Fe) Tailored customer base (~70% contract, ~30% spot) Track record of delivering large scale projects per plan 4

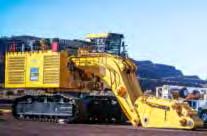
5 Middleback Ranges Origin of iron ore mining in Australia producing high quality ore for >100 years 10 pits across 4 operating areas: South Middleback Ranges (SMR) North SMR Iron Baron Iron Knob 2 ore beneficiation plants producing ~2Mtpa from ~4Mtpa of lower grade stockpiles Magnetite ore concentrator Feed for producing ~1.6Mtpa pellets for Steelworks ~400kt concentrate for blending or producing export pellets Operations include both owner (fixed assets) and contract (mobile assets) 5
 2.")


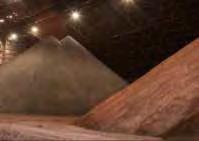
6 Middleback Ranges Clockwise from top right: 1. Iron Magnet Pit (SMR) 2. SMR Crushing Plant and Train Loading Facility (Magnetite Concentrator and Iron Duke Ore Beneficiation Plant in the background) 3. Iron Knight 1 and 2 Crushing Plants and Train Loading Facility (North SMR)
7 Operational flexibility Our resource portfolio provides flexibility to quickly alter our market offer to maximise earnings & cash Magnetite Ore (<47% Fe) Mineralised Waste (<47% Fe) Low Grade Ore (47 53% Fe) Medium Grade Ore (53-55% Fe) High Grade Ores (+55% Fe) Produce 67% Fe Concentrate for pellet production Mineralised Waste Produce 62% Fe via Beneficiation For Direct Shipping Blend (DSO) For Direct Shipping Blend (DSO) 7
8 Sales volumes Project Magnet targeted 4Mtpa for 10 years Achieved increase to 6Mtpa in FY10 through sweating supply chain Sales (Mt) Iron Ore Sales 12.5 Doubled sales to 12Mtpa rate mid 2013 Mining expansion Mt sales for FY14 up ~51% on FY13 (8.3Mt pcp) Q1 FY15 Run Rate ~ 13Mtpa - FY08 FY09 FY10 FY11 FY12 FY13 FY14 Iron ore fines Iron ore lump
 Hematite Fe% reduction due to addition of lower Fe% tonnages and depletion of original higher Fe% tonnages")
9 Track record of extending life Original expectation 4Mtpa for 10yrs Mt Reserves 28Mt (2007) to 67Mt (2013) (incls SI and depletion replaced) Hematite Reserves Hematite shipped / consumed over 7 year period expected to reach 47Mt Added 66Mt of reserve since 2007 to FY2013 (including SI) Hematite Fe% reduction due to addition of lower Fe% tonnages and depletion of original higher Fe% tonnages Tonnes increase supported by use of low grade ores either direct shipped/blended or beneficiated & cut off drop from 55% to 53%Fe (in YEJ13) Fe% Fe Original Fe Added Reserve Fe (1) 9
10 Ferrous exploration focus Exploration activity continues to focus on Adding to or extending mine life of existing operations to utilise full capacity of Whyalla Port Investigating further ferrous (hematite and magnetite) opportunities Middleback Ranges - Brownfield and greenfield Southern Iron - Peculiar Knob - Hawks Nest Conversion of hematite resource to reserves 10

11 Exploration MBR Development focus moving from west to east side of MBR Eastern side proving highly prospective and focus for brownfields hematite exploration over next 2 to 3 years Targets biased particularly to Iron Chieftain/ Baron / Queen / Cavalier Areas mineralisation close to surface and infrastructure. New prospective greenfield opportunities through Indigenous Land Use Agreements (ILUA) 11
 to current Iron Chieftain Resource area continues to end of")
12 Iron Chieftain Area Recent drilling and geophysical data has provided increased confidence in this region, hence a key priority Chieftain Intersections at surface or near surface low stripping ratio The Iron Chieftain extends North along edge of current ridgeline Geophysical modelling indicates similar magnetic signature (dark blue) to current Iron Chieftain Resource area continues to end of Range Rail Line is approximately 3 km from Northern extensions Potential extensions to North of Iron Knight on LHS of diagram remain untested 12

13 Iron Queen Area First added Queen to reserve tonnes YEJ13, target area highlights further near surface (low cost) ores being investigated for development High Grade hematite identified at Queen at/near surface, further extensions South and West extent and tonnages to be determined with further mapping and drilling Dark blue areas represent Magnetic Lows some correspond to hematite mineralisation at surface best intersection to date of 58% Fe from surface 13
 Based on limited historical drilling, exploration review and Iron Chieftain learnings some previous drilling campaigns were too high")
14 North Middleback Ranges Potential Low Capital Low Cost Opportunities Exposures of hematite mineralisation at/near surface along western side of range for over ~ 5km with limited drilling Hematite mineralisation potentially in areas of low magnetism (dark blue) Based on limited historical drilling, exploration review and Iron Chieftain learnings some previous drilling campaigns were too high in stratigraphy, potentially missing mineralisation Potential Low Capital Low Cost opportunities 14

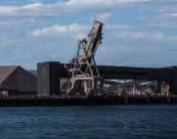
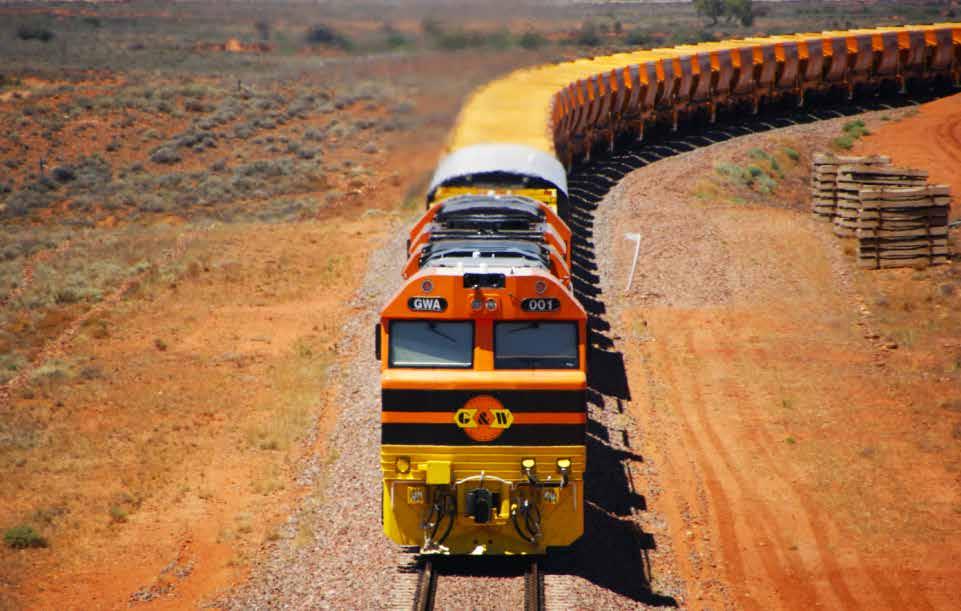
15 Summary ~13Mtpa iron ore producer with own infrastructure Wholly-owned and operated Port Port capacity ~13Mtpa Good basis for sales longevity Operational flexibility to maximise earnings and cash through varying grade, volume and cost Ferrous and non ferrous exploration Iron ore rail cars from Peculiar Knob to Whyalla 15
16