AnyCasting. Sand Casting Process. Advanced Casting Simulation Software. Introduction of AnyCasting Functions
|
|
|
- Anne Barton
- 5 years ago
- Views:
Transcription

1 AnyCasting TM Advanced Casting Simulation Software Introduction of AnyCasting Functions Sand Casting Process 1


")
2 AnyCasting TM Total Analysis of All Casting System 3-D Mold Filling Porosity, shrinkage/solidification, Mold 3-D Thermal Stress / Micro Structure / Mechanical Properties Filling Temperature Sprue Pins Core Gas Shrinkage Core Drag Cavity Main Window of AnyCasting System (SAND) Predict Several Defects (SAND) 2


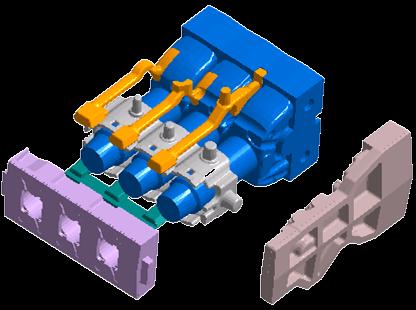
3 Assembly Control of CAD Data Import & Assemble of 3D CAD/CAM Data UG, CATIA, I-DEAS, Pro/E, etc. CAD Operations (Merge/Boolean/etc.) Classify Parts : Product, Runner, Gates, Channels, O/F & A/V AnyCasting CATIA UniGraphics Import PRO Engineering Solidworks User can use only STL format 3


4 System Configuration Software Structure AnyCasting Standard AnyPRE AnySOLVER AnyPOST AnyMESH AnyDBASE BatchRunner AnyCasting Performance HPDC/Thixo Module LPDC Module Permanent Mold (Tilt) Module Sand Module - Cast Iron - Cast Steel Large Ingot Module Investment Module AnyCasting Extensible Module anytx Advanced Material Properties Eject Pin Module anypost Reader 4
5 SW Configuration AnyCasting Work Flow Input Data & Solving & Observation Input Data Solving Observation - Modeling File (STL) - Meshing - Set Casting Condition - Using Multi Core Process - Dramatic Decreased Solving Time Fluid - Entrapped Air / Gas - Oxide - Temperature - Velocity - Leakage Solidification - Final Solidification Area - Micro / Macro Shrinkage 5

6 SW Configuration AnyCasting Work Flow Input Data & Solving & Observation Input Data - Modeling File (STL) - Meshing - Set Casting Condition - Meshing - Set TEMP. - Set HTC - Set Pouring Temp. - Set Shot Condition - Set Channel - Set Cycle Condition 6


7 SW Configuration AnyCasting Work Flow Input Data & Solving & Observation Solving - Using Multi Core Process - Dramatic Decreased Solving Time 7


8 SW Configuration AnyCasting Work Flow Input Data & Solving & Observation Observation Fluid - Entrapped Air / Gas - Oxide - Temperature - Velocity - Leakage Core Gas Filling Sequence Melt Velocity Temp. Distribution Solidification - Final Solidification Area - Micro / Macro Shrinkage Solidification Cast Iron Module - Tensile Strength 8
9 Development Roadmap V2.0 V4.0 V6.0 V6.3 - Oxide / Inclusion - Shot Sleeve - Vacuum - Advanced Melt Setting - Thermal Stress - Real Flow - Filter - Auto Report - Calculating Properties - Multi Language - Core Gas - Auto Mesh - Quantitative Analysis - Result Combination - Gas Entrapment - Advanced Cyclic Setting - Solver Speed Up - Win 10 Support - Channel Import / Export - Shrinkage Volume - Real Shape - Large Ingot - Centrifugal Casting - Chinese Version - Multi Core Process - Cast Iron - Eject Pin - Enhanced Particle Tracing - Advanced Channel - Exothermic Sleeve - CPU Core Setting - Jmat-Pro Import - Result Manager - Cross Section Save - Misrun - Fluid Rendering - anypost Reader V3.0 V5.0 V6.1 V


10 Exact View by Dynamic Arbitrary Section Observe Inside of All Entity Parts Dynamic Moving Section : X, Y, Z 3 Direction & Free Direction Detail Observation of STL Geometry in anypre & Calculation Result in anypost AnyPRE Process AnyPOST Process Show Section Only Rotating (Free Section) Moving 10


11 Auto Meshing 3-clicks is enough for mesh generation! Find the best meshing condition automatically Check thin sectioned area automatically AnyCasting S/W has Uniform / Variable / Auto Mesh System Generation of 21 Mil. Mesh : 3.5 sec Check important sectioned area by using Cross Section 11


12 Parallel process Up to 2-times Analysis Speed Improvement Test PC Performance - Intel i GHz / RAM 16GB Analysis Type - Filling & Solidification (1 CPU) (8 CPU) 12


13 Advanced Material Database User can Select 3 Database System General DB : anydbase has several commercial metal / non-metal database User DB : User can make database file by using anydb application Advanced Material : User can calculate material properties by using thermal property calculator General DB User DB Advanced Material (add on function) 13


14 Advanced Material Database Import Jmat-Pro Calculation Result File Enable to Import via File without License Enable to Input Material Properties that are not in Basic Database 14


15 Trace of Curved Boundary of Mold Interface Using Hybrid Flow Porous Media Method + Cut Cell Method Trace of curved boundary of mold interface by sub-divided mesh Calculate primitive variables at selected grid Scheme of Cut-Cell Method (Sub-Divided Mesh) Scheme of Porous Media Method 1. Preliminary Calculation at Staggered Grid Fluid Obstacle 2. Pressure Iteration at Un-staggered Grid Immersed Cell (Porous Media Scheme) Embedded Cell Approach When Needed Boundary Cell for Trace Interface Surface Cell Center : u c, v c, w c, V f, P, T, ρ, C p, k Face Center : u j, v j, w j, A j 15

 Filling Flow goes Faster along the")
16 Plexiglass-water Model Experiments Filling Accuracy Comparison with Plexiglass-water Model : Gravity Casting General FDM Solver Experiment Real Flow Solver (Porous Media + Cut Cell Media) (movie file) (movie file) Fluid Fills Runner Partially (Experiment & Real Flow) Filling Flow goes Faster along the bottom of Runner (same) 16


17 Filling Accuracy at Wall of Sand Mold - 1 Filling Accuracy in the Casting of Cat Iron Product Ductile Cast Iron / Sand Casting G4 G3 G2 G1 Gate 4, Filling Flow is Main Stream, It Fills near Gate 4 Fast, Move Forward during Filling Process G4 G3 G2 G1 Runner Filter Core Runner General FDM Solver Cavity Riser Hybrid Method (Real Flow) Gate 4, Filling Flow is Weak, It doesn t Contribute to Initial & Whole Filling Process. Core Bracket, Weight : 42 Kg FCD 600, Green Sand / Shell Core 17

 Changes : Metal")


18 Filling Accuracy at Wall of Sand Mold - 2 Temperature Distribution during & after Filling Ductile Cast Iron / Sand Casting General FDM Solver 50% Filled Temp. Distribution Hybrid Scheme (Real Flow) Changes : Metal Structure, Sol/ Shrinkage, Miss-Run, Sand Drops, Crack Area, etc. Gate 4, Filling Flow is Weak, Gate 4, Temp. is Lower, Lowest Temp. shows at Center Area. Gate 4, Filling Flow is Strong, Gate 4, Temp. is Higher, Lowest Temp. shows at Right Area. 100% Filled Temp. Distribution 18


19 Prediction of Macro Shrinkage PM + RMM (Retained Melt Modulus) or RMS (Retained Melt Surface) Tracing of Retained Melts, and Calculate Modulus or Surface Area mainly for Macro Shrinkages Shrinkage Strength Tracing of Retained Melts Volume and Surface PMM Result Coupling RMM or RMS with Probabilistic Model Shrinkage Size RMM : Retained Melt Modulus V M R. M. = S R. M. R. M. RMS : Retained Melt Surface Shrinkage size calculation by Distribution of total shrinking volume PM : Probabilistic Model PMM + PM Result 19
20 Prediction of Micro Shrinkage - 1 PM + Niyama Criterion / Feeding Efficiency G/V with Probabilistic Model Shrinkage Strength C Niyama C Niyama M Niyama = 1.0 G R Modified Niyama G = ts 1.0 (Ref. Minami Rin, July 2005) Criterion Developers Year G Bishop et. Al G / V s Davis / V s n Khan 1980 G / R 0.5 Niyama 1982 G /V s Lecomte-Beckers 1988 G 0.33 / V 1.67 s Lee et. al G 0.38 / V 1.62 s S.T. Kao et. al / t s m V s n F. Chiesa 1998 Coupling G/V Criterion with Probabilistic Model Feeding Efficiency G C F / Eff = V 0.5 Shrinkage Size Niyama + PM Probabilistic Model Shrinkage size calculation by Distribution of total shrinking volume 20

21 Prediction of Micro Shrinkage - 2 Micro Porosity Generation Mechanism of Micro Porosity 1. Generation of Nuclei 2. Gas & Solute Accumulate at Liquid / Solid Interface 3. Generation of Nuclei of Gas Bubble & Growth 4. Growth of Bubble Is Stopped by Surrounding Dendrites 5. Bubble Is Isolated & become Micro Porosity after Sol. Finished Gas (which has been Soluble in Melt) Accumulates at L+S Interface during Solidification. If Partial Pressure of Gas is Increased by Gas Concentration, Gas Bubble is Generated. Size of Bubble depends upon Gas Solubility, this depends upon Temp., P, Composition, etc. Gas Bubble Isolated by Dendrite Network in Mushy Zone in Later Sol. Stage. 21


22 Prediction of Micro Shrinkage - 2 Predict Micro Shrinkage Not Relating Retained Melt & G/V Prediction by RMS+PM(Probabilistic Model) Gas Partial Pressure N 2 Gas Porosity in Steel Casting Melt Pressure Gas Pressure > Melt Pressure + Insufficient Feeding Micro Porosity Defects 22
 9. Misrun 10. Fluid Rendering 11. Virtual Sensor 12.")
23 Feature of Sand Casting (Cast Iron / Cast Steel) Contents 1. Filter 2. Mold Erosion / Sand Drop 3. Core Gas 4. Exothermic Sleeve 5. Exothermic Powder 6. Pouring Basin & Stopper 7. Cast Iron 8. Shrinkage (Critical Solid Fraction) 9. Misrun 10. Fluid Rendering 11. Virtual Sensor 12. anypost Reader 23


 keep stable")
24 Accuracy Flow include Filter for Stable Filling Exact Filter Analysis & Consider all Directions Sprue 4 Direction Flow under installed Filter Condition Runner Filter No Filter Case Filter Case Filter Case (Pressure) Filter Case (Velocity) keep stable pressure keep stable velocity 24
 = Function of impact angle α V = Impact velocity constant constant particles The Relationship between Erosion Rate and Impact Angle The Relationship between Erosion Rate and")
25 Mold Erosion & Sand Drop Model kind of Mold Material & Melt Temperature are very Important Er = K mat K env CV n f (α) Er = Erosion rate( mg / s) K K mat env = Material = Environmental C = Concentration of f (α) = Function of impact angle α V = Impact velocity constant constant particles The Relationship between Erosion Rate and Impact Angle The Relationship between Erosion Rate and Velocity 25


26 Sand Drop Test by using Cylinder Block Compare Horizontal Design and Vertical Design Horizontal Casting Design Vertical Casting Design 26


27 Observe Melt Velocity During Filling for Judge Sand Drop Melt Velocity Distribution between Water Jacket and Core : Cylinder Block Horizontal Runner Design The rapid velocity of melt can be a cause of sand drop defect Vertical Runner Design 27

 equation Cold Box Sand Core Out Gas from Core (g) Gas in Cavity")
28 Core Gas Model Mathematical Formulation of Core Gas - Movement of Gas in Porous Core : Darcy s Flow - Core Gas Pressure : Ideal Gas Raw - Mass Transport Equation - Solid Binder Decomposition Rate : Arrhenius Relationship by Pyrolysis Study - Movement of Gas in Melt : Basset-Boussinesq-Oseen (BBO) equation Cold Box Sand Core Out Gas from Core (g) Gas in Cavity (g/cm 3 ) Core Print Cast Iron 28


29 Tracking Core Gas during Filling kind of Mold Material & Melt Temperature are very Important Horizontal Runner Design Horizontal design has higher possibility of Core Gas defect than Vertical design Vertical Runner Design 29
30 Exothermic Sleeve Model Exothermic Sleeve by Numerical Analysis - Insulating Sleeve : Sleeve for just adiabatic effect - Exothermic Sleeve : Automatically generate a heat when contact melt Main Factors for Calculating Exothermic Sleeve Sleeve Type Burning Time Ignition Temperature Heat Rate ( ρct ) t φ : Heat b φ = b + 0 ( < T f ( t)( T ( ρvt ) = ( k T ) Generation Ignition ) Ig intion ) + φ ( t) Rate [ cal / s cm b 3 ] 30

31 Exothermic Sleeve Model Simple Model Test : No Sleeve / Sleeve (Low & High Effect) - Insulating Sleeve : Sleeve for just adiabatic effect - Exothermic Sleeve : Automatically generate a heat when contact melt No Sleeve Low Effect Sleeve High Effect Sleeve 22mm 42mm 31

 + t : Surface distance ( ρvt ) = ( k T ) φ : Surface Heat Flux [ cal / s cm s δx s [ cm] φs + δx")
32 Exothermic Powder Model Exothermic Powder by Numerical Analysis - Raise the Feedability of Riser for reduce the shrinkage defect - Generally, be used Large Ingot & Huge Cast Steel Product Spread Exothermic Powder Control Solidification Direction Main Factors for Calculating Exothermic Powder Exothermal Area after Filling Surface Heat Flux by Time Surface Heat Temperature by Time ( ρct ) + t : Surface distance ( ρvt ) = ( k T ) φ : Surface Heat Flux [ cal / s cm s δx s [ cm] φs + δx 2 ] s ( t) 32


33 Exothermic Powder Model Exothermic Powder by Numerical Analysis - Raise the Feedability of Riser for reduce the shrinkage defect - Generally, be used Large Ingot & Huge Cast Steel Product Use Only Exothermic Sleeve Use Exothermic Sleeve & Powder Shrinkage Defect Shrinkage Defect 33

 Pouring Basin stopper Filling 20sec Non Stopper Filling 20sec")
 : stopper opens after filling a particular (ex:")
34 Pouring Basin & Stopper Model Basin & Stopper Model be used Special Casting Process - Feed mode can be selected under variable condition (continuously, once..,) - Additional pressure can be set inside of basin during filling - Stopper condition can be set 2 types (time, volume fraction) Pouring Basin stopper Filling 20sec Non Stopper Filling 20sec Stopper : hold 3sec Pouring Basin (Melt Feeding Rate) : melt amount be calculated automatically depend on cavity volume Stopper (Volume Fraction) : stopper opens after filling a particular (ex: pouring basin) entity with a certain amount of melt 34
 - Additional pressure can be set inside of basin during filling - Stopper condition can be set 2 types (time, volume fraction) Non Stopper Filling time : 3 sec Stopper Filling Time : 5 sec")
35 Pouring Basin & Stopper Model Basin & Stopper Model be used Special Casting Process - Feed mode can be selected under variable condition (continuously, once..,) - Additional pressure can be set inside of basin during filling - Stopper condition can be set 2 types (time, volume fraction) Non Stopper Filling time : 3 sec Stopper Filling Time : 5 sec Pouring Basin (Melt Feeding Rate) : melt amount be calculated automatically depend on cavity volume Stopper (Volume Fraction) : stopper opens after filling a particular (ex: pouring basin) entity with a certain amount of melt 35
36 Cast Iron Module Predict Phase Distribution & Mechanical Properties - Consider Effect of Chemical Composition (Si, Mn etc..,) - Consider Fading Effect of Inoculation 36


37 Cast Iron Module Predict Phase Distribution & Mechanical Properties - Consider Effect of Chemical Composition (Si, Mn etc..,) - Consider Fading Effect of Inoculation Gray Cast Iron : A48 Phase Distribution of Pearlite Gray Cast Iron : A48 Mechanical Property of T S 37

38 Prediction of Misrun Defect Area Predict the Misrun Defects caused by Temperature Drop of Melt During the Analysis, Melt Filling will be Stopped by the Misrun Algorithm Show Likely-to-be Misrun Area, Show Precise Result Misrun OFF Misrun ON Misrun 38


39 Observation of Internal Filling by using Fluid Rendering Melt Display Translucently Enable to Observe Internal Changes When Checking Filling Enable to see Internal Results without Cross Section Fluid Rendering Mode : Off Fluid Rendering Mode : On 39

40 Fluid Rendering with Particle Tracing Particle Tracing Result + Display Fluid Flow When Observing, It Shows Fluid Flow as Well Enable to Clearly Understand the Process of Melt Filling by Checking Combined Result 40


41 Virtual Sensor Needless Re-calculation for Check Non-Sensor Installed Area Enable to View Time/Temperature Graph of Sensor not-installed Area Enable to View Each Area s Time/Temperature Graph by Mouse Click Use Picking Mode by using Mouse Click 41


42 anypost Reader Use anypost Function in PPT Insert Analysis Result File(*.acres file) into PPT and Check Enable to use Various Functions: Rotation, Zooming etc. anypost Reader File (*.acres) 42
43 Thank you Homepage : Tel : Fax :