Electronic Supplementary Information. High rate capability supercapacitors assembled from wet-spun
|
|
|
- Todd Chambers
- 5 years ago
- Views:
Transcription
1 Electronic Supplementary Material (ESI) for Journal of Materials Chemistry A. This journal is The Royal Society of Chemistry 2014 Electronic Supplementary Information High rate capability supercapacitors assembled from wet-spun graphene films with CaCO 3 template Gao *a Tieqi Huang, a Bingna Zheng, a Zheng Liu, a Liang Kou a and Chao a MOE Key Laboratory of Macromolecular Synthesis and Functionalization, Department of Polymer Science and Engineering, Zhejiang University, 38 Zheda Road, Hangzhou , P. R. China. * chaogao@zju.edu.cn
2 Experimental Materials: All the reagents were of analytical grade and used as received. GO was prepared according to a modified Hummers method from natural graphite as previously reported. 1 Preparation of WGF: As shown in Figure 1, WGF was prepared by wet-spinning of GO liquid crystalline dope (10 mg/ml) into a coagulation bath (CaCl 2 5 wt %, ethanol: H 2 O = 1:3), followed by growth of calcite crystals in a crystallization bath contained 5 wt % Na 2 CO 3 aqueous solution, chemical reduction of GO by 20 wt% hydrazine hydrate at 85 o C, and etching of calcite with 1 M HCl. Preparation of GF: The control film of GF was prepared by wet-spinning of GO liquid crystalline dope (10 mg/ml) into a coagulation bath (CaCl 2 5 wt %, ethanol: H 2 O = 1:3), followed by washing with pure water and then chemical reduction of GO by 20 wt% hydrazine hydrate at 85 o C. Preparation of pwgf and pgf: g aniline was dropped in a flask, which contained 5 ml ethanol and 15 ml 1 M perchloric acid. It was stirred for half an hour before WGFs were dipped in. After 1 h, g ammonium persulfate in 5 ml perchloric acid was added to the flask dropwise. The reaction was kept at -10 o C without stirring for 24 h. Then the films were washed with 0.1 M perchloric acid to obtain pwgfs. Using GFs to replace WGFs, pgfs were prepared with the same protocol as the case of pwgfs. Characterization: SEM and EDS were conducted on Hitachi S XRD was measured by Rigaku D/max-2500, using graphite monochromatized CuK α radiation. Electrochemical measurements were carried out in cells with two symmetrical electrodes, using a mixed cellulose esters membrane as separator (pore size 0.22μm), platinum foils as current collector, and 1 M
3 H 2 SO 4 as electrolyte. CV, GC and EIS tests were performed using an electrochemical workstation (CHI660e, CH Instruments, Inc.). Mechanical property tests were carried on a HS-3002C at a loading rate of 10% per minute. Nitrogen cryoadsorption was measured by AUTOSORB-IQ-MP (Quantachrome Inc., USA) and the sample was outgassed under vacuum at 150 o C for 1 h before measurement. The SSA was obtained by Brunauer-Emmett-Teller (BET) analyses of the adsorption isotherm. Total pore volume was calculated from the N 2 adsorption amount at P/P 0 = Z. Xu, C. Gao, ACS Nano 2011, 5, 2908.
4 Tables: Table S1. Comparison of rate performance. (HI: high current density tested by the specific authors) Preparation method HI SC of the SC retention of SC of our SC retention of (A/g) author at HI the author at HI work at HI our work at HI Ni foam based GF-SC % % GF-SC gel % % GF-SC+CNT % % MgO model GF-SC % 152~164 86%~93% Carbon nanocage % % GF-SC wet paper % Comparison % GF-SC wet foam % % Anti-solvant GF-SC % 152~164 86%~93% Vertically bridging GF-SC % % GF-SC compact wet paper % % SiO2 model GF-SC % 164~170 93%~96% PIL-GF-SC % %
5 Table S2. Comparison of rate capability of supercapacitors with pseudocapacitance. (HI: high current density tested by the specific authors) Materials SC at 1A/g HI (A/g) SC retention at HI (F/g) % pwgf of this work % % PANI-RGO % PANI-RGO % PANI-RGO % PANI-RGO % 1 H. Huang, L. Xu, Y. Tang, S. Tang, Y. Du, Nanoscale 2014, 6, U. N. Maiti, J. Lim, K. E. Lee, W. J. Lee, S. O. Kim, Adv. Mater. 2014, 26, X. Lu, H. Dou, B. Gao, C. Yuan, S. Yang, L. Hao, L. Shen, X. Zhang, Electrochim. Acta 2011, 56, G. Ning, Z. Fan, G. Wang, J. Gao, W. Qian, F. Wei, Chem. Commun. 2011, 47, K. Xie, X. Qin, X. Wang, Y. Wang, H. Tao, Q. Wu, L. Yang, Z. Hu, Adv. Mater. 2012, 24, X. Yang, J. Zhu, L. Qiu, D. Li, Adv. Mater. 2011, 23, F. Liu, S. Song, D. Xue, H. Zhang, Adv. Mater. 2012, 24, Y. Yoon, K. Lee, C. Baik, H. Yoo, M. Min, Y. Park, S. M. Lee, H. Lee, Adv. Mater. 2013, 25, Z. Bo, W. Zhu, W. Ma, Z. Wen, X. Shuai, J. Chen, J. Yan, Z. Wang, K. Cen, X. Feng, Adv. Mater. 2013, 25, X. Yang, C. Cheng, Y. Wang, L. Qiu, D. Li, Science 2013, 341, Y. Korenblit, M. Rose, E. Kockrick, L. Borchardt, A. Kvit, S. Kaskel, G. Yushin, ACS Nano 2010, 4, T. Y. Kim, H. W. Lee, M. Stoller, D. R. Dreyer, C. W. Bielawski, R. S. Ruoff, K. S. Suh, ACS Nano 2010, 5, J. H. Lee, N. Park, B. G. Kim, D. S. Jung, K. Im, J. Hur, J. W. Choi, ACS Nano 2013, 7, J. Benson, I. Kovalenko, S. Boukhalfa, D. Lashmore, M. Sanghadasa, G. Yushin, Adv. Mater. 2013, 25, Y. Meng, K. Wang, Y. Zhang, Z. Wei, Adv. Mater. 2013, 25, 6985.
6 16 H. Cao, X. Zhou, Y. Zhang, L. Chen, Z. Liu, J. Power Sources 2013, 243, 715.
7 Calculations: (1) The specific capacitance calculated by CV: C s Ñ IdU m u U U ( 2 1) Where C s (F/g), m (g), u (V/s), U 2 and U 1 (V), and I (A) are the gram specific capacitance, the weight of single electrode, scan rate, high and low potential limit of CV tests, and the instant current of CV curves, respectively. (2) The specific capacitance calculated by GC: 2 I t Cs m U Where C s (F/g), I (A), t (s), ΔU (V), and m (g) are the gram specific capacitance, the discharge current, the discharge time, the potential window and the weight of single electrode, respectively. (3) The volume capacitance and area capacitance are calculated as followed: Cs m Cv V Cs m Ca A Where A (cm 2 ), V (cm 3 ), and m (g) are surface area of one electrode, volume of one electrode and weight of on electrode, respectively.


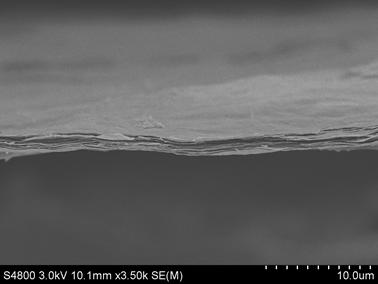

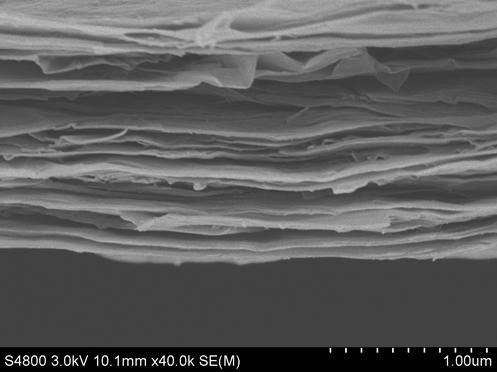
8 Figures: Figure S1. EDS images of CaCO 3 -GF. Figure S2. SEM images of WGF and its corresponding carbon. Figure S3. SEM images of GF in three different magnifications.
9 Current density / (A*g -1 ) WGF-SC GF-SC Potential / V Figure S4. Comparison of the CV curves of WGF-SC and GF-SC, the scan rate is 10 mv/s. Potential / V WGF-SC GF-SC Time / s Figure S5. Comparison of the GC curves of WGF-SC and GF-SC, the current density is 1 A/g.
10 C s / C Cycle number Figure S6. Stability of WGF-SC, the current density is 10 A/g. (C 0 : the initial C s of first test cycle) WGF dv(d) Diameter / nm Figure S7. Pore distribution of WGF.

11 GF dv(d) Figure S8. Pore distribution of GF Diameter / nm Figure S9. SEM image of pwgf.
12 Potential / V pwgf-sc pgf-sc Time / s Figure S10. Comparison of the GC curves of pwgf-sc and pgf-sc at the current density of 1 A/g. Potential / V V 0.06V pwgf-sc pgf-sc Time / s Figure S11. Comparison of the GC curves of pwgf-sc and pgf-sc at the current density of 100 A/g pwgf-sc -Z''/ohm Figure S12. EIS of pwgf-sc Z'/ohm

13 Figure S13. SEM of pgf. Cs / C Cycle number Figure S14. Stability of pwgf-sc, the current density is 10 A/g. (C 0 : the initial C S of first test cycle)