Quality of ductile iron
|
|
|
- Bridget Atkinson
- 5 years ago
- Views:
Transcription
1 Quality of ductile iron It is in the eye of the beholder Al Alagarsamy THORS
2 What is quality? Properties? Can we quantify it? Soundness gas and shrinkage Absence of inclusions Absence of carbides chill, inverse, grain boundary Graphite shape, Graphite size, amount of graphite (area/volume) Distribution of graphite random not preferred orientation Matrix ferrite pearlite - distribution Hardness T/Y/E plot Quality index -? T/H ratio -? Surface properties??? Variability

3 D.L. Crews(1974), based on Siefer and Orths (1970) proposal, using ASTM minimum properties as base Pay attention to the points represented here by small circles throughout this presentation
4 Carl Loper, Jr. and R.M.Kotschi Made the relationship linear Base is same as ASTM minimum properties curve based on earlier ductile production practice Which had higher silicon and nickel levels than current production This reflects the difference between ASTM and the ISO property curve is the most used spec for ductile every one made room for that one.
5 What does quality mean when there are so many combinations of chemistry, section size and processes? Can quality be higher than 100%? Is quality measured against an average or maximum potential possible? Like nodularity max is 100% spheroidal shape and comparison to it. For ductile iron how a customer can compare the quality from one supplier to another? Is 100% nodularity enough? Castings are designed for the lowest common denominator hence the mediocre conditions pass. Should it be? To reduce weight and compete with light weight materials, what can we do assure the designers, the properties are there consistently with minimal variations?
6 Yield N/mm2 If we are going to use a standard for comparison, which one should we use? Have we dumbed down the specs? ISO SAE ASTM Power (ASTM) Percent elongation
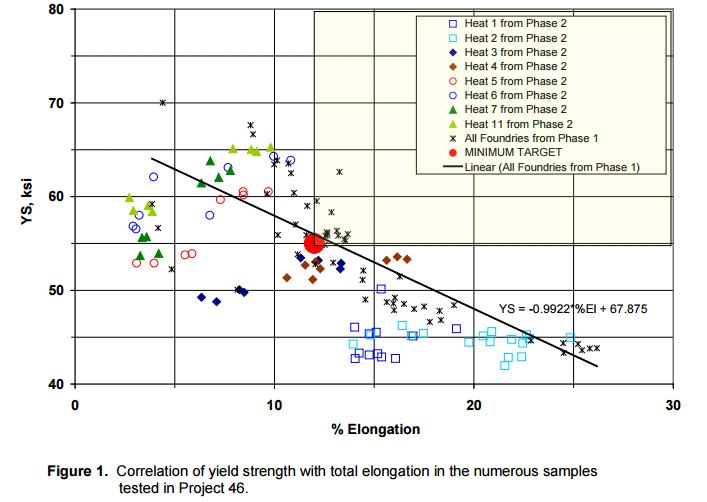
7 Yield KSI Yield versus elongation grades L Br ASTM Ne cc m-m m-45 Power (ASTM) Elongation
8 Yield MPa A tale of two samples. 550 Cust1 ASTM ind lab int casting jc int old Power (ASTM) T = 76.7ksi Y=51.2 ksi E = 4.8% HB = 207 QI = 28.2 T/H = T=69 ksi Y=43.3 ksi E = 20% H = 170 QI = 95 T/H = Elongation Percent


9 What is wrong with the anomalous point? the one at left. Looks okay to most people unless some property fails to meet requirements like elongation here? There were no obvious foundry defects.


10 Etched structure look at the path of failure Near fracture Across the fracture
11 How to assign quality index? Quality index# = (T 2 /1000)*E (T = tensile in ksi, E = % elongation) QI = ((76.7) 2 * 4.8)/1000 = Is the ductile that bad? ᵻ T.S= /(E) 0.61 (ASTM minimum property graph) (-12%) T/H = (76.7/207)*0.703 = (Range for good ductile ) HB proportional to compression strength (HB*9.81 = MPa) Tensile strength is a fraction of compression strength Gray irons T/H = #D.L. Crews Quality and specifications of Ductile Iron, AFS Trans, 1974 (based on Siefer and Orths, AFS Trans. 1970). Discussion by ᵻ Carl Loper Jr, and R.M. Kotschi.
 No Bake molds, 1 Y block test bar inside the mold attached to casting C = 3.56 Si = 2.4 Mn = 0.")
12 The point on the right: T-69ksi, Y-43.3ksi, 20%E, 170HB ( QI =95.22, +15%, T/H =0.285 ) No Bake molds, 1 Y block test bar inside the mold attached to casting C = 3.56 Si = 2.4 Mn = 0.47 Ni = 0.7 Cu = 0.14

13 Pearlite is not contributing to tensile even as it influences hardness. Ferrite is continuous hence elongation and yield strength is corresponds to ferrite properties. When ferrite is discontinuous, average takes over. Ferrite percent = 85, Hardness = 147 Pearlite =15 Hardness = 320 Then bulk or measured hardness = 0.85* *320 = =173 Tensile and yield will correspond to ferrite hardness of 147
14 What are the reasons for the increase in the T/H ratio with Tensile? Why mean value of T/H for 80/55/06 higher than 100/70/03 and 65/45/12, or is it? Series1 Series2 Series3 Linear (Series1) Linear (Series2) Linear (Series3)
15 Different grades, Why the shift?
16 Tensile strength -> Elongation -> Properties are not linear all the way what is the maximum potential for given hardness? No ferrite Cont-ferrite Hardness -> Slope of line, T/H = Highest, T/H = Lowest, T/H=0.276
17
18 What is the potential for a given chemistry? For as cast ferritic/pearlitic ductile iron Potential for what? 1. chemistry, 2. cooling rate.(nodularity, carbides) If chemistry is correlated to certain ferrite/ pearlite depending on cooling rate, the result is proportional to hardness. Can then potential be estimated for that hardness T, Y, E? From this potential various casting sections with various cooling rates and hardness can be expected to produce certain property values? Ductile properties app helps to determine the pearlite ferrite for a given section size, and strength values form that hardness. It can be fine tuned to determine the quality index? Start with eutectic CE (C+0.25Si = 4.3)
19 What are the reasons for variability? Chemistry? Cooling rate? Inoculation? Nodule count, size distribution? Austenite grain size? Matrix distribution what factors affecting? How to take advantage of segregation of Mn? Melt quality affecting casting quality Inoculation practice When and where at what temperature, what alloy and how much Gating - dissolution of inoculants and solidification rate of castings
20 What next? What is the present state of quality? Audit of existing practices Between plants, between grades, between processes Test bars size and measurement variations Common for testing (like sand tests DIS Project #40, Survey of Green sand properties) Microstructure correlation to mechanical properties from the test bars and quality to processing conditions Identify and recommend best practices