THE QUEST for SWEET SPOTS in an UNCONVENTIONAL OIL RESERVOIR. G.B. Asquith, TEXAS TECH
|
|
|
- Lesley Cory Fletcher
- 5 years ago
- Views:
Transcription
1 THE QUEST for SWEET SPOTS in an UNCONVENTIONAL OIL RESERVOIR G.B. Asquith, TEXAS TECH
2 KEY FACTORS for ECONOMIC SHALE [modified after: Rick Lewis (2013)] RESERVOIR QUALITY Hydrocarbons in Place [OOIP] Matrix Permeability [T2 CUT OFFS & KSDR] Pore Pressure COMPLETION QUALITY Hydraulic Fracture Surface Area [ Fracturability ] Hydraulic Fracture Conductivity Hydraulic Fracture Containment
3 QUICK LOG SCAN EVALUATIONS Rt > 15 ohm-m [resistivity] modified after: Lewis, 2009 w/ SCHLUMBERGER GR > 150API [gamma ray] not critical in carbonate-rich shales ρb < 2.53g/cc [Φdls >11% Φdss>7%] Φnls < 35% [Φnss<39%] Φnls>35% [Φnss>39%] & Rt <=10ohm-m indicates Smectite which is BAD. Pe < 4 barnes/electron [Quartz Pe = 1.81] Neutron Porosity Sonic Porosity Display [Φsonic > ΦNls] Pe versus RHOb Cross Plot Walls & others, 2012
4 Walls, J., B. Driskell, S.W. Sinclair, & J. Devito, (2012), Reservoir Characterization in the Eagle Ford Shale using Digital Rock Methods: WTGS 2012 Fall Symposium, Publ. No Dual Energy (CT) whole core imaging for quick evaluation and sample selection for shale quality indication ( shale sweet spots ). High resolution (0.5mm) BULK DENSITY (RHOb) and PHOTOELECTRIC FACTOR (PEF).
 WTGS 2012 FALL")
5 Modified After: Walls & others (2012) WTGS 2012 FALL SYMPOSIUM
6 Marcellus Shale Lithofacies [modified after: Wang & Carr, 2013] QU CARB PREFERRED LITHOFACIES CLAY TOC DUCTILE OSS-organic siliceous shale OMS-organic mixed shale OMD-organic mudstone GSS-gray siliceous shale GMS-gray mixed shale GMD-gray mudstone CARB-limestone DUCTILE PERCENT OSS OMS OMD GSS GMS GMD CARB
7 Marcellus Shale Lithofacies [after: Wang & Carr, 2013] 3 CALCITE Pe<4.0 RHOb>2.53 Less Φ and/or Kerogen Less Calcite More Clay CARB GMS Pe>4.0 RHOb>2.53 Less Φ and/or Kerogen More Calcite QUARTZ KEROGEN ILLITE 2.6 GSS GMD RHOb [g/cc] RHOb = 2.53 Pe<4.0 RHOb<2.53 More Φ and/or Kerogen OSS OMD OMS Pe>4.0 RHOb<2.53 More Φ and/or Kerogen More Calcite 2.2 Pe = Pe [barnes/electron]
8 Gamma Ray [SGR & CGR] and Resistivity [HRLA] Permian Wolfcamp GR (APIU) Wolfcamp # ft Wolfcamp #2 Rxo HRLA CGR SGR HRLA
9 Gamma Ray [SGR & CGR] Neutron-Lithodensity Log Permain Wolfcamp GR (APIU) Wolfcamp # ft Wolfcamp # CGR SGR Pe ΦNls ΦDls Pe 10
10 Lithology [ECS], Porosity and Saturation Permian Wolfcamp ft Wolfcamp #1 Total OOIPstb/160ac. 11.8mmbo Wolfcamp #2 Vcl Vcal Vqtz Vpyr Vke Φoil CBW WTR
11 Resource w/ T2 [ms] Cut-Offs Applied Modified After: Rylander, 2014 w/ SCHLUMBERGER
12 Thermal Maturity [Ro] & Non-Producible Bitumen Very high PERCENT BITUMEN Very low Ro = Ro = 2.0 Immature Bitumen 2.73% % Oil Wet Gas + Oil Wet Gas + Condensate Dry Gas Bitumen 0.05% % NOTE: As maturity increases the non-producible bitumen is converted to producible oil and gas. The problem is that the non-producible bitumen is calculated as producible HC in a standard log analysis [OOIPstb or OGIPscf]. % Bitumen from: Lewis (2013)
13 TOTAL POROSITY EFFECTIVE POROSITY SHALE POROSITY Total Φoil = Φom+[(1-Sw) Φmm]+Φbitumen Free HC Volume %Ro < 0.8 Φom Φmm Φom Φmm KEROGEN KEROGEN MATRIX MINERALS MATRIX MINERALS %Ro > 0.8 Non-Producible Bitumen [Φbitumen] Free & Adsorbed Oil in Organic Pores in the Kerogen [Φom]. Free Oil & Water in Mineral Matrix Pores [Φmm]
14 TOTAL POROSITY EFFECTIVE POROSITY SHALE POROSITY Total Φgas = Φom+[(1-Sw) Φmm]+Φbitumen Free HC Volume %Ro > 1.5 Φom Φmm KEROGEN MATRIX MINERALS Non-Producible Bitumen [Φbitumen] Free & Adsorbed Gas in Organic Pores in the Kerogen [Φom]. Free Gas & Water in Mineral Matrix Pores [Φmm] NOTE: Unlike OIL Adsorbed GAS can be Desorbed.
15 ELIMINATING BITUMEN [%Ro versus Φbitumen]
16 Φbitumen Ro versus Non-Producible Bitumen [Φbitumen] 6 Φbitumen = Ro^ Data From: Lewis, 2013 & Rylander, 2014 AAPG BWLA School Ro vs. Φbitumen Plot From: Asquith, 2014 OOIPstb = [(7758 (Φoil-Φbitumen) h A]/BOI Ro(avg.) = 0.89 n = 43 Φbitumen = Avg. Six Samples Immature OIL Wet Gas + Oil Ro Wet Gas + Condensate 6 Dry Gas
17 Lithology [ECS], Porosity and Saturation Permian Wolfcamp ft Wolfcamp #1 Total OOIPstb/160ac. 11.8mmbo Bitumen Corrected 4.9mmbo Wolfcamp #2 Vcl Vcal Vqtz Vpyr Vke Φoil CBW WTR
18 OOIPstb Bitumen Corrected Permian Wolfcamp , ,000 30,000 40,000 GR (APIU) 0.5 Intervals Wolfcamp # ft Wolfcamp # CGR SGR OOIPstb/160ac. 4.9mmbo OOIPstb = [7758 (Φoil-0.016) ]/
19 ELIMINATING BITUMEN [S1 from Rock EVAL PYROLYSIS]
 Transformation Index [TI] = S1/TOC Potential Yield [PY] = S1+S2 CID IGI Lld, 1997 Dwg.")
20 ROCK EVAL PYROLYSIS S2 S1 Volatile Hydrocarbons S2 Bitumen & Kerogen S1 80C 25C/min Furnace FID %Ro(calc.) = (0.018 Tmax)-7.16 S3 He Hydrogen Index [HI] = S2/TOC Oxygen Index [OI] = S3/TOC Production Index [PI] = S1/(S1+S2) Transformation Index [TI] = S1/TOC Potential Yield [PY] = S1+S2 CID IGI Lld, 1997 Dwg. No, 97 FID = Flame Ionization Detector; TCD = Thermal Conductivity Detector
21 TOTAL ORGANIC CARBON [TOC] SUBSURFACE Kerogen Bitumen Light Oil S2 S1 CORES or CUTTINGS [NON-EXTRACTED] Kerogen Bitumen Residual Light Oil Kerogen S2 S2 CORES or CUTTINGS [EXTRACTED] S1 Overlap IN THE LAB Dean Starks [Bitumen+Light Oil] Retort [Bitumen] and [Light Oil]
22 OOIP from PYROLYSIS S1 DATA OOIP = Σ[(S ) h 160ac.] OOIP = Σ[ ρb S1 (1/ρoil) h]
23 TOC(wt%) PERMIAN WOLFCAMP TOClab(wt%) avg. 2.2 N = 260 %Ro = 0.89 TOCschmoker(wt%) avg. 3.3 N = 1089
24 TOClab versus Pyrolysis S1 Permian Wolfcamp 7.00 Pyrolysis S OOIP = Σ[ ρb S1 (1/ρoil) 0.5 ] 4.6mmbo/160ac. OOIP = Σ[(S ) ] 4.4mmbo/160ac. S1 = TOC R^2 = N = 260 After: Asquith, 2014, & TOClab
25 Lithology [ECS], Porosity and Saturation Permian Wolfcamp ft Wolfcamp #1 Pyrolysis S1 OOIP/160ac. 4.6mmbo/4.4mmbo Wolfcamp #2 Vcl Vcal Vqtz Vpyr Vke Φoil CBW WTR
26 ELIMINATING BITUMEN and ADSORBED OIL [CMR/NMR LOGS]

27 Φmm NOTE: ALL the very small kerogen pores contain only non-moveable adsorbed oil. PROBLEM: S1 includes Free and Adsorbed OIL. Kerogen Water
28 NMR PETROPHYSICAL MODEL Clay Bound Water & Bitumen Eliminated 3ms 1 T2 Surface Relaxation TCMR T2 Bulk Relaxation Kerogen Bitumen viscosity >10,000cp 0.3ms [limit of NMR] Bitumen viscosity <10,000cp Clay Bound Water ms Pore Size 76.5nm Free Oil & Adsorbed Oil 100 Pore Size 2,500nm Free Oil & Water [conventional pores] T2 [ms] Capillary Bound Water 10 Pore Size 250nm 33ms Pore Size 827.5nm 1,000
29 T2 DISTRIBUTIONS from CMR/NMR CORE and CMR/NMR LOG [Downhole] [modified after: Rylander & others, 2013] Estimated water signal and water saturation from T1/T2 Ratio. POROSITY (p.u.) Water signal removed from core and CMR log data. Bound-Oil [Bitumen] Producible Free Oil Pore Throats 20nm Pore Size 250nm T2 (ms)
30 NMR PETROPHYSICAL MODEL Moveable 3ms 10ms 33ms 100ms 1 T2 Surface Relaxation TCMR T2 Bulk Relaxation Kerogen Bitumen viscosity >10,000cp 0.3ms [limit of NMR] Bitumen viscosity <10,000cp Clay Bound Water ms Pore Size 76.5nm 100 Pore Size 2,500nm Free Oil & Water [conventional pores] T2 [ms] Free Oil & Adsorbed Oil Capillary Bound Water 10 Pore Size 250nm 33ms Pore Size 827.5nm 1,000
31 Petrophysical Characterization of the Pore Space in Permian Wolfcamp Rocks [Rafatian and Capsan, 2015] PETROPHYSICS VOL. 56, No. 1, p the largest pore spaces and, by proxy, the largest continuous connected pore throats, have the largest impact on fluid flow
32 Lithology [ECS], Porosity and Saturation Permian Wolfcamp ft Wolfcamp #1 Pyrolysis S1 4.6mmbo/4.0mmbo OOIP/160cc. Vcl Vcal Vqtz Wolfcamp #2 T2>10ms 3.1mmbo T2>100ms 1.7mmbo Vpyr Vke Φoil CBW 1394 WTR
33 Mobile OOIP/160ac. Multiple Cut-Offs: Permian Wolfcamp GR (APIU) 0.5 Intervals Wolfcamp # ft Wolfcamp # CGR SGR Total OOIPstb/160ac. 11.8mmbo OOIP T2>10ms Cut-Off [S1]: 3.1mmbo OOIP T2>100ms Cut-Off [S1] 1.7mmbo
34 MATRIX PERMEABILITY [KSDR PERMEABILITY]
35 KSDR PERMEABILITY After: Rick Lewis (2015) SCHLUMBERGER SEMINAR Midland, Texas KSDR = [C (Φcmr)^2 (T2LOG)^2] 10^6 KSDR in nannodarcies C = 0.35 OIL Φcmr = Total CMR Porosity T2LOG = Logarithmic Mean T2 Distribution KSDR Permeability Cut-Off > 300nD
36 What Do We Look For (Shale-Associated Oil Production)? Higher absolute permeability than in gas shales [~1 microdarcy (1000nD) minimum and preferably much higher]. NanoDarcy-scale mudstone permeabilities are too low for economic oil production rates. [modified after: Brown, 2015, SWAAPG] 36
37 KSDR Permeability [µd]: Permian Wolfcamp GR (APIU) microdarcy Wolfcamp # µD 100ft Wolfcamp # CGR SGR
38 KEY FACTORS for ECONOMIC SHALE [modified after: Rick Lewis (2013)] RESERVOIR QUALITY Hydrocarbons in Place [OOIP] Matrix Permeability [T2 CUT OFFS & KSDR] Pore Pressure COMPLETION QUALITY Hydraulic Fracture Surface Area [ Fracturability ] Hydraulic Fracture Conductivity Hydraulic Fracture Containment
39 GEOMECHANICS & FRACTURABILITY
40 Poisson s Ratio [µ] & Young s Modulus [E] Poisson s Ratio [µ] µ = [(0.5 r^2)-1]/(r^2-1) r = ITTs/ITTc Fracturability the likelihood of formation failure under stress. Young s Modulus [E] E = {2 [(ρb/itts^2) ^10]} (1+µ) The ability to maintain a fracture.

41 ft
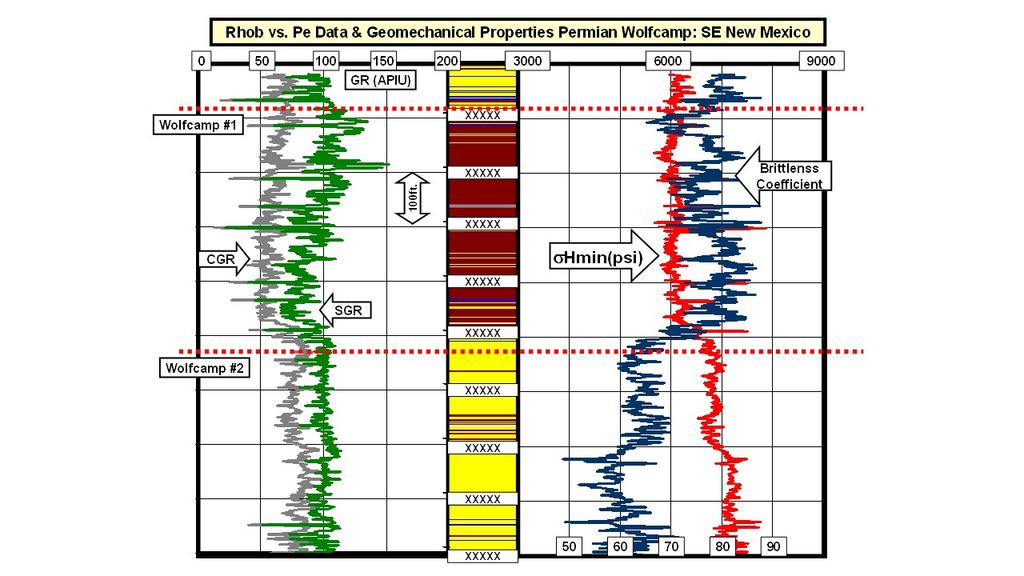
42 Minimum Closure Stress (σhmin) & Brittleness Coefficient σhmin = [µ/(1-µ)] [σv-χ Pp)]+(Χ Pp) Brittleness Coefficient = 50 {[(E-1)/7]+[(0.4-µ)/0.25]}
43
44 CONCLUSIONS The application of T2 Cut-Offs to OOIPstb plus Pyrolysis S1 Data can be used to define the distribution of the larger pores with free hydrocarbons which have the greatest impact on fluid flow. When OOIPstb determine from S1 data and T2 cut-offs is combined with RHOb and Pe cut-offs the unconventional reservoir s SWEET SPOT with lower Poisson s Ratio and higher Youngs Modulus can be delineated.