Optimization of a Continuous Wet Granulation Process by Understanding Granule Properties
|
|
|
- Bernice Shaw
- 5 years ago
- Views:
Transcription
1 Optimization of a Continuous Wet Granulation Process by Understanding Granule Properties Presented By Andrew Birkmire Process Development Manager GEA Process Engineering
2 Presentation Outline Description of Continuous Tableting Process Line Process Development Strategies for Continuous Processes Description of Preliminary Work Case Study for Predicting Tablet Hardness Independent of Granulation Process Conditions Summary of Benefits of Continuous Processes in R&D and Manufacturing
3 Pharmaceutical Industry is Moving Forward Opportunities: Extremely fast proof-of-concept Repeatable (not time dependent) Robust Design of Experiments (DoE) Continuous Process Quality Real-Time Release Increased Throughput/Reduced Footprint/Lower CoGs


4 Exipient Exipient API Gran. liquid Ext.Phase 1 Ext.Phase 2 Coating liquid Lubricant Preblend Granule Tablet Powder feed Blending Granulation Drying Milling Ext. Phase Lubricant Compression Coating
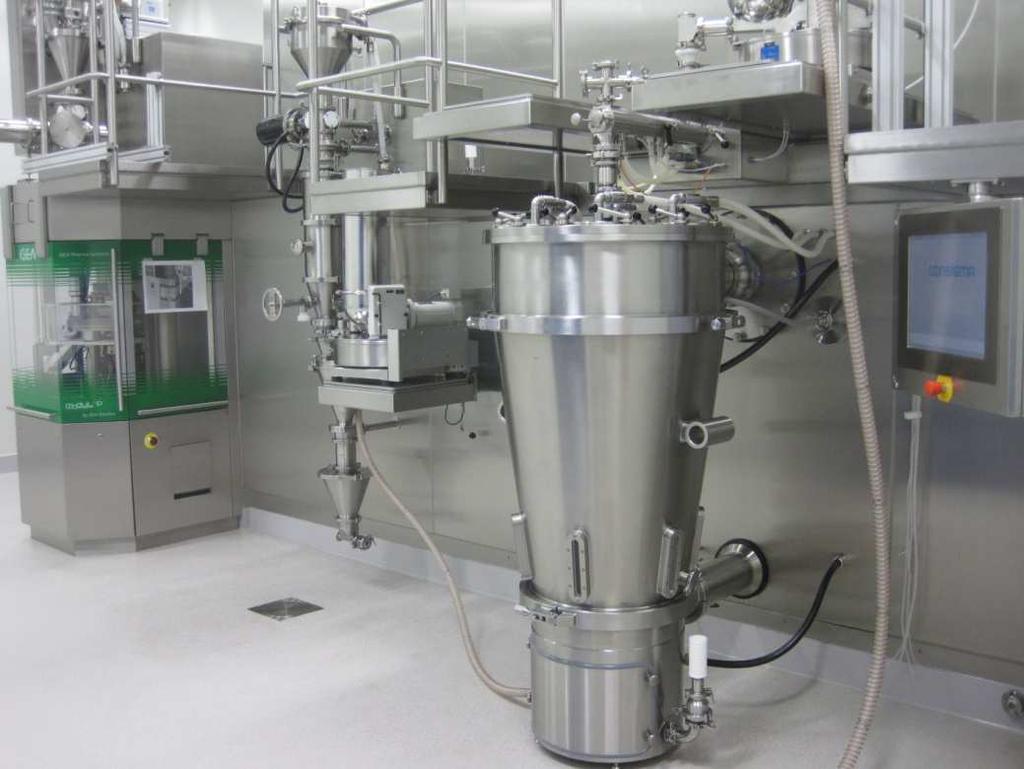

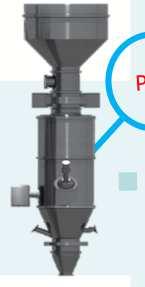
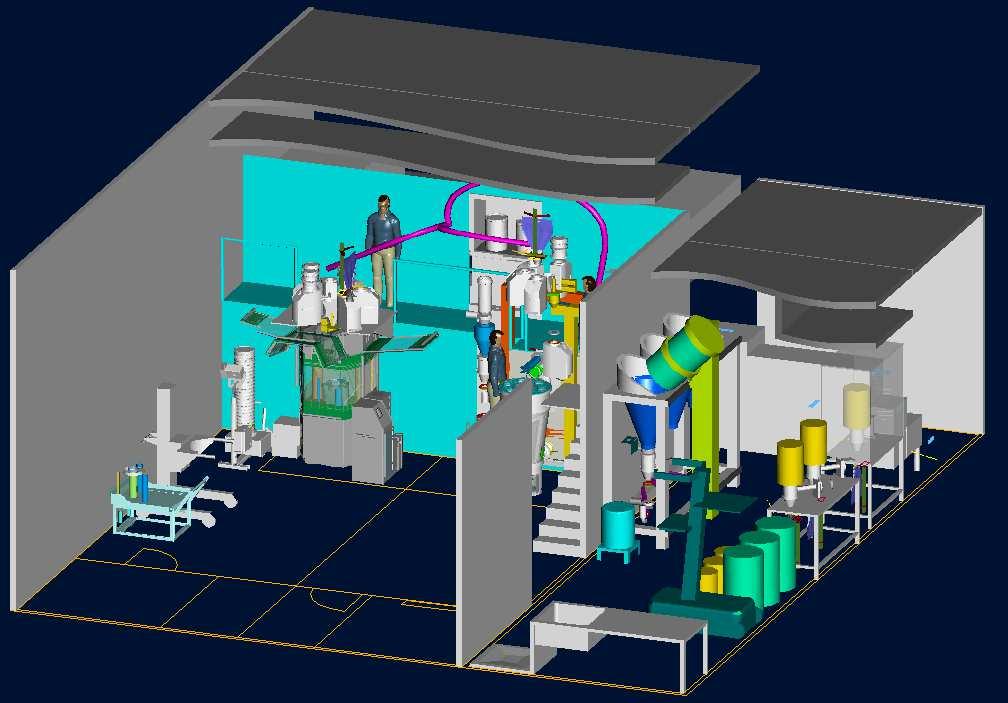
5 Continuous Tableting line

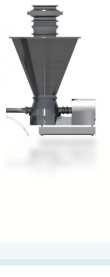
6 R&D Process Development Stategies R&D Continuous Granulator with Dryer Segment
7 DoE -> CQA s: There s a Lot of Data to Mine Use statistical software for experimental design/analysis Run # Screw Speed (RPM) Powder Feed Rate (kg/hr) Liquid Content (%) Liquid Feed Rate (g/m) Dryer Air Flow (m 3 /hr) Dryer Inlet Temperat Wet LOD ure (ºC) (%) Dry LOD (%) Wet Balance (<300 µm) Wet Sieve Wet Sieve #50(300 #40(425 µm) µm) Wet Sieve #16 (1180 µm) Wet Sieve #10 (2000 µm) Wet Sieve #7 (2800 µm) Dry Balance (<300 µm) Dry Sieve #50 (300 µm) Dry Sieve #40 (425 µm) Dry Sieve #16 (1180 µm) Dry Sieve #10 (2000 µm) Dry Sieve #7 (2800 µm) Torque (Nm) Barrel Temperat ure (ºC) n/a % 8.0% 19.4% 21.4% 7.2% 2.5% % 2.2% 12.8% 20.9% 22.5% 40.9% 0.0% 0.0% 0.7% 2.0% 10.1% 87.3% % 7.0% 22.4% 31.1% 21.6% 17.4% 2.1% 1.7% 14.9% 52.9% 20.5% 7.8% % 2.1% 13.8% 24.2% 24.2% 34.9% 0.0% 0.0% 1.5% 21.2% 29.1% 48.2% % 8.8% 18.0% 25.7% 16.9% 26.2% 9.7% 2.6% 12.3% 34.8% 18.4% 22.2% % 6.1% 20.0% 27.9% 12.2% 10.1% 61.3% 4.9% 14.9% 14.4% 3.9% 0.5% % 8.3% 23.1% 24.6% 7.3% 5.2% 56.1% 5.7% 19.4% 15.7% 2.6% 0.5% % 7.5% 18.0% 32.0% 20.6% 9.9% 22.0% 4.0% 13.4% 37.8% 17.0% 5.7% % 7.9% 19.3% 43.1% 14.6% 4.5% 35.5% 6.1% 18.1% 33.3% 6.5% 0.5% % 6.6% 13.0% 35.7% 21.8% 15.7% 20.5% 5.5% 17.6% 40.1% 13.8% 2.5% % 1.2% 7.6% 26.4% 24.4% 39.4% 2.0% 1.7% 13.1% 33.5% 24.3% 25.5% % 6.1% 16.7% 40.5% 25.5% 9.7% 2.3% 2.2% 14.7% 50.3% 23.5% 7.0% % 9.0% 21.1% 31.0% 13.2% 6.5% 42.4% 5.2% 14.4% 32.9% 4.6% 0.5% % 10.1% 23.8% 22.4% 9.9% 3.8% 66.2% 4.1% 13.4% 12.5% 3.3% 0.5% % 33.5% 3.4% 20.3% 27.0% 12.7% 64.1% 4.6% 12.4% 13.1% 5.2% 0.5% % 1.7% 10.1% 16.9% 24.1% 46.7% 2.8% 1.9% 10.8% 29.0% 30.3% 25.0% % 10.0% 22.7% 25.4% 13.4% 3.2% 61.9% 4.3% 15.7% 14.8% 3.2% 0.0% % 7.9% 19.8% 15.6% 11.7% 13.5% 71.8% 4.6% 12.5% 8.5% 2.6% 0.0% Granulator Wet Gran s Dryer Dry Gran s Torque LOD Airflow LOD Time/Revs Fill Depth Barrel Temp. D10 Inlet Temp. D10 Lubricant % Dwell Water% => D50 => Time? => D50 => => Force => Screw Speed Powder Feed Rate D90 BFE End Temp? Moisture D90 Porosity What else? Content Shape Hardness Strength Cohesivity Blender Press Tablets Hardness Friability Weight Deviation Disintegration

8 Response Surface Curves Doesn t tell you what the tablet properties are going to be In Continuous Manufacturing ProcessDevelopment, need improved metrics to differentiate product


9 Freeman FT4 Powder Rheometer Studied different metrics to determine if tablet properties could be predicted upstream in the process
.")
10 Experiment Material and Process Information FORMULATION Two types of formulation were considered in this study: 1) APAP 90% API (Klucel binder + Avicel) 2) DCP 90% API (Klucel binder + Avicel) PROCESS VARIABLES Water content was varied to provide granules with different properties, from undergranulated to over-granulated (as determined visually). Different ranges were required for the two different formulations (APAP 8 17%, DCP 15 25%) Screw speed was varied to investigate it s influence on granule properties. The settings chosen were 450, 600 and 750rpm. Feed rate of dry powder feeder was also varied for a limited number of samples. Settings were reduced from 25kg/hr (standard, and equivalent to ConsiGma 25), to 20 and 15kg/hr.
11 Notes Each data point is average of 2 runs, using fresh sample for each run. Error bars show RSD. Feed rate constant at 25kg/hr Summary: Increasing water content results in higher BFE for all screw speeds. Lower screw speed results in higher BFE. Both trends were expected, as higher water content, and lower screw speeds which induce more shear, produce larger, denser, more adhesive granules. Both effects lead to higher resistance to blade movement (higher BFE). Increase in BFE is linear wrt water content, but not screw speed.
12 Summary Both sets of data normalised against BFE for dry blend. Both samples show higher BFE performance with granulator at 450rpm and higher water contents Additional tests on the other samples of dried granules would help to fully define the Design Space and help with the formulation of the Control Space
13 Notes Feed rate of dry blend into granulator can be adjusted and has impact on wet granule properties. Summary: BFE substantially increases with reduction in feed rate. Only granules made at a screw speed of 600rpm and containing 15% water were investigated as a function of feed rate variation. Additional data shown (as previously seen on slide 9) shows same granule properties can be achieved at lower water contents, by reducing the feed rate. For this configuration, granules with 15% water content, with a feed rate of approximately 18kg/hr should have similar properties to granules containing 25% water made at a feed rate of 25kg/hr.
14 Follow-On Work: Through to Tableting PURPOSE To evaluate the tablet properties related to powder/wet mass properties through each stage of the manufacturing process train from a formulation manufactured using the ConsiGma 1 continuous granulation system. Previous work had identified that specific granule qualities (as measured by the BFE of manufactured wet mass) can be achieved using multiple variations of the granulation control parameters. This study will investigate if the granule quality, generated from multiple manufacturing conditions, can be directly linked to tablet quality parameters.
15 FORMULATION The material used for these tests was a commercial grade of APAP PROCESS VARIABLES ConsiGma 1 Conditions Tablet Press Configuration Condition Screw Speed (rpm) Powder Feed (kg/hr) Liquid Feed (g/min) Moisture (%) Tooling Pre-Compression Upper Pre-Compression Lower Compression Upper Compression Lower Feeder Paddle Speeds (609tpm) 7mm Round 2.15mm 4.82mm 2.29mm 4.29mm 20/30rpm Feeder Paddle Speeds (1215tpm) 40/60rpm
16 Looking primarily at the variation in tablet hardness with respect to granule properties Variation in tablet weight is +/- 10mg (+/- 3.8 to 4.8% of tablet mass) for all of the variations of fill and speed used for tablet manufacture. Thus the variance in the average is less than the sensitivity of the measurement and thus limits the usefulness of this measure for correlation purposes
17
18 Notes Tablet hardness data from multiple press configurations Fairly good correlation for BFE vs. Hardness for the wet mass condition Improved by considering single tablet press configuration (next two slides)
19 Notes Much improved correlation in all cases where any variation introduced by altering the tablet press parameters is removed. Further improvement may be possible using improved protocol specifically aimed at consistent times between sampling and testing to reduce moisture losses Summary: Clear relationship between the two pairs of similar BFE quality granules showing independence from manufacturing route Distinct relationship between BFE and tablet hardness
20 Notes Again, much improved correlation Configuration C1F2 will be used for evaluating granules at the other stages of manufacture Summary: As correlation improves for both press conditions when analysed separately, suggests BFE of wet mass is very sensitive tool for identifying appropriate press parameters.
21
22 Notes Correlation significantly improved over wet mass (R vs 0.79) Suggests that there may be an influence from the residual interstitial moisture when testing wet mass.
23 Notes Correlation further improved when using evaluating a single press configuration (0.99 vs 0.95)

24
25 Notes Given that there is a linear correlation with BFE for the wet mass and dried granules then a similar correlation with the milled may also be expected and this is indeed the case.
26 Notes At this stage, the improvement in correlating a specific press condition compared to the correlation with all the press conditions gives a very marginal improvement.
27
28 Notes Unlike in previous stages, the addition of mag stearate as a lubricant eliminates any correlation with tablet hardness (when flow measured using Rep+VFR method). This is due to the overwhelming affect of the lubricant on the flow properties when measured using the BFE test, a parameter very sensitive to frictional interactions. However, it should be noted that the BFE in this graph is derived from Test 7 of the Rep+VFR test (normally used for dry powder characterisation). The effect of the Mag St during this test is to coat the vessel and blade, resulting in a large reduction in flow energy with each test, and therefore bigger differences are observed when comparing Test 1 from this method (next slide)
29 Notes If the Flow Energy of the first measurement point is used (rather than the standard BFE at Test 7), then relationship with Dynamic Flow property is re-established, but it is a low grade correlation (R 2 is 0.74).
30 Notes There is an improvement in the correlation when using a single press configuration, but given the size of the error bars such an improvement is unlikely to be significant.
31 Notes When the particles are separated in the Aeration test, however, the effect of the lubricant is removed and the correlation between tablet hardness and flow energy (in this case the aerated flow energy) is again observed Summary: The MgSt has a significant effect on the flow properties of the granules and, when the MgSt coated particles are in intimate contact you are effectively measuring the MgSt/MgSt interaction. With increased separation (Aeration Test) or as an instantaneous measure then the correlation with tablet hardness and Dynamic flow property is reestablished
32
33 Summary: There is a linear relationship between the tablet hardness and the granules flow energy at all stages of the manufacture. The lubrication, as has been noted earlier, interferes with the measurement process such that all the results effectively evaluate the MgSt rather than the granules.
34 Summary: The use of data taken from tablets created using a single press configuration improves the hardness/bfe correlation for the wet mass, dried and milled granules. The lubricated correlation is still poor for the reasons set out in the previous slide.
35 Summary: When the Initial Flow Energy is used for the lubricated blend, the relationship with the tablet hardness is reestablished.
36 Summary This slide again emphasises the excellent correlation with BFE. Interestingly there is a decreasing profile for the granules manufactured with the lower BFE, whereas the granules manufactured with the high BFE show a rise in BFE after drying. This may be due to the relative size of the granules at the high BFE manufacturing point. Once these granules are milled, there is a significant reduction in BFE which is more in line with the relative results from the low BFE manufacturing points. Also, the granules with lower BFE may be more fragile and attrition during drying may be occurring.
37 Summary This slide again emphasises the excellent correlation with BFE. When the FE values from Test 1 of the Rep+VFR test are used for the lubricated granules, the distinction between the two manufacturing point is reestablished.
38 It has been shown that it is possible to generate granules with the same quality (as measured by BFE) using different operational configurations of the ConsiGma 1 It is further shown that there is a definite relationship between the BFE of the granules and the resultant tablet hardness The hardness/bfe linear relationship is observed at every stage of the processing except lubrication Correlation improves following drying and milling as the influence of interstitial water is removed Following lubrication, a linear relationship between tablet hardness and Aerated Energy was also observed Further evaluation of the Dynamic data of the lubricated granules shows there is a linear relationship of the initial flow energy measurement (FE1) and the tablet hardness This suggests that tablet hardness is a function of granule property and is independent of manufacturing route

39 R&D Lab scale and Pilot scale cost savings
40 Comparison Batch -Continuous Processing: API Consumption Stage Batch manufacturing Continuous Manufacturing API used API used Formulation Development 90 kg 35 kg Pilot Scale 120 kg Together with Formulation development Commercial 1650 kg 350 kg Total Amount of API used 1860 kg 385 kg Difference in API consumption: approx kg (huge potential savings!)


41 Flexibility in Installation: Modular Approach
42 GEA Freeman Technology Joshua Hullen Jessica Trankle Shawn Dorsey John Yin Tim Freeman