Nondestructive Evaluation of Natural Fiber Reinforced Composites: Material Properties and their Deterioration
|
|
|
- Maryann McBride
- 5 years ago
- Views:
Transcription
1 Nondestructive Evaluation of Natural Fiber Reinforced Composites: Material Properties and their Deterioration Elena Maeva, Inna Seviaryna, Dmitry Gavrilov, Jeff Sadler, Ganesh Venukadasula Industrial Research Chair in Applied Solid State Physics and Material Characterization Physics Department 8/4/2011 University of Windsor 1
2 Biocomposites in Automotive Industry Biofibre reinforced composites gain widespread acceptance in the North America automotive industry. Jute, hemp, flax and other biofibres Advantages of biocomposites: Renewable resources for row materilas Biodegradable or recyclable Shift from petroleum based to bio based materials Reduced weight compared to synthetic composites 8/4/2011 2
3 Defects in Biocomposites Porosities Microcracks Inhomogenities Structural delaminations 8/4/2011 3


4 Biocomposite Degradation Solar irradiation Temperature Humidity Biodegradation Stress Fatigue The deterioration of a material depends on its resistance to all parameters. 8/4/2011 4


5 Depth Sensing Indentation (DSI) DSI measures penetration of an indenter into a material as a function of applied load. Hardness Modulus Creep Plastic Depth/ Contact Depth Elastic recovery parameter


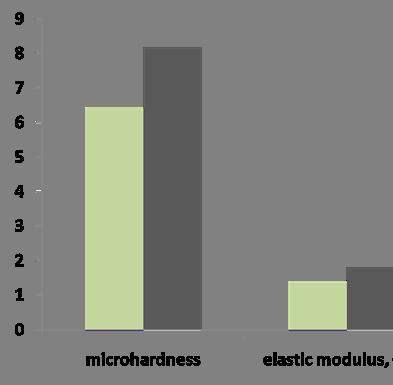
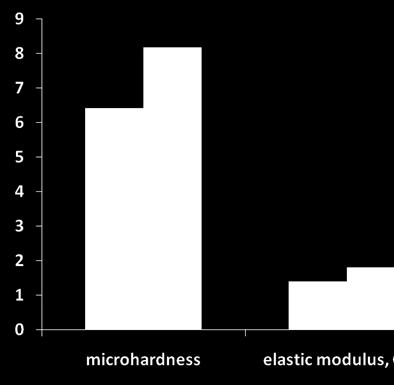
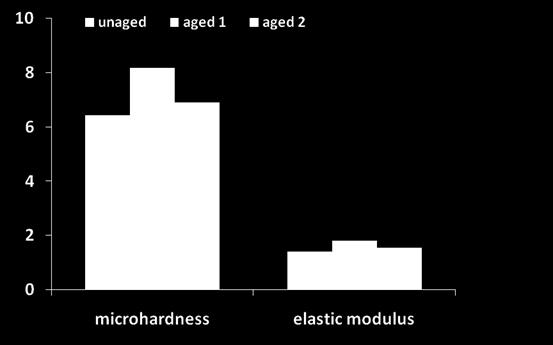
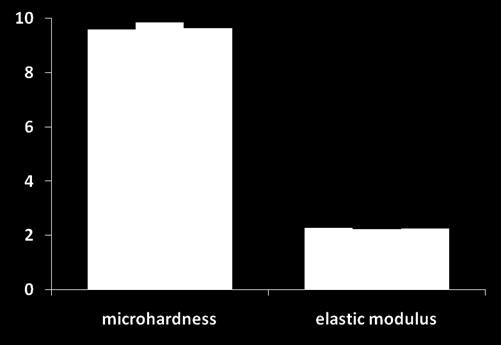
6 Biocomposites Degradation Material s Properties Tensile Test Dynamic Microhardness


7 Matrix or Fibres? PP matrix fibr e Side 1 (UV, temperature, moisture) Side 2 (temperature, moisture) PP matrix Fibre

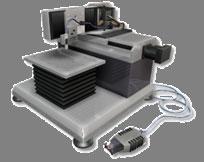
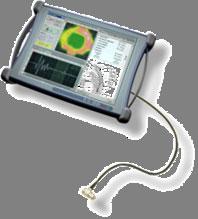
8 Thermography The main idea of thermographic methods is extracting data from the dynamics of heating and cooling down processes for the sample excited with external heat impact. FLIR SC4000 thermal imager (up to tens khz frame grabbing speed thermal sensitivity ~tenths of C).
9 Thermography Flash method thermal diffusivity (cm 2 /s) is a function of its thermal conductivity (k), specific heat capacity (C p ) and density ρ. Heat pulse L is sample thickness t 1/2 is time required for the sample back surface to reach half of the maximum temperature rise.


10 Thermal Diffusivity

11 Problems in Acoustic NDE of Biocomposites fiber Nonhomogeneous characteristics of biocomposites pose significant challenges for defect detection: Uneven surface of fibres cause ultrasound scattering High concentration of fibres leads to high acoustic attenuation coefficient matri x Close acoustic properties of fibres and matrix result in low reflection coefficient and low image contrast 8/4/
12 Acoustic Method transducer electronics sample v h t Sound velocity v 2 h t velocity of ultrasonic sound Thickness of sample Time of flight Basic acoustic scaling factor to determines thickness of material, location of flaws, location of interfaces Relates to material's stiffness amplitude time t A 1 A 2 Attenuation 1 A ln 2h A A h α 1 2 Amplitude of the signal Thickness of the sample Attenuation Energy Loss (heat, scattering) Relates to acoustic parameters and size of small scatterers like fibres in biomaterials Relates to damping properties of the material 12


13 Acoustic Images mechanical scanner PC acoustical lens pulser-receiver sample B-scan plane C-scan plane


.")


14 Internal Structure of Bio Composites Short Fiber Reinforced Composites. Wheat straw filler in PP/ 5% clay/2% MAPP 0 % 10 MHz frequency. 30% 40% Non uniform internal structure. Darker areas indicate regions with fiber clusters or trapped air (microvoids). Increase of filler content in material composition corresponds to an increase of darker areas on the acoustic images. 50% Vertical cross section 5 mm Horizontal cross section 14


15 Biocomposite Microstructure Surface Clay inclusions Pores 1.5 mm below surface Fibers 2 mm Intact composite Mechanical impact damage Weathered composite 15 MHz acoustic frequency Cracks formed along the matrix/fibre interface Pores 8/4/

16 Monitoring of Biocomposite Degradation surface 3D reconstruction of the microcracks distribution in the volume of the biocomposite exposed to accelerated weathering. Biocomposite was weathered in an environmental chamber for 0 hrs. 100hrs. 300 hrs. 10x10 mm scanning area. 10 MHz frequency. 8/4/


17 Changes in Biocomposites during water absorption Acoustic images of the surface 200 μm 0 hr Time of exposure 24 hr 120hr 312hr Brightness of the image pixel depends on the how the properties of the material (density and elastic modulus) differ from water properties (the more difference the brighter image) Plain surface of the biocompsite at the beginning Fibers starts to expand out of matrix with increase in immersion time 17


18 Water Absorption Biocomposites with different fiber content Increase in weight, % 50% 40% 30% 20% 0% Time, days 8/4/


19 Water Absorption Decrease in sound velocity, % Increase in weight, % 8/4/
20 Theoretical Modeling. Randomly Oriented Short Fibres Poly Propylene & Wheat Straw Poly Propylene (Clay 5%): Density: 960 kg/m 3 Velocity: 2610 m/s Wheat Straw Density: kg/m 3 Velocity: ~ 2050 m/s (Visual Fit)
21 Results: Acoustical Signal Fully Disbonded (Total Reflection) Partially Bonded (~50% Transmission) Fully Bonded (Total Transmission)
22 Conclusions Algorithms for NDE for biocomposite materials were developed Ultrasonic technique is able to detect all major defects in biocomposites Water absorption rate correlate with changes in sound velocity of the composite 8/4/


23 Questions? 8/4/