Afrikas ekonomi, mineralråvaror och Kina
|
|
|
- Helena Agnes Austin
- 5 years ago
- Views:
Transcription

1
2 Afrikas ekonomi, mineralråvaror och Kina Program Afrika - bakgrund Gruvindustrin i världen Gruvindustrin i Afrika Kina i Afrika Magnus Ericsson / 孟瑞松 Råvarugruppen, Luleå Tekniska Universitet
3

4 Manganese drawing: Kaianders Sempler. Afrika - bakgrund

5 Africa a giant 20 % av jordytan
6 Africa key figures Area: km² 20 % Population: 1,216 miljarder World 7, % GDP: 2141 billion USD global % GNI per capita: Sub-saharan Africa 1515 USD World Sweden 54480

7 Africa growing faster 1 Excludes countries with less than 10 million people Fastest growing countries Country Ethiopia China Myanmar Uzbekistan Rwanda Afghanistan India Ghana Tanzania Mozambique Angola Cambodia Zambia Iraq Congo, Dem. Rep Sub-Saharan Africa 4.26 World 2.49
8 Africa growing faster World Sub-Saharan Africa (excluding high income)

9 Vanadium drawing: Kaianders Sempler. Global gruvindustri

10 Mining in the world Source: Raw Materials Data
11 % of world mining Mining - a historical perspective Europe USA China USSR/CIS Australia/Canada 6RR Other Source: Sames, Raw Materials Data
12 Source: Raw Materials Data Minerals produced Commodity Mined Unit Price Unit Value 2014 (USD billon) Aggregates Mt Coal 8085 Mt 80 USD/t 647 Iron ore 3415 Mt 71 USD/t 146 Gold 3.1 kt 1266 USD/oz 123 Copper 18.5 Mt 6869 USD/t 98 Nickel 2.2 Mt USD/t 25 Potash 39.9 Mt 580 USD/t 23 Phosphate rock 242 Mt 79 USD/t 19 Zinc 13.7 Mt 2162 USD/t 19 Diamonds 127 Mcts Top 10 total
13 Mineral demand Improved living conditions Population growth Urbanisation
14 Metal intensity Metal intensity Indonesia use 51 kg steel per person Industrialised economies uses more metals per person USA use 335 kg steel per person GDP Source: World Steel Association
15 Production value 2000 Billion USD Other Africa India Russia USA Australia China 200 0

16 Mining s contribution Mongolia 9. Mali 10. Guyana 8. Burkina Faso 5. PNG 7. Peru 2. Chile More contribution to wealth 1. DRC 6. Zambia 3. Australia Less contribution to wealth Source: RMG Consulting

17 Nickel drawing: Kaianders Sempler. Afrikas gruvindustri

18 Mining in Africa 1
19 Billion USD Mining in Africa 2 % , ,00 5,00 4,00 3,00 2,00 1,00 Africa value of mineral production Africa GDP % ,00
20 Mining s contribution 2014 LOW INCOME ECONOMY Guinea Zimbabwe LOWER MIDDLE INCOME ECONOMY Papua new guinea Bolivia Indonesia Guyana Zambia Ghana Mauritania UPPER MIDDLE INCOME ECONOMY South Africa Brazil Kazakhstan Peru Suriname Botswana Namibia Mongolia Fiji HIGH INCOME ECONOMY Chile 13 countries climbed one step Russia Source: World Bank
21 Human development index Percentage change in Human Development Index in low- and lower middle Sub-Saharan African economies % Oil Mining boom years 46% Non-mining % Mining 0,0 2,0 4,0 6,0 8,0 10,0 12,0 14,0 16,0 18,0 20,0 Mining: Burkina Faso, DRC, Cote d'ivoire, Eritrea, Ghana, Guinea, Liberia, Madagascar, Mali, Mauritania, Mozambique, Namibia, Niger, Rwanda, Senegal, Sierra Leone, Tanzania, Togo, Zambia, Zimbabwe. Non-mining: Central African Rep., Ethiopia, Lesotho, Benin, Burundi, Cabo Verde, Djibouti, Gambia, Guinea-Bissau, Kenya, Malawi, Somalia, Swaziland, Uganda, Oil: Sudan, Cameroon, Congo, Rep. Equatorial Guinea, Nigeria, South Sudan, Chad. Source: RMG Consulting, World Bank
22 Governance Percentage change in Governance indicators in low- and lower middle SSA economies Control of Corruption Government Effectiveness Political Stability Regulatory Quality Rule of Law Voice and Accountability Oil Non-mining Mining Oil Non-mining Mining Oil Non-mining Mining Oil Non-mining Mining Oil Non-mining Mining Oil Non-mining Mining Oil countries Non-mining countries Mining countries Source: RMG Consulting, World Bank
23 Gini coefficent Country GINI Year GINI Year +/- Chile Papua New Guinea Guinea South Africa Peru Kazakhstan Zambia Ghana Guyana Suriname Zimbabwe Botswana Brazil Indonesia Russian Federation Mauritania Bolivia Namibia Fiji Mongolia Congo, Dem. Rep = Inequaliteis has Increased - = Inequaliteis has Decreased Source: World Bank, UNU-WIDER

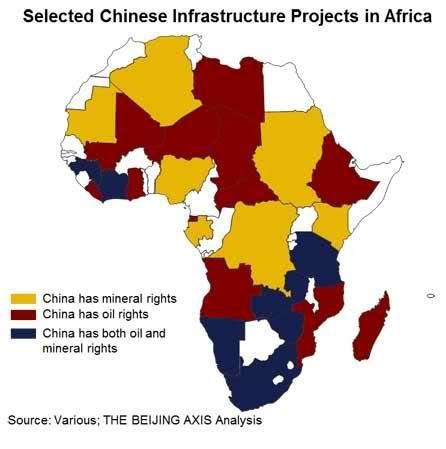
24 REM drawing: Kaianders Sempler. Kina i Afrika
25 China remains central % of total consumption Alumini um Copper Nickel Zinc Source: DAIECON, IMF, WBMS.,
26 Major chinese companies 2014 Rank Company Value billion USD BHP Billiton Group Shenhua Group Co Ltd China National Coal Group Datong Coal Mine Group Shanxi Coking Coal Group Yanzhou Coal Mining Co Ltd Huabei/ Huainan Mining Group HBIS (Hebei Iron & Steel Group) Heilongjiang LongMay Mining Pingdingshan Tianan Coal Mining Shuicheng Mining Group China Minmetals Corp Jincheng Anthracite Mining Zijin Mining Group Co Ltd Chinalco Jinchuan Group Co., Ltd China Molybdenum Co Ltd 0.7 Source: Raw Materials Data
27 Chinese overseas mining investments Billion USD Chinese mining investments into Africa (calc) Other overseas mining investments 0 Source: NBS, RMG Consulting


28 Major chinese companies (overseas) China Minmetals (MMG) in expansion. Las Bambas opened 2016 Zijin in expansion phase. Acquried 47% in Porgera PNG, 51% in Kolwezi DRC (in production July 2017), 40% Kamoa DRC. Rio blanco development Jinchuan in expansion phase. Bakubung platinum mine in operation Kinsenda DRC development Chinalco, world leading aluminium producer. 10% owner of Rio Tinto. Expansion in base metals. Toromocho mine in Peru, developing Simandou iron ore mine. HBIS Group Co. Ltd. (formerly Hebei Iron & Steel Group), is China's second largest iron and steel producer and third largest in the world. Developing Palabora copper mine Bayin owner of Gold One, largest shareholder (20%) in Sibanye. China molybdenum. Take over of Tenke Fungurume in DRC and Nióbio, Fosfatos Brazil. Source: Various
29 Major chinese overseas mining m&a Source: Various Acquirer Target Country Comm Seller Price Status Tianqi Lithium Greenbushes (51%) Australia Lithium Talison $0.5 bn Completed May 2014 Minmetals-led consortium Las Bambas Peru Copper Glencore $7.0 bn Completed Aug 2014 Shangdong Iron & Steel Tonkolili Sierra Leone Iron ore African Minerals $170 m Completed Apr 2015 Guangdong Rising 2 mines and projects Laos, PNG Gold PanAus $0.9 bn Completed Jun 2015 Zijin Mining Barrick Porgera (50%) PNG Gold Barrick Gold $0.3 bn Completed Aug 2015 Zijin Mining Kamoa project DR Congo Copper Ivanhoe $0.4 bn Completed Dec 2015 Chinalco Simandou Guinea Iron ore Rio Tinto $1.3 bn Agreed Oct 2016 China Molybdenum Nióbio, Fosfatos Brasil, Brazil Nb, K2O Anglo American $1.5 bn Completed Oct 2016 China Molybdenum Tenke-Fungurume (80%) DR Congo Copper, cobalt Freeport $3.8 bn Completed Jan 2017 Yancoal Coal & Allied Australia Coal Rio Tinto $2.45 bn Agreed Jan 2017 Shandong Gold Veladero (50%) Argentina Gold Barrick $0.96 bn Agreed Apr 2017 Fosun, Hainan Mining Polyus gold (10%) Russia Gold Polyus $0.89 bn Agreed May 2017 Chinese investors Bystrinsky project (13%) Russia Copper Norilsk Nickel $100 m Dec 2015
30 Selected major chinese mine developments Toromocho Chinalco Operating/Expansion $ bn Las Bambas Minmetals Operating 2016 $7bn Zijin Mining Kolwezi Jun 2017 Husab China National Nuclear Completed 2017 $0.7 bn $2 bn $1.64 bn $9 bn Bakubung Jinchuan Complete 2018 Palabora HBIS Group New mine level Source: Various
31 Chinese control operating mines 2011 Source: Raw Materials Data
32 Chinese control operating mines 2014 Source: Raw Materials Data

33 Control by Chinese companies in Africa ,3,4,5,6,7 8 1 Awaso Bauxite Mine Bosai Minerals 2 Ruashi Copper Mine Jinchuan Group 3 Chambishi Copper Mine CNMC 4 Chibuluma South Copper Mine Jinchuan Group 5 Baluba Copper/Cobalt Mine China nonferrous Metals 6 Muliashi Copper Mine China nonferrous Metals 7 Kolwezi Copper Mine China Railway,SINOHYDRO 8 former Zimasco Chrome Mines Sinosteel 9 Dilokong Chrome Mine Sinosteel 10 Vergenoeg Fluorspar Mine Jinchuan Group 9,10 Source: Raw Materials Data Gold Copper Iron Platinum Aluminium Nickel Other

34 Control by Chinese companies in Africa ,7,8,9,10,11,18,20 Gold Copper Iron Platinum Aluminium Nickel Other 12 14,15,16,17,21 Mine Company Control 1 Tonkolili Iron Ore Mine Shandong Iron and Steel 100% 2 Bong Iron Ore Mine Wugang, China Union 100% 3 Awaso Bauxite Mine Bosai Minerals 80% 4 Zara Gold Mine China SFECO Group 60% 5 Bembele Manganese Mine CITIC HK 51% 6 Kinsevere Copper/Cobalt Mine China Minmetals 95% 7 Ruashi Copper Mine Jinchuan Group 75% 8 Chambishi Copper Mine China Nonferrous Metals 85% 9 Chibuluma South Copper Mine Jinchuan Group 85% 10 Baluba Copper/Cobalt Mine China Nonferrous Metals 85% 11 Muliashi Copper Mine China Nonferrous Metals 85% 12 former Zimasco Chrome Mines Sinosteel 86% 13 Husab Uranimum Mine China National Nuclear 90% 14 Dilokong Chrome Mine Sinosteel 60% 15 Vergenoeg Fluorspar Mine Jinchuan Group 70% 16 Palabora UG Copper Mine Hebei Steel 75% 17 Petrex Gold Mines Baiyin NMG, CADFund 90% 18 Tenke Fungurume Copper Mine China Molybdenum Co 80% 19 Langer Heinrich Uranimum Mine China National Nuclear 20% 20 Kolwezi Copper Mine China Railway,SINOHYDRO 48% 21 Modder East Gold Mine Baiyin NMG, CADFund 90% Source: Raw Materials Data

35 Chinese control, projects 2014 Source: Raw Materials Data
36 Chinese control in Africa in perspective Copper production in Africa 2014, total 2069 kt Gold production in Africa 2014, total 610 ton 2% Copper 24% Australian companies Canadian companies 4% Gold 17% 1% Australian companies Canadian companies 61% 13% Chinese companies 78% Chinese companies Other Other Source: Raw Materials Data
37 Chinese copper control China to control ~ 30-35% of copper production in Africa % 12% China 2014 Tenke Fungurume 68% 5% 2% Kolwezi Kamoa Other Source: Raw Materials Data
38 Chinese control in Africa in perspective Control of African mining 2014, total value 100 billion USD 2,4% 6,1% 12,6% Chinese companies Glencore Exxaro Anglo American Anglogold Ashanti OCP 4,1% Sibanye Gold First Quantum 48,9% 100 billion USD 3,7% 2,5% 2,1% 2,0% Impala Platinum Randgold Harmony Newmont African Rainbow Barrick Gold Fields Vedanta ENRC SeverStal Kinross Freeport-McMoRan Other Artisinal gold Source: Raw Materials Data
39 Chinese control in Africa in perspective 2% 7% 2% Australian companies 13% 4% Canadian companies Chinese companies Anglo American 72% Glencore Other Source: Raw Materials Data
40 Chinese control overseas Chinese industrial mining companies (non ASM) control mineral output outside China to a value of 11 billion USD Copper is the dominant metal and Oceania main region By commodity Other Lead 3% Gold 3% 10% By region Africa 22% Iron ore 13% Zinc 13% 11 billion USD Coal 20% Copper 38% Oceania 51% 11 billion USD North America 0% Asia 16% Latin Europe America 1% 10% Source: Raw Materials Data
41 Myths and facts China is still a minor player in global mining outside of China. China has NOT taken control over Africa s mineral resources. China is increasing its presence in Africa, BUT from a very low level. China is in control of 2.4% of Africa s mining output 2014, Anglo American is in control of 12.6%. Copper is the single most important commodity for Chinese investments. Chinese investors range from small-scale operators to large state-owned companies. They behave differently. It is NOT possible to treat them as one. Chinese investments into Africa create competition and give African governments an alternative to traditional investors and potentially the possibility to chose.
42 Tack för uppmärksamheten Magnus Ericsson / 孟瑞松 RMG Consulting 070/
43 Y-o-Y PRODUCTION VALUE I ,00 Others Silver 60,00 Diamond value Zinc 40,00 Phosphate rock 20,00 Potash Nickel 0,00 Copper -20,00 Gold Iron ore -40,00 Coal Y-o-Y Source: Raw Materials Data
44 % of world mining MINING IN A HISTORICAL PERSPECTIVE 70 Europe USA China USSR/CIS Australia/Canada 10 0 Chile, Peru, Brazil, DRC, South Africa, Zambia Other Source: Sames, Raw Materials Data
45 TOTAL CHINESE MINING DEAL VALUES USD Mining 77 billion USD Source: Bloomberg

46 CHINESE CONTROL, PROJECTS 2011 Source: Raw Materials Data
47
48 Selected major Chinese mine developments Company Mine Country Metal Status Capex (bn) Complete Jinchuan Bakubung South Africa Platinum Construction USD China National Nuclear Husab Namibia Uranium Operating USD HBIS Group Palabora South Africa Copper New level USD 9.3 Until 2030 Zijin Mining Kolwezi DR Congo Copper Preproduction USD 0.7 June 2017 Chinalco Toromocho Peru Copper Operating USD Zijin Mining Rio Blanco Peru Copper Feasibility USD Source: Various