Computational Modeling of Complex Systems using Integrated Computational Materials Engineering (ICME)
|
|
|
- Samantha Fitzgerald
- 5 years ago
- Views:
Transcription
 September 27, 2017 Ibrahim Awad, Nick French Robert Tryon, Animesh Dey Sanjeev Kulkarni")
1 Computational Modeling of Complex Systems using Integrated Computational Materials Engineering (ICME) September 27, 2017 Ibrahim Awad, Nick French Robert Tryon, Animesh Dey Sanjeev Kulkarni 1
2 Outline Traditional fatigue analysis Safe life Damage tolerance ICME Total life analysis Probabilistic Microstructural 2
3 Traditional Safe Life Fatigue Analysis Empirical Methods Fatigue Life N = f σ, ε 3
4 Fatigue Modifying Factors Fatigue Strength is not a material property S e a b c d e f g h i j k e e k k k k k k k k k k k S Se fatigue strength of component S fatigue strength of test coupon k k k k k k a b c d e f = surface factor = size factor = mean stress factor = reliability factor = temperature factor = notch factor k k g k k k h i j k = residual stress factor = texture factor = corrosion factor = plating factor = multi-axial stress factor J. E. Shigley, Mechanical Engineering Design, McGraw-Hill, 1977, pp
5 Complex Behavior: Notch effect JIS Steel Data S-N curve for notched specimen (Kt = 3) plotted with local notch root stress Fatigue notch factors (Neuber and Glinka) are available but they require experimentally determine notch sensitive factors. Nishijima et al. 5
6 Size Effect IN100 laboratory test data Smooth round bars cut from the same block with the same microstructure Standard Normal X bar 1X bar 1/2Xbar Cycles to failure 6
7 Fatigue Analysis Why are there so many modifying factors? Fatigue response is much more complex than A lot is going on from the first cycle to the last N = f σ Fatigue is a process, not an event 7

8 Random field of intense slip bands of plastic deformation Prof. Christ and co-workers, 13th International Conference on Fracture, 2013, Beijing, China 8

9 Random field of micro-cracks Fatigue is dominated by the growth and coalesce of very small cracks. Fatigue is always governed by very localized damage DARPA SIPS program 9

10 Random field of crack growth 10
11 Computational Material Model Model the material at a fundamental level Explicitly model the materials damage tolerance Must account for random nature or the important size scale Loading and environment become extrinsic factors to the material model This allows simple test coupon data to be used directly in fatigue analysis of complex components 11
12 Traditional Damage Tolerance Computationally fracture mechanics modeled fatigue crack growth rate by calculating the stress intensity factor (SIF) and knowing empirically-derived material parameters SIF similitude is achieved for Different loads Different crack sizes Complex spatial stress gradient Varying residual stress gradients The downside are the simplifying assumptions Damage is a single, well-defined crack of relatively-large size Common initial crack size in linear elastic fracture mechanics is 1/32 inch (0.03 ). No credit given to cycles to initiation In high strength materials, initiation can be more than 90% of Total Life 12
 = Small Crack Growth Linear Elastic Fracture Mechanics (LEFM) Long Crack")
13 Damage Tolerance for Total Life Fatigue damage growth analysis using 3-D random field of microstructural material properties Dislocation Theory Crystal Plasticity Crack Nucleation + Small Flaw Fracture Mechanics (SFFM) = Small Crack Growth Linear Elastic Fracture Mechanics (LEFM) Long Crack Growth 13

14 Microstructurally Short Crack Top view of real crack Top view of idealized crack Side view of idealized crack 14


15 VLM: Grain FEA Component Fleet 27,943 Tooth Life: 15,932 cycles Failure Cause: Defects Component Life: 14,334 cycles 22,113 18,961 22,229 25,342 17,561 24,793 Integrate VLM Results with FEA VLM Integration for Entire Component Repeat Sequence for Each Tooth 1 st Virtual Twin Gear Simulated VT 1, VT 2, VT 3 VT 1,000 Run 1,000 Simulations 15

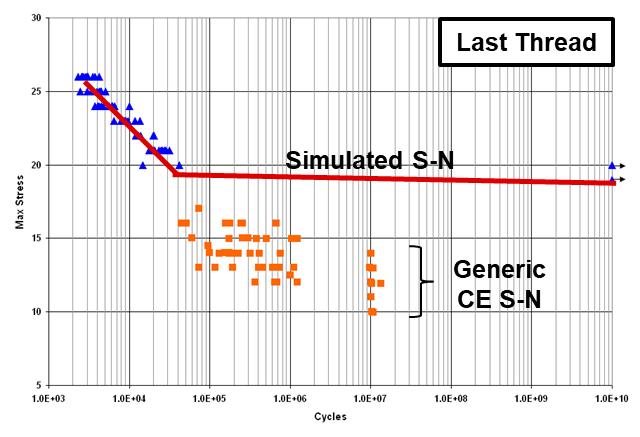
16 Output- SN Curve 16

17 Output- Detailed Results 17


18 Simulated Failure Surface Microstructure Grain Orientation for Bar 1 at 75 Ksi 18

19 Simulated Failure Surface Microstructure Frictional Strength and Crack Growth Rate 19
20 Load Ratio (R Ratio) Effects 20


21 Vibration Mode Dependent Fatigue 1st Torsion Mode (Mode 2) 1 st Bending Mode (Mode 1) 21


22 Spectrum Loading Fatigue Same material model used for various geometry/loads 22


23 Engine Block Example Microstructural variation within gray iron casting Images: Technische Universität Wien, e307, für Laborübung/Vorlesung 23

 is the basis for VPS-MICRO software Customers: Federal Government and")


24 Who is VEXTEC? Founded in 2000: Over $25 million from the United States Department of Defense Innovative Research programs for Technology Development Proprietary Software and Seven Patents: Virtual Life Management (VLM ) is the basis for VPS-MICRO software Customers: Federal Government and Industries (Aerospace, Automotive, Electronics, Energy, Medical Devices) Value Proposition: Help companies improve products and reduce cost New products to market quickly Improve reliability of existing products Reduce physical and prototype testing requirements Forecast product durability and manage product life cycle risk Business Model: Hybrid Consulting Services, Software Licensing and Training 24 VEXTEC accepted into FDA s Medical Device Development Tool (MDDT) pilot Program

25 VPS-MICRO Value Proposition Replace or supplement physical testing for increased confidence Forecast product durability and manage product life cycle risk Bring new products to market quickly Assure product reliability and reduce cost Our software and support services have generated superior results for our clients: 75% decrease in product development time 90% decrease in testing and design costs VPS-MICRO is the advanced ICME tool that addresses fatigue and allows manufacturers to more accurately identify and gauge potential liabilities. VPS-MICRO uses physics to predict the uncertainty and scatter in material fatigue performance to cost effectively manage risk. By running as many simulations as desired, the user can optimize resources to create data required for testing and design. Used by Leading Companies in Multiple Industries Aerospace & Defense 25 Automotive & Transportation Industrial Equipment Medical Implants


26 VEXTEC Demonstrated Successes Industry & Client Type Project Description Application Aerospace Airline -Simulated lubrication changes & identified fix Repair (American) -FAA Approved Engineering -$4M/year saved on bearings Automotive Engine Maker -Simulated 150 designs & identified top 3 New Product (Cummins) -$5M saved on engine block development Development program Industrial Specialty -Forecast maintenance schedule based on current Equipment Manufacturer usage Computational -$3M saved on reducing manufacturing line downtime Framework Healthcare Medical Devices -Evaluated material suppliers for different markets Second (Boston -Avoided expensive developmental test program Source Scientific) 26


27 Software: VPS-MICRO Simulated Fatigue Tests Windows desktop tool Wide range of applications Output Stand-alone tool for simple specimen geometry models Integrate FEA models for complex geometry of full-scale components Simulated S-N Curve Virtual fracture surface Detailed statistical analysis Customizable Software Product Interface with Standard FEA software Predict risk of failure from complex in-service loading spectrums Software Partners Simulated S-N Curve 27
28 THANK YOU Please Visit Our Booth Robert Tryon, Animesh Dey, Sanjeev Kulkarni, 28