Post Quench Ductility of Zirconium Alloy Cladding Materials
|
|
|
- Oscar Butler
- 5 years ago
- Views:
Transcription
1 Post Quench Ductility of Zirconium Alloy Cladding Materials A. Mueller D. Mitchell J. Romero* A. Garde J. Partezana A. Atwood G. Pan 1 18 th International Symposium on Zirconium in the Nuclear Industry Hilton Head, SC, May 15-20, 2016
2 Background Loss-of-Coolant Accident (LOCA) conditions Steam oxidation at high temperature Followed by quenching in water Minimum ductility must be retained Hydrogen has a significant influence Absorbed during normal operation In-reactor operation limits Peak cladding temperature (PCT) and total oxidation As a function of hydrogen content 2

3 Background Oxide α(o) Prior-β Inner Diameter Outer Diameter 100 µm 3
4 Objectives Investigate post-quench ductility (PQD) Zircaloy-4, ZIRLO and Optimized ZIRLO As a function of hydrogen content As-fabricated and hydrogen charged Investigate post-quench microstructure Evolution of α(o) and prior-β layers ZIRLO and Optimized ZIRLO are trademarks or registered trademarks of Westinghouse Electric Company LLC in the United States and may be registered in other countries throughout the world. All rights reserved. Unauthorized use is strictly prohibited. Other names may be trademarks of their respective owners. 4
5 Experimental Zircaloy-4, ZIRLO and Optimized ZIRLO tested side-by-side Hydrogen content from ~10 to 600 ppm Peak cladding temperature (PCT) is a function of H content 1200 C for H 400 ppm and 1125 C for H 400 ppm Alloy Nb Sn Fe Cr Zircaloy ZIRLO Optimized ZIRLO
 Holding to achieve desired oxidation 2.")
6 Experimental - Oxidation 1. Heating to PCT (1200 C or 1125 C) Holding to achieve desired oxidation 2. Slow cooling (~2 C/s) to 800 C 3. Water quenching 6


7 Experimental Ring Compression Testing Three rings from one oxidation sample, tested at 135 C Offset strain calculated from load-displacement curve Determination of ductile or brittle result Average measured offset strain versus threshold Brittle Ductile ZIRLO 12.7% ECR 200 ppm H Avg. Offset Strain 1.6% ZIRLO 19.1% ECR 10 ppm H Avg. Offset Strain 13.4% 7
8 Results Ductile-to-Brittle Transition C 1125 C Open = Ductile Closed = Brittle Proposed Limit 1200 C 1125 C Open = Ductile Closed = Brittle Proposed Limit 14 ECR (%) Brittle Brittle Zircaloy-4 Ductile ZIRLO Ductile Hydrogen (ppm) Hydrogen (ppm) Equivalent Cladding Reacted (ECR) is defined as the percentage of the cladding thickness that would be oxidized if all the oxygen absorbed stayed in the oxide layer as ZrO 2. Similar ductile-to brittle transition Transition occurs over a range 8
9 Results Ductile-to-Brittle Transition C 1125 C Open = Ductile Closed = Brittle Proposed Limit 1200 C 1125 C Open = Ductile Closed = Brittle Proposed Limit 14 ECR (%) Brittle Brittle Zircaloy-4 Ductile Optimized ZIRLO Ductile Hydrogen (ppm) Hydrogen (ppm) Similar ductile-to brittle transition Transition occurs over a range 9
 Prior-β 19.")
 layer observed in")
10 Post-Quench Microstructure Zircaloy-4 ZIRLO Oxide α(o) Prior-β 19.1% ECR and ~10 ppm H (both materials) Protrusions of α(o) layer observed in ZIRLO and Optimized ZIRLO 10
11 Post-Quench Microstructure Layer Thickness High Oxidation ~10 ppm H Low Oxidation 200 ppm H Similar layer thicknesses between alloys and along oxidation samples 11
12 Summary PQD Testing Zircaloy-4, ZIRLO and Optimized ZIRLO tested High temperature oxidation and quenching Evaluation of ductility via ring compression testing Variability within single oxidation samples Similar ductile-to-brittle transition Transition occurs over a range Protrusions of α(o) layer observed in Nb containing alloys Similar average thickness of oxide and α(o) layers Prompts study of formation of post-quench microstructure 12
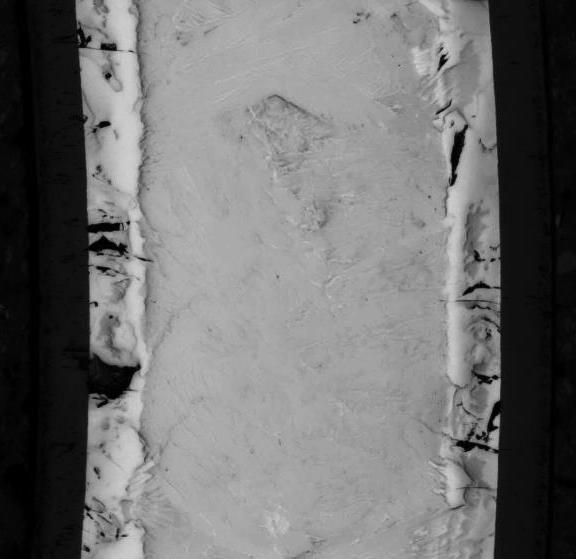
 subjected to standard cooling and direct quenching")
13 Post-Quench Microstructure Optimized ZIRLO samples (~10 ppm H) subjected to standard cooling and direct quenching 13
14 Post-Quench Microstructure Prior-β Microhardness Evolution of hardness (oxygen) during cooling 14

15 Post-Quench Microstructure Standard Cooling Direct Quench Optimized ZIRLO ~10ppm H ~19% ECR 200 µm 15
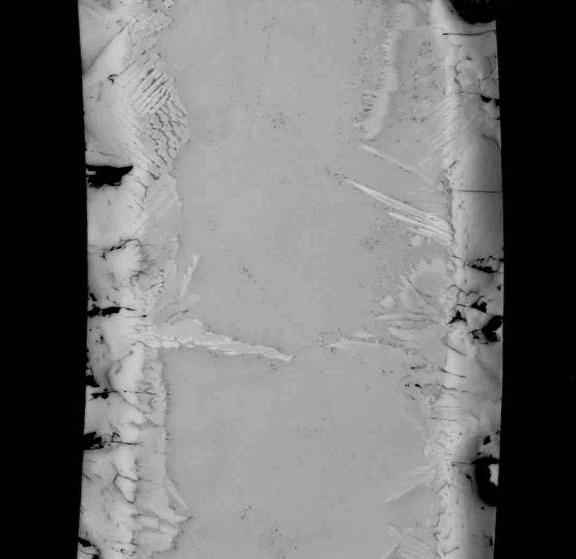
 Optimized ZIRLO Direct Quench 100")
")
16 Post-Quench Microstructure Formation of α(o) Optimized ZIRLO Direct Quench 100 µm Electron Image Oxygen Indications of step change in O content within α(o) layer 16


17 Post-Quench Microstructure Formation of α(o) Optimized ZIRLO Direct Quench Oxygen Electron Image Profile 1 50 µm Profile 2 Optical Image Profile 1 Profile 2 Oxygen Microns 17

 Optical")
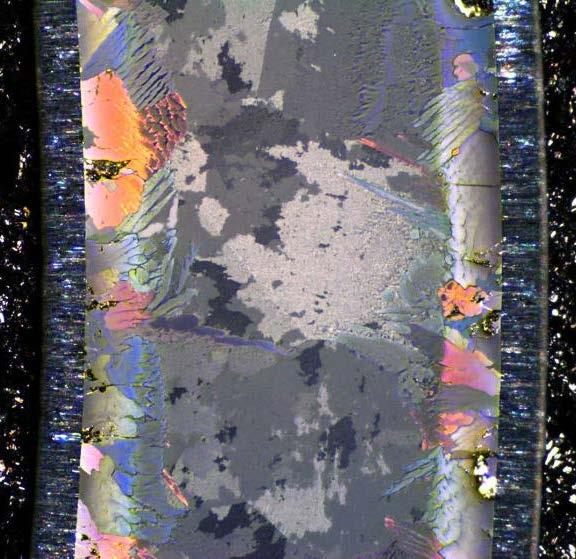
18 Westinghouse Non-Proprietary Class 3 Post-Quench Microstructure Formation of α(o) Optimized ZIRLO Standard Cooling Optical (Bright Field) Optical (Polarized) 100 µm 18


19 Post-Quench Microstructure Formation of α(o) Optimized ZIRLO Standard Cooling Electron Image Iron Oxygen Profile 2 Profile 1 Optical Image (Polarized) Niobium Profile 1 Profile 2 Oxygen 50 µm Microns
20 Westinghouse Proprietary Class 2 Microstructure Evolution Transformation temperatures unknown Affected by O diffusion Affected by kinetics β Temperature β α α Time 20
21 Westinghouse Proprietary Class 2 Microstructure Evolution Transformation Oxidation temperatures unknown Affected α to β transformation by O diffusion Affected O ingress by into kinetics β phase Stabilization of α(o) by diffusion β stabilizers in solution in β phase Early stages of segregation Temperature β α β α Time Oxide β-phase Oxygen rich α(o) α-phase β-stabilizer (slow) β-stabilizer (fast) 21
22 Westinghouse Proprietary Class 2 Microstructure Evolution Transformation Oxidation Oxide growth temperatures unknown Affected α(o) to β growth transformation by O diffusion Affected O β grain ingress growth by into kinetics β phase β stabilizers Stabilization segregate of α(o) by diffusion β stabilizers Different diffusion in solution kinetics β phase Early stages of segregation Temperature β α β α Time Oxide β-phase Oxygen rich α(o) α-phase β-stabilizer (slow) β-stabilizer (fast) 22
23 Westinghouse Proprietary Class 2 Microstructure Evolution Transformation Oxidation Oxide Thermal growth β to temperatures α transformation unknown Affected α(o) Formation to β growth transformation by of O α diffusion protrusions Direct quench: long protrusions Affected O β grain ingress growth by into kinetics β phase Stabilization of α(o) by diffusion β stabilizers segregate β stabilizers Different Between diffusion α in protrusions solution kinetics β phase Oxygen Early segregates stages of segregation to new α Standard cooling: uniform propagation Standard cooling: O depletion in the middle Temperature β α β α Direct Standard Time Oxide β-phase Oxygen rich α(o) α-phase β-stabilizer (slow) β-stabilizer (fast) 23


 α-phase β-stabilizer (slow)")
24 Westinghouse Proprietary Class 2 Microstructure Evolution Transformation β Oxidation Oxide Thermal to α transformation growth β to temperatures α transformation complete unknown Formation Affected α(o) to β growth transformation by of O α diffusion colonies protrusions Affected O β grain ingress Morphology Direct quench: growth by into kinetics β de phase pends long protrusions on cooling Stabilization of α(o) by diffusion Precipitation β stabilizers segregate of β stabilizers β stabilizers Between Different Between α diffusion in lamellas protrusions solution kinetics β phase Oxygen Early segregates stages of segregation to new α Standard cooling: uniform propagation Standard cooling: O depletion in the middle Temperature β α β α Direct Standard Oxide β-phase Oxygen rich α(o) α-phase β-stabilizer (slow) β-stabilizer (fast) Direct Time Standard 24
25 Summary Post-Quench Microstructure Development of hard oxygen-enriched α(o) layer studied Probably formed in two stages First stage at high temperature by O diffusion Second stage during cooling Protrusions probably related to presence of slow β-stabilizers Formation α(o) layer is important for resulting ductility 25
26 Thank you for your attention 26