Airfield Concrete Mixture Optimization
|
|
|
- Eugenia Carter
- 5 years ago
- Views:
Transcription
1 Airfield Concrete Mixture Optimization SWIFT Conference Calgary, Alberta Gary L. Mitchell, P.E. Director of Airports and Pavement Technology

2 Aknowledgement John R. Anderson, Ph.D., P.E. 4 Lawn Street Oviedo, FL jranderson@tigerbrain.com
3 Concrete Optimization Why? What? How?

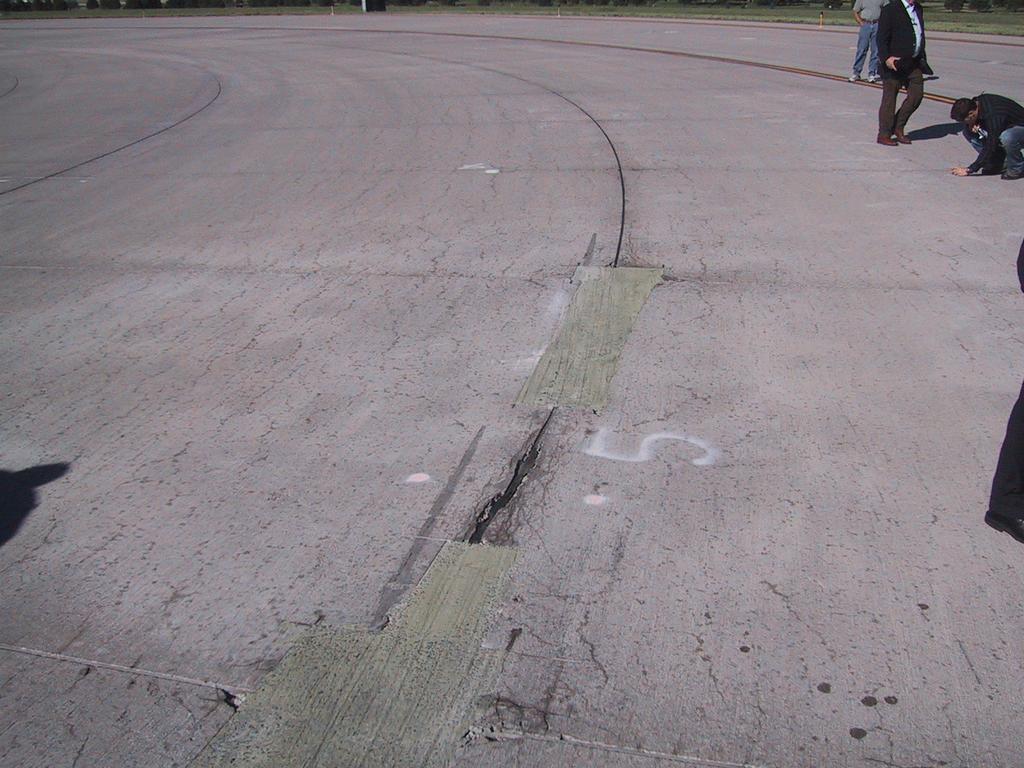
4 Why? Avoid Sliver Spalls! Within 1 inch of joint Max Depth = Seal Reservoir

5 What is Mix Optimization? Combined Gradation Dense graded aggregates Concrete 85% Aggregate Aggregates control Concrete Similar in concept to Granular Base Hot Mix Asphalt
6 Quality Concrete Quality is not about Strength Quality is not about proper air content Quality is not about concrete slump Quality is not about 100% Inspection
7 Quality Concrete Is: Durable Concrete No sliver spalls No scaling, surface spalls No reactivity / aggregate durability issues
8 Quality Airfields Are: Functional Proper Drainage Slab size/thickness/layer strengths If incorrect = cracked slabs
9 PCC Mix History Dense-graded prior to WWII After WWII began asphalt industry; intermediate aggregates for aspahlt PCC became gap graded Admixture use increases Shilstone Mixes USAF Combined Gradation 1997
10 Gap-Graded PCC Mixes Common Specifications - ACI No. 57 or No. 67 Stone ASTM C33 Sand Produce gap-graded mix Large aggregate + sand High paste demand to fill voids between large aggregate
11 ASTM C33 No. 57 Stone Gradation ASTM ASTM SIEVE SIZE MIN MAX 1.5 in mm in mm in mm NO mm 0 10 NO mm PERCENT PASS in. 1.0 in. 0.5 in. NO. 4 NO SIEVE SIZE
12 Typical Sand Gradation FINENESS MODULAS CALCULATION MODIFIED LOWER LIMITS FOR HIGH CEMENT FACTOR 400 lbs SIEVE SIZE % PASSING 3/8 9.5 MM NO MM NO MM NO MM NO mm NO mm NO mm TOTAL 427 FINENESS MODULAS 2.73 ASTM C-33 LIMITS FM 2.3 TO % MAX BETWEEN SIEVES PERCENT PASS SIEVE SIZE
13 Can Coarse Sand be Specified? FINENESS MODULAS CALCULATION MODIFIED LOWER LIMITS FOR HIGH CEMENT FACTOR 400 lbs SIEVE SIZE % PASSING 3/8 9.5 MM NO MM NO MM NO MM NO mm NO mm NO mm TOTAL 355 FINENESS MODULAS 3.45 ASTM C-33 LIMITS FM 2.3 TO % MAX BETWEEN SIEVES PERCENT PASS SIEVE SIZE
14 Aggregate Grading Gap-graded Optimized
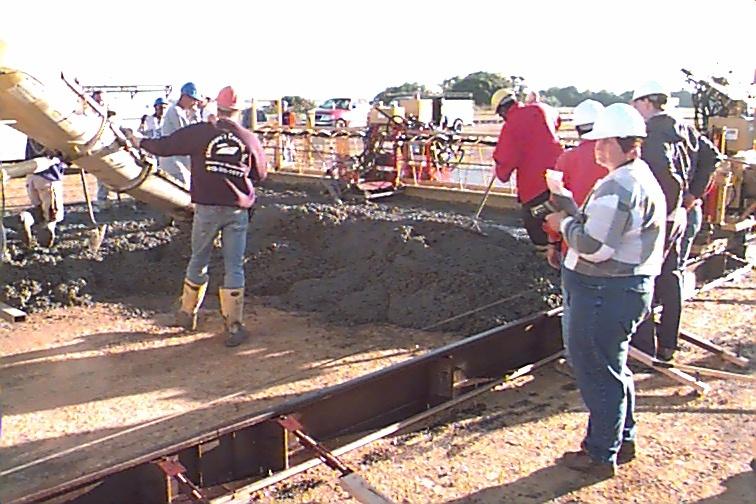
15 Gap Continued Large aggregate Issues Harsh, difficult to place and finish Desire to add water, sand, superplasticizers All bad for airfield paving Paste and mortar required to fill voids Work concrete to finish, paste/mortar at edges
16 Gap Mixes Paste and mortar required to fill voids Work concrete to finish Paste/mortar collect at edges; create weak pockets to spall Slipform edges slump; rebuild by hand, paste/mortar pockets and spalling
17 How Do I Optimize? 1997 USAF ETL 97-5 UFGS P-501 Allowable P-50X Shilstone
18 Optimization Guidelines Use Combined Materials Workability and Coarseness Factors WF: Percent Pass No. 8 Sieve CF: 3/8 Retained % / No. 8 Retained % Percent Aggregate Retained 0.45 Power Curve
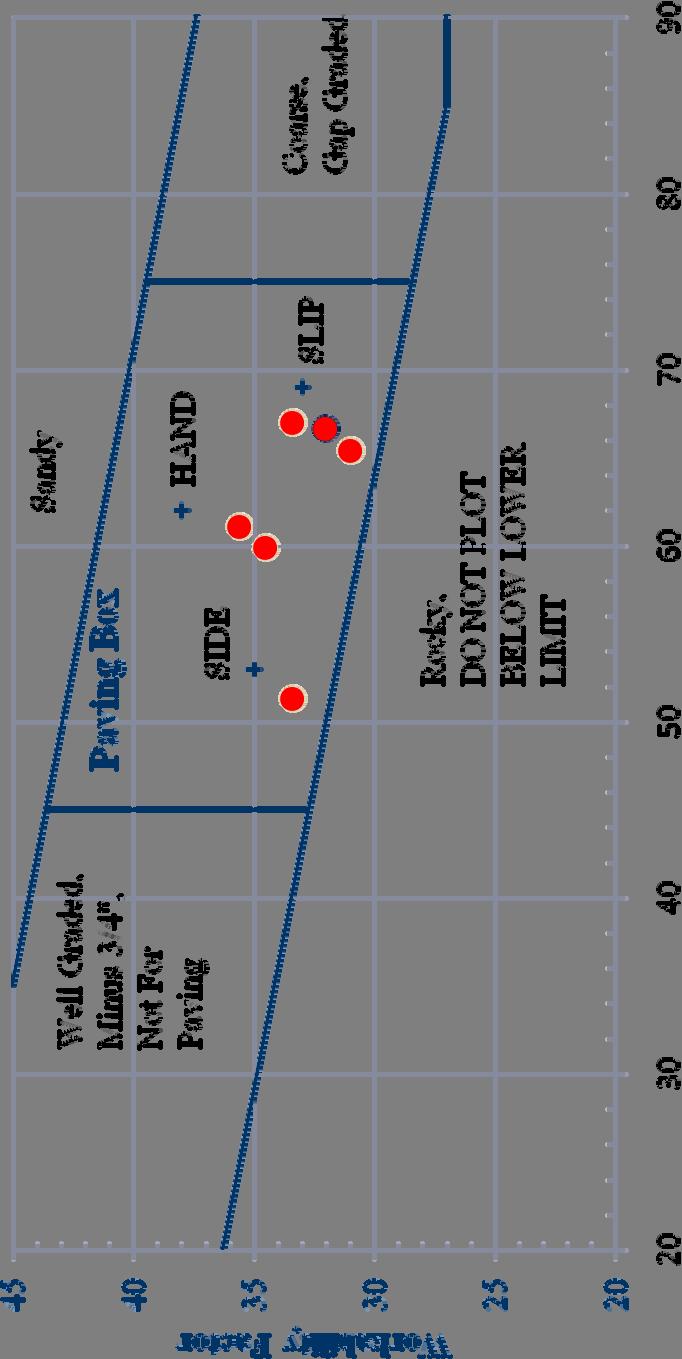
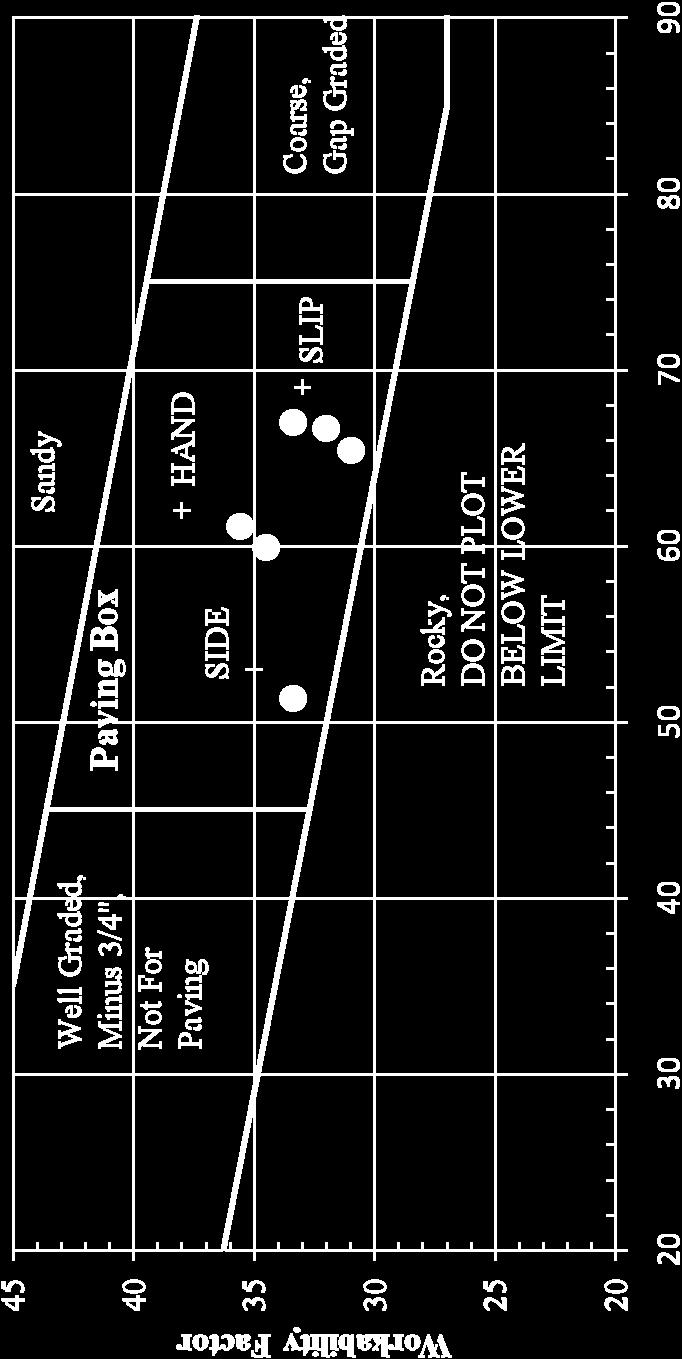
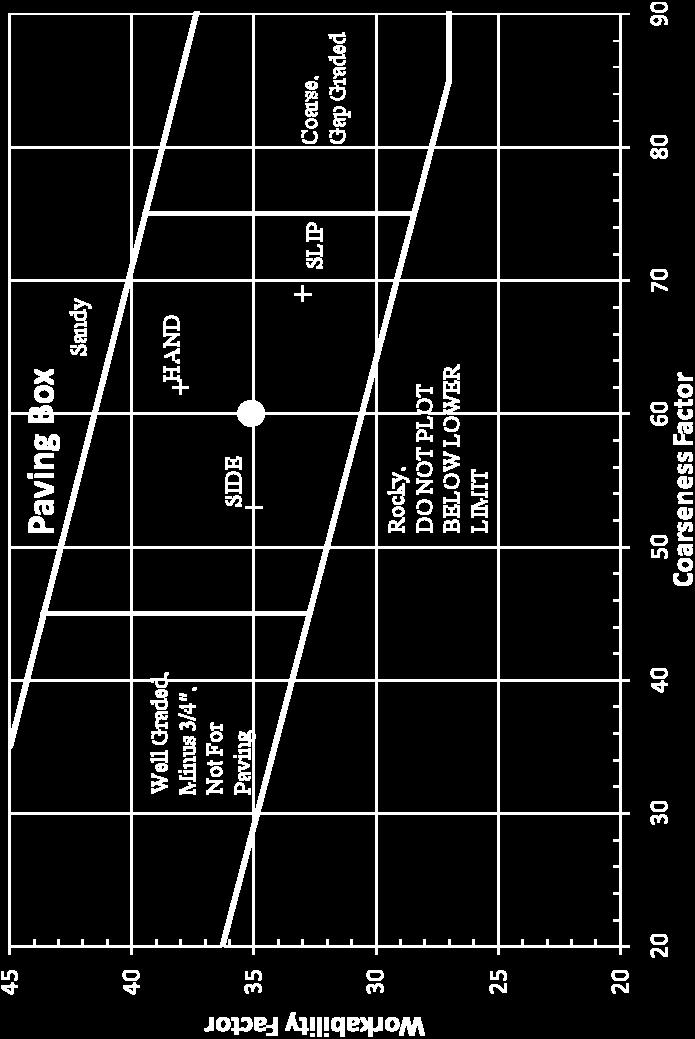
19 2 USAF Constructability Chart AGGREGATE SIZE FINE COARSE NOTES: 1 COARSE GAP GRADED 80 SANDY 70 WELLGRADED 1-1/2"-3/4" 60 COARSENESS FACTOR = ROCKY 50 COARSENESS FACTOR WELLGRADED Minus 3/4" CONTROL LINE 40 % RETAINED ABOVE 9.5mm SIEVE % RETAINED ABOVE #8 SIEVE X 100 WORKABILITY FACTOR 2 WORKABILITY FACTOR = % PASSING #8
20 WF & CF
21 Aggregate Proportioning Guide
22 WF & CF = Big Box Big Box is mandatory Outside, mix will not work Inside, mix occasionally has issues Percent Retained & 0.45 Power Curve help refine
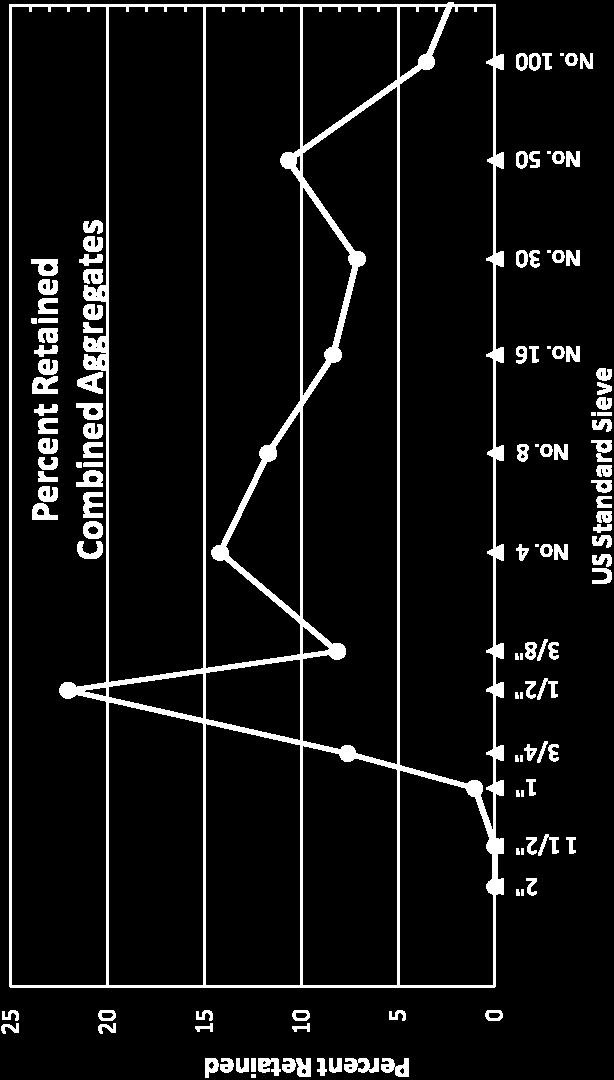
23 Percent Retained Highest Peak on 1/2 inch sieve or larger At least 4 points difference between peaks Sum of two adjacent points is 13% or more, except for maximum size, No. 100 and No. 200 sieves No more than 2 low points between 2 peaks


24 Percent Retained Channel Islands


25 Percent Retained Equal Peaks Base X Highly sensitive to water too hard to pave

26 Two Peaks -Water Sensitivity
27 Two Peaks

28 0.45 Power Curve Memphis
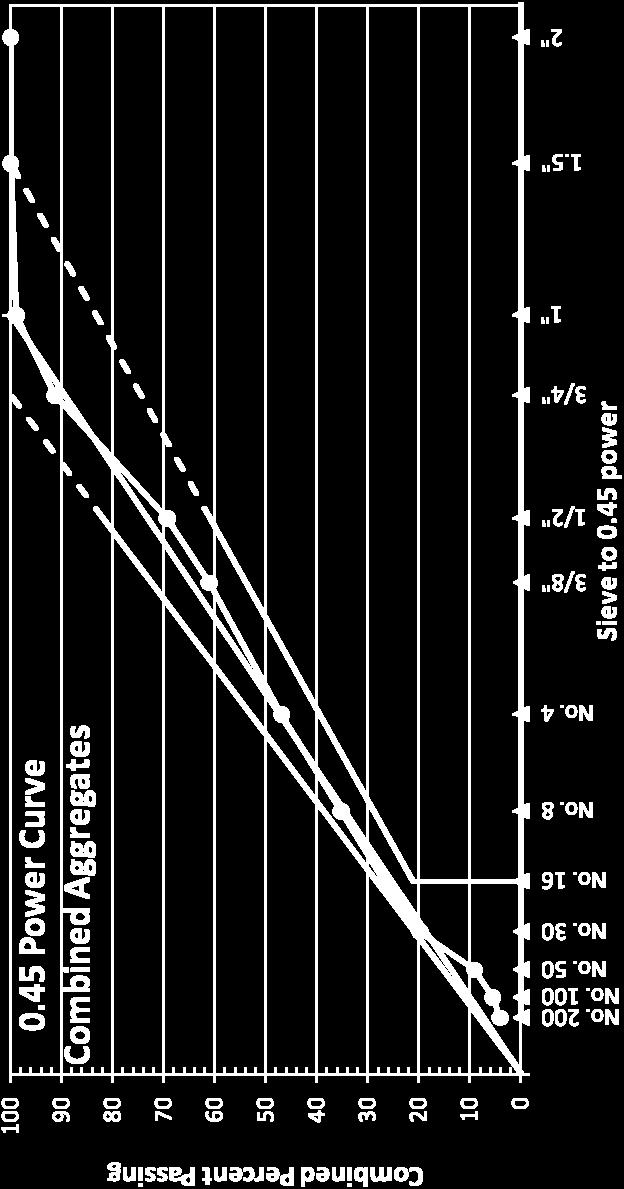
29 0.45 Power Curve Never exceed upper solid line Never consider exceeding upper solid line Avoid exceeding upper solid line Do not parallel the maximum density line -Upper Solid Line Controls Sliver Spalls -Especially in the No. 16 to No. 100 Sieves -Parallel Contributes to Sliver Spalls, difficult to work


30 0.45 Power Curve - Good Puerto Rico Mix 1

31 Do Not Parallel Max Density Base X


32 0.45 Power Curve - Good Puerto Rico Mix 2

33 0.45 Power Curve - Good Channel I l d

34 Memphis R/W 9-27

35 Memphis R/W 9-27

36 Memphis R/W 9-27
37 Aggregate Shape & Size Slipform needs crushed aggregate Sideform may use gravels or crushed Maximum size let the contractor choose ¾ inch or larger Larger max size requires more intermediate sizes 1.5 rock is not available everywhere
38 To Be Wise This is all paper analysis Must make trial batches with batch plant Must adjust proportions to optimize mix do it with the contractor Must pave and adjust proportions to paver and site Combined proportions are the approved mix
39 Daily Paving Gradation of each stockpile prior to paving Mathematically check combined gradation Adjust individual batch weights to achieve target combined gradation If WF is + 3pts and CF + 5 pts, May see placement workability changes No measurable strength changes

40 How Do you Know its Right?

41 Not Quite There

42 But it looks good?

43 But after fixing the plant

44 Memphis ANG

45 Memphis ANG

46 Memphis R/W 9-27

47 Memphis R/W 9-27

48 San Juan R/W Not Quite

49 San Juan R/W Got it!
50 Mineral Admixture Fly Ash Class F - >15% and < 25% Class C be careful (chemical analysis) Chemical Admixture n n n n n Air entraining Set-retarding Accelerating Water reducing Must be compatible with other components
51 Mineral Admixtures Flyash Improves Durability Increases Water Demand Increases AEA Sand Reduction Class C contains calcium Hot Cold GGBFS Cementitious Improves Durability Improves Workability No Bleed Water Stiff Mix Sensitive to Vibration Saw Cutting Critical
52 Basic Cement Reaction 2 C 3 S + 6H = C 3 S 2 H CH + heat Additional Water yields no additional C-S-H 2 C 3 S + 8 H = C 3 S 2 H CH +2H + heat Min w/c for full hydration < 0.32
53 Age Effects Pores (excess water) CH C-S-H
54 Pozzolans Reactive Silica from Ash, Slag, Fume Bonds Chemically with CH formed by cement reaction Slower Strength Gain Takes time to get started No heat early Doesn t retard but does dilute Improves Durability Fills existing pores Removes reactive components
55 Pozzolanic Reaction CH CH + S = C-S-H Additional Curing Time Lower early strengths Higher ultimate strengths Reduced permeability Pozzolan (reactive silica)
56 Pozzolans: Typical Quantities Fly Ash: % 25 % max if deicing salt exposure Help mitigate ASR?? Slag: % Silica Fume: 5 12 % Cost High water demand (HRWR typically)
57 Pozzolans: Effect of Replacement Fly Ash: 20% 1.2 to 1.3 to 1 (or higher) 130 PCY to replace 100 PCY of cement Slag: 50% 1 to 1 replacement Silica Fume: 7% Very high cost High strength and durable
58
59 What is ASR Potential? Potential Exists When >5 lbs/cu yd alkali Moisture Reactive Aggregate Concentrated Alkali s ASR Potential lbs 500 lbs
60 Control (1 N NaOH Soak Solution) Expansion, % SPRATT NC SD NM Time in days
61 Effect of Fly Ash & Slag Additions on ASR Expansions NORTH CAROLINA (Standard ASTM 1260 Test - 1N NaOH) Expansion(% Age (Days) 25% Low Lime FA (5.19%) 25% Intermed. Lime FA (15.74%) 25% High Lime FA (28.37%) Control 40% Slag
62 Effect of Fly Ash & Slag Additions on ASR Expansions NORTH CAROLINA (Modified ASTM 1260 Test - 50% conc. Potassium Acetate) Expansion(% Age (Days) 25% Low Lime FA (5.19%) 25% Intermed. Lime FA (15.74%) 25% High Lime FA (28.37%) Control 40% Slag


63 Optimize Concrete Mixtures coupled with SCM can lead to longer lasting more durable airfields Pavements.

64 Questions?