Accelerated Tin Whisker Test Committee Update Phase 5 Evaluation
|
|
|
- Shana Roberts
- 5 years ago
- Views:
Transcription

1 Accelerated Tin Whisker Test Committee Update Phase 5 Evaluation Heidi L. Reynolds, Ph.D. Project Chair ECTC Tin Whisker Workshop Reno, NV May 29, 2007


2 Tin whisker test committee is a microcosm of the electronics industry ITRI Soldertec Micro Semi Soldering Tech. 1
3 Tin whisker test committee Committee Objective To develop industry standard test methods for predicting tin whiskers Committee Structure Richard Parker (current Chair) Delphi Electronics Heidi L. Reynolds (former Chair) Sun Microsystems Jack McCullen (Co-Chair) Intel Mark Kwoka (Co-Chair) Intersil John Osenbach (Co-Chair) LSI/Agere Weekly teleconferences Date: Thursdays Time: 8am PST Contacts Ron Gedney at Richard Parker at Committee is open to non-nemi members willing to contribute to the work 2

4 Accelerated Tin Whisker Test Committee Objective To identify accelerated test methods and to develop industry standard test methods for predicting tin whiskers. R. Parker/iNEMI Phase 5/March
5 Previous inemi Whisker Projects inemi proposed Tin Whisker Test Document in Based on Phase 1 & 2 Evaluations Phase 3 Evaluation ( ) Validate and verify proposed test methods Compare short-term (1 month) vs. long-term (1 year) testing. Results of Phase 3 Evaluation & other Industry Studies provided input for JEDEC standards. JEDEC standard JESD22A121/ Test Methods (May 2005) JEDEC standard JESD201/ Acceptance Criteria (March 2006) Phase 4 Evaluation Effects of electrical bias on the susceptibility of tin finishes to form and grow whiskers on tin plated components assembled with both lead-free and tin/lead solder. 4
6 Current Work Further optimization needed for true accelerated test. Phase 5 Evaluation Investigate the effects of temperature and humidity over a wide range of conditions. 5
7 Phase 5 Evaluation (Proposed by V. Schroeder, J. Osenbach & others to Test Group in 2004) Hypothesis Whisker presence and/or length, measured in isothermal environments, is a function of temperature and humidity. Whisker length could be discontinuous at a threshold point or could vary as a function of temperature and humidity over the entire tested range. If such a function exists and becomes known, this function can be used to determine: Optimal whisker test condition(s) Whether whisker behavior measured at accelerated testing conditions can be related to actual storage and/or customer service conditions. 6
8 Questions to answer in this experiment 1) What is the relationship (if any exists) between whisker presence and/or length variables of temperature and humidity? 2) Are two temperature/humidity tests necessary? 3) Has the inemi Test Group chosen the optimal two temperature/humidity tests? 4) Can the inemi tests be used to indicate behavior at other temperature/humidity points that could be relevant storage or service conditions? 5) What is happening during the accelerated test? 6) Why is there a variation between companies results? Compressive stress may be a factor 7) If reflow is an equalizer, but still have a variation. Then this may be a process issue not a plating issue. 7
9 Phase 5 Evaluation Test Matrix X shows JEDEC Std JESD201 Conditions Test Cell Conditions Temperature [C] X Humidity [% RH] (+/- 5) X X X 60 X X X X 85 X 100 X 8
 Matte Sn over Cu (C194) leadframe Post-plate heat treatment of 150C within 24 hours of plating")
10 Component used for Phase 5 Evaluation 16L SOIC Package Plating Thickness Generic Supplier Designation (A,B,C) Matte Sn over Cu (C194) leadframe Post-plate heat treatment of 150C within 24 hours of plating 9
11 Phase 5 Evaluation Sample Labeling Convention Supplier A,B or C A -X -X -a Nominal Plating Thickness 3 µm 10 µm Lot # (if more than one tested) Reflowed Condition R reflowed N non reflowed (as received) 10
12 temp/humidity conditions Test Cells LSI Phase 5 Evaluation (Approximate Total of hours in storage) *Inspection to ~5300 hours only due to limited resources. LSI LSI LSI Freescale ON Semi HP HP HP Delphi Agere Agere Agere Agere Freescale Microchip HP Intersil Anamet Delphi Cell Sample 60/87 60/60 60/10 30/87 85/85 30/60 45/60 30/10 60/40 100/60 1 A-3-N A-10-N A-10-R B-3-N B-10-N B-10-R C-3-N C-10-N-a C-10-R-a ~6550 hours ~9890 hours ~11,080 hours ~10,440 hours ~4000 hours ~8000 hours ~10,080 hours +15,000 hours* ~10,128 hours ~8000 hours 10 C-10-N-b 11 C-10-R-b 12 C-10-N-c 13 C-10-R-c 11
13 Phase 5 Evaluation Assumptions (Schroeder, Osenbach 5/6/04) Assumptions C194 will be representative of the ability of a particular temp/humidity condition to accelerate whisker growth. (Only one substrate used) Some cells will form whiskers to be able to assess differences in behavior as a function of temperature and humidity Differences in whisker behavior as a function of temperature and humidity in 320 days will indicate differences between 1 yr and some longer time. Same mechanism is working for 3 microns and 10 micron thick Sn. Same mechanism at all temp/humidity conditions and there is some relationship between them. 12
14 Phase 5 Evaluation Limitations (Schroeder, Osenbach 5/6/04) Limitations Due to the length of the test, threshold behavior could be confused with incubation times in excess of 320 days. Whiskers may not grow in enough cells to establish a functional relationship, only threshold points. A non-monotonic relationship may exist that will limit conclusions Substrate dependence is not taken into account, however, substrate dependence at ambient and 60C/93%RH will be available from the phase 3 DOE It is not clear whether the whisker saturation point, the whisker growth rate over a certain period of time, or the maximum whisker length at a certain point in time should be used to compare between temp/humidity conditions. If saturation point is most important, then there is a limitation because the saturation point may not be reached in a 320 day test 13


15 Surface Appearance (As Received) Courtesy J. Osenbach/2005 B-3-N A-10-N B-10-N C-10-N-a 14


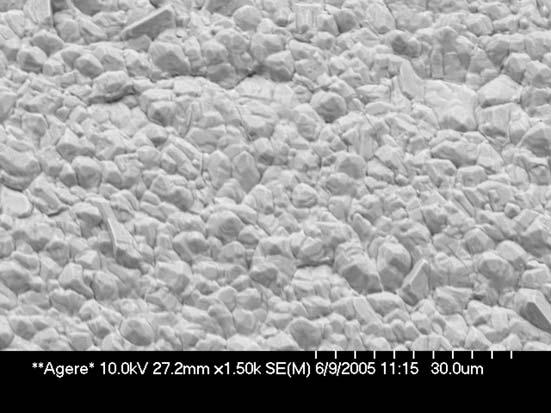

16 B-3-N Surface Morphology (As Received) Courtesy J. Osenbach/2005 A-10-N B-10-N C-10-N-a 15

")
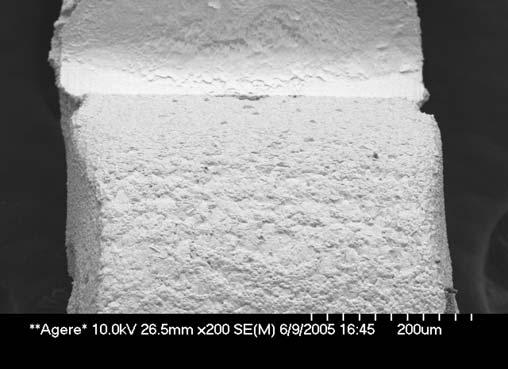

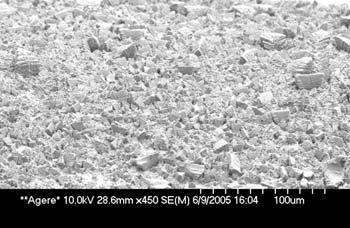
17 Surface Morphology (As Received) Courtesy J. Osenbach/2005 C-10- N-c C-10- N-c C-10- N-b C-10- N-b 16
18 Phase 5 Evaluation Inspection Protocol Notes: Used the JEDEC test method - 6 parts and 96 leads. Used Optical pre-screening to identify whiskers. Verified longest whiskers with SEM. If no whiskers present, checked 6 leads in SEM. Detailed inspection conducted on 18 leads if there were whiskers. Recorded whisker lengths optically. Verified longest 3 whiskers in SEM. Evaluated every ~2000 hours (varied depending on specific Test Cell). Used dry bag to avoid condensation in high humidity environments. Inspection diagram courtesy of ST Microelectronics 17
19 Observations of Whiskers in Corroded vs. Non-corroded Regions Where possible, whiskers growing in or near (< 200µm) corroded regions(x) were distinguished from whiskers growing in non-corroded regions(x). This distinction was more difficult in the Test Cells with higher whisker densities. Corrosion X 200µm X X 18

20 Phase C/60%RH 100 µm Corrosion Courtesy G. Henshall,
21 Phase 5 Evaluation Data Measured Incubation Time whisker growth corrosion Used to develop Acceleration Model Maximum whisker lengths # of leads with some whiskers present # of leads some corrosion present Used for Comparison & Analysis Complicated by variations in storage time Data analysis is ongoing 20
22 Phase 5 Test Cells exhibiting Corrosion and/or Whisker Growth during the allowed storage time C = Corrosion observed W = Whisker growth observed N = No corrosion or whiskers Temperature [C] N Humidity [% RH] (+/- 5) N C,W C,W 60 N N C,W C,W 85 C,W 100 C,W Whiskers in corroded & non-corroded regions are not distinguished from each other. 21
23 30C/60%RH Test Condition New Sn plating chemistries/processes substantially improved over last 3-5 years reflected in test samples No whisker growth or corrosion observed up to 8000 hours in Phase 5 Evaluation Essentially no whisker growth in any Phase 5 Test Cell with humidity <60%RH even for storage durations >9000 hours Based on industry tin whisker test data submitted over the previous two years, data from 30C/60% JEDEC test condition for 4000 hours does not grow whiskers. Recommend to JEDEC to remove the 30C/60%RH storage test condition from JESD201 Do not remove the 30C/60%RH storage condition from JESD22A Long- term data (>9000 hours) adds to knowledge base. 22
24 Acceleration Model Development from Phase 5 Evaluation Whisker Growth/Corrosion Incubation Time Data Acknowledgement John Osenbach, LSI/Agere 23
25 Data Analysis for Acceleration Model The time to first observation of corrosion or whisker formation for each cell of devices, for each aging condition where corrosion or whisker growth took place (85C/85%RH, 45C/60%RH, 60C/87%RH, 60C/60%RH, and 30C/90%RH) in Phase 5 was fit to three different commonly used Temperature/Relative Humidity acceleration functions: 1. Time = A*exp(Ea/kT)*exp(C%RH) 2. Time = A*exp(Ea/kT)*exp(C/%RH) 3. Time = A*exp(Ea/kT)*(%RH) F The best fit, as determined both by R 2 and by analysis of residual plots, was always equation 1. 24
26 Data Analysis (cont.) For AF Models To first order, variations between Suppliers A, B & C were not significants Corrosion Incubation Models: the data were grouped by; film thickness and if the devices were exposed to a simulated reflow Individual empirical models were developed for Film thickness/reflow: 3um thick, no reflow, data for all three suppliers (A,B,C) was fit 10um thick, no reflow, data for all three suppliers (A,B,C) was fit 10um thick, reflowed, data for all three suppliers (A,B,C) was fit Whisker Growth Incubation Models: the data were grouped by; film thickness, if the devices were exposed to reflow, and if whiskers were outside of a 200um radius of a corroded region or within a 200um radius of a corroded region or in the corroded region itself Individual empirical models were developed for Film thickness/reflow/corrosion: 3um thick/no reflow/no corrosion, data for all three suppliers (A,B,C) was fit 10um thick/no reflow/no corrosion, data for all three suppliers (A,B,C) was fit 10um thick/reflow/no corrosion, data for all three suppliers (A,B,C) was fit 3um thick/no reflow/corrosion, data for all three suppliers (A,B,C) was fit 10um thick/no reflow/corrosion, data for all three suppliers (A,B,C) was fit 10um thick/reflow/corrosion. data for all three suppliers (A,B,C) was fit 25
27 Corrosion Incubation Time (Key) Model: Corrosion/Whisker Incubation time = A*exp(Ea/KT)*exp(C*%RH); A, Ea, and C are empirically determined fitting functions x position/y position: Measured/calculated Empirical Model Residual: Ideally a plot of the residual versus time would produce a random data plot, e.g. no trend # of cells that have condition Regression line: Provides information on goodness of fit of model to data Ideally line would have: a slope of 1 and intercept of 0 Spread in experimental data time distribution at that test condition Experimentally Determined Time to Corrosion 26
28 Emperical Model Prediction: Time to Corrosion (hrs) Emperical Data Fit Model TTC = A*exp(Ea/kT)*exp(C*RH) A = hrs Ea = 0.38eV C = um Thick Film Corrosion Incubation Time 1 pt., 60C/60%RH 2 pts., 60C/60%RH 2 pts., 60C/87%RH 1 pt., 60C/87%RH 3 pts., 85C/85%RH 2 pts., 45C/60%RH 2 pts., 30C/90%RH 1 pt., 30C/90%RH Linear Regression y = 0.968x R2 = Experimentally Measured Time to First Observation of Corrosion (hrs) 27
29 Emperical Model Prediction: Time to Whisker (hrs) Emperical Data Fit Model TTW = A*exp(Ea/kT)*exp(C*RH) A = 1.15hrs Ea = 0.31eV C = pts., 60C/87%RH 3 pts., 85C/85%RH 3um Thick Film Non-Corroded Regions Whisker Incubation Time 1 pt., 60C/87%RH 3 pts., 30C/90%RH 1 pt., 60C/60%RH 2 pts., 60C/60%RH Linear Regression y = x R 2 = Experimentally Measured Time to First Observation of Whiskers (hrs) 28
30 Emperical Model Prediction: Time to Whisker (hrs) Emperical Data Fit Model All Data TTW = A*exp(Ea/kT)*exp(C*RH) A = 0.014hrs Ea = 0.41eV C = pts., 85C/85%RH 10um Thick Reflowed Film Non-Corroded Whisker Incubation Time Emperical Data Fit Model minus 45C/60%RH TTW = A*exp(Ea/kT)*exp(C*RH) A = 0.002hrs Ea = 0.47eV C = pts., 60C/87%RH 1 pt., 60C/60%RH 3pts., 60C/60%RH 4 pts., 60C/87%RH Linear Regression y = x R 2 = pt., 45C/60%RH Linear Regression y = x R 2 = without 45C/60%RH Experimentally Measured Time to First Observation of Whiskers (hrs) 29
31 For Matte Sn over Cu 1 150C Summary of fitting parameters for acceleration functions Incubation time for corrosion = A*exp(Ea/KT)*exp(C(%RH)) Film Type 3µm-N 10µm-N 10µm-R 10µm-N 10µm-R 3µm-N 10µm-N 10µm-R N N Y Y Y A (hrs) (2xA 3um ) 1.31 Corrosion N Ea (ev) C (%RH) C (%RH) R Incubation time for whiskers = A*exp(Ea/KT)*exp(C(%RH)) Film Type 3µm-N A (hrs) 1.15 Ea (ev) 0.31 R Incubation time for whiskers = A*exp(Ea/KT)*exp(C(%RH)) Whisker prone films: ref: J. Osenbach et. al, J. Mater. Sci.: Mater. Electron, pp (2007) A = 0.007hrs; Ea = 0.44eV; C = (%RH) 30
32 Temperature Effect- non-corroded regions Maximum Whisker Length (um) A3 A10 B3 C3 B10 C1-10 C2-10 C3-10 A10-R B10-R C1-10-R C2-10-R C3-10-R C/87%RH Storage Time (hrs) A3 A10 B3 C3 B10 C1-10 C2-10 C3-10 A10-R B10-R C1-10-R C2-10-R C3-10-R Maximum Whisker Length (um) C/87%RH Storage Time (hrs) Approximately 5X longer incubation time than 60C/87%RH 31
33 Relative Humidity Effect-non corroded regions Maximum Whisker Length (um) A3 A10 B3 C3 B10 C1-10 C2-10 C3-10 A10-R B10-R C1-10-R C2-10-R C3-10-R C/87%RH Storage Time (hrs) A3 A10 B3 C3 B10 C1-10 C2-10 C3-10 A10-R B10-R C1-10-R Maximum Whisker Length (um) C/60%RH Storage Time (hrs) Approximately 4X longer incubation time than 60C/87%RH 32
34 60C/87%RH Storage- Non-Corroded Region 250 Maximum Whisker Length (um) A3 A10 B3 C3 B10 C1-10 C2-10 C3-10 A10-R B10-R C1-10-R C2-10-R C3-10-R Storage Time (hrs) 33
35 60C/87%RH Storage- Corroded Region 300 Maximum Whisker Length (um) A3-C A10-C B3-C C3-C B10-C C1-10-C C2-10-C C3-10-C A10-R-C B10-R-C C1-10-R-C C2-10-R-C C3-10-R-C Storage Time (hrs) 34
36 60C/60%RH Storage Non-Corroded Region 90 Maximum Whisker Length (um) A3 A10 B3 C3 B10 C1-10 C2-10 C3-10 A10-R B10-R C1-10-R C2-10-R C3-10-R Time (hrs) 35
37 60C/60%RH Storage Corroded Region Maximum Whisker Length (um) A3-C A10-C B3-C C3-C B10-C C1-10-C C2-10-C C3-10-C A10-R-C B10-R-C C1-10-R-C C2-10-R-C C3-10-R-C Time (hrs) 36
38 85C/85%RH Storage- Corroded Region 180 8/12 curves are sub-linear 4/12 are initially sub-linear, then go super linear??? Does whisker growth in corroded regions saturate Maximum Whisker Length (um) A3-C A10-C B3-C C3-C B10-C C1-10-C C2-10-C C3-10-C A10-R-C B10-R-C C1-10-R-C C2-10-R-C Time (hrs) C3-10-R-C 37
39 Phase 5 Evaluation Results Saturation or no Saturation in Whisker Growth Rate? 1. Some of the films have growth rates that appear to be saturating (sub-linear whisker length versus time) followed increasing growth rate (super-linear whisker length versus time) 2. Some films have growth rates that appear to be saturating (sub-linear whisker length versus time) 3. Some films have whisker growth rates that are linear in time No clear evidence for or against ultimate saturation of whisker growth rate over time at the conditions where whisker were observed 38


40 Phase 5 Evaluation C/60%RH Whiskers with diverse morphologies within the same region stout & needle-like Courtesy R.D. Parker/March


41 Tin whiskers with classic features observed Phase 5 Evaluation: 8000 hours at 100C/60%RH Courtesy R.D. Parker/March


42 .and also some unique whisker features observed Phase 5 Evaluation: 8000 hours at 100C/60%RH Courtesy R.D. Parker/March
43 Acceleration Factors Assuming the Acceleration Model holds true, an Acceleration Factors (AF) can be calculated for different temperature and humidity conditions for both: Whisker Incubation Time (Example on next slide) Corrosion Incubation Time (Analysis in progress) 42
44 Whisker Incubation Time Acceleration Factor Normalized to 60C/87%RH Matte Sn over Cu; Data used to fit Model *Note: Data does NOT reflect information about whisker length or density Extrapolated from Model average-n Aver -C 3-N 3-C 10-N 10-C 10-R 10-R-C AF Use CAUTION in data interpretation for these test conditions See next slide Incubation time distribution is experimentally found to vary by approx. 1.5 to2x, thus prediction may be off by a factor of 2 Typically find t ~ C/87%RH Model predicts t ~ C/60%RH 100/60 85/85 60/87 60/60 60/40 60/10 45/60 30/87 30/60 30/10 Test Condition 43
45 Use CAUTION when interpreting AF (whisker incubation time) data for 85C/85%RH and 100C/60%RH Test Conditions Caution based on Phase 5 results Typically whiskers are found near corroded area Typically whisker density is low in non corroded area Whisker length is low in non-corroded area Caution also based on other literature and supplier data Data at 85C/85%RH often does not show whiskers in noncorroded areas 44

46 Factors not measured Contaminants? Stress in Sn platings Courtesy R.D. Parker/March 2007 Plans in progress to use flexure beam to measure insitu stress in plating processes from Suppliers A, B & C Value will be limited if there have been significant changes in the plating process since Phase 5 samples were plated 45
47 Ongoing Analysis Plating thickness Reflow vs. Non-reflowed Supplier Differences Lot variations for Supplier C AF for Corrosion Incubation time. 46
48 Modeling of maximum whisker lengths? Issue is still under technical debate With respect to Phase 5 Evaluation, the ability to model maximum whisker lengths was limited by the length of the experiment itself Some test cells had only just begun to growth whiskers Some researchers believe that because, statistically the maximum whisker length is the outlier of the entire whisker population, it cannot be modeled as a function of temperature and humidity. 47
49 Conclusions Whisker presence and the initiation of corrosion can be represented by a function of temperature and humidity. Two temperature/humidity conditions are not necessary. 60C/87%RH appears to be the optimal high temperature/high humidity test condition at this time for Sn over Cu substrates The inemi tests can be used to indicate behavior at other temperature/humidity points that could be relevant storage or service conditions within the limits of the whisker and corrosion (incubation) acceleration functions developed in this study. Whisker formation differs in corroded and non-corroded regions, but it appears that the incubation times for both regions can be modeled. Data are still under analysis and review regarding the effects of reflow and plating thickness 48
50 Acknowledgements Mark Kwoka (Intersil) Sample availability Jasbir Bath (Solectron) Reflow/Assembly Peng Su (Freescale) Testing/Inspection Anju Parasher (ON Semi) Testing/Inspection Ash Kumar (Microchip) Testing/Inspection Rich Parker (Delphi) Testing/Inspection John Osenbach (LSI/Agere) Testing/Inspect./Analysis Greg Henshall (HP) Testing/Inspection Ken Pytlewski, Rita Kirchhofer (Anamet) Inspection Mike Lanahan (Intersil) Inspection Ron Gedney and other inemi Staff Former Chair: Valeska Schroeder (J&J) Accelerated Tin Whisker Test Committee Members 49

51 contacts: Jim McElroy Bob Pfahl 50
52 Appendix Additional information from previous inemi experiments Additional graphs from Whisker and Corrosion Acceleration Models 51
53 Tin Whisker Test Project Evaluation History Phase 1: [Experimental] Bright Tin Plating Brass Coupons & SOIC packages Preconditioning Thermal Cycling (500 cycles) -40C to 90C Ambient Storage (1 week) Five Storage Environments (4 weeks) 55C/20%-60% RH 55C/85% RH 85C/20%-60% RH 85C/85% RH 20-25C/20%-60% RH Few whiskers formed Experimental (laboratory) plating had low impurity level? Incubation time for whisker formation not exceeded? 52
54 Tin Whisker Test Project Evaluation History Phase 2: [Production] Matte Tin Plating Brass Coupons, SOIC packages, Chip Components Legs Temp Cycle ( C) Temp ( C) & Relative Humidity (%) Supplier Plating Site Remarks 6-60, 95 A Temp & Humidity 7-60, 95 B Temp & Humidity 8-30, 90 A Humidity 9-30, 90 B Humidity to 85 30, 90 A Temp Cycle + Humidity to 85 30, 90 B Temp Cycle + Humidity to 85 Ambient A Test Temp Cycle to 85 Ambient B Test Temp Cycle 14 Ambient Ambient A Ambient 15 Ambient Ambient B Ambient Environmental Stress Conditions sufficient to create whiskers Thermal Cycling was most effective. Addition of temperature and humidity exposure did not significantly add to whisker length or frequency when TC performed first. Most significant effect was plating chemistry/plating process. 53
55 Tin Whisker Test Project Evaluation History Phase 3: Results presented at ECTC/Orlando 2005 Published in IEEE Journal (October 2006) Verify and Validate inemi recommended test conditions Provide additional input to JEDEC Environmental condition Uncontrolled 20 C to 25 C 20 to 60 % RH 60 C (+5) 93% RH (+2, -3) -55 C (+0, -10) to + 85 C (+10, -0) airto-air temperature cycle (20 min per cycle) Inspection interval 1000 to 3000 h Irregular (@2 kh &10 kh) 3 kh for N 7 kh for L,M 1000 h 2000 h 500 cycles Total Duration 10,000 hours 10,000 hours 9000 hours 9000 hours 3000 cycles 54
56 Phase 4 Evaluation Effects of electrical bias on the susceptibility of tin finishes to form and grow whiskers on tin plated components assembled with both lead-free and tin/lead solder. Presented at inemi Workshop/ECTC, San Diego, CA May
57 Emperical Model Prediction: Time to Corrosion (hrs) Emperical Data Fit Model TTC = A*exp(Ea/kT)*exp(C*RH) A = 2* hrs Ea = 0.38eV C = pts., 85C/85%RH 10um Thick Film Corrosion Incubation Time 3 pts., 60C/60%RH 3 pts., 60C/87%RH 1 pt., 30C/90%RH 2 pts., 60C/60%RH Linear Regression y = x R 2 = Experimentally Measured Time to First Observation of Corrosion (hrs) 56
58 Emperical Model Prediction: Time to Whisker (hrs) Emperical Data Fit Model TTW = A*exp(Ea/kT)*exp(C*RH) A = 5.16hrs Ea = 0.23eV C = pt., 60C/87%RH 3 pts., 85C/85%RH 3um Thick Film Corroded Regions Whisker Incubation Time 2 pts., 60C/87%RH 1 pt., 60C/60%RH 3 pts., 30C/90%RH 2 pts., 60C/60%RH Linear Regression y = x R 2 = Experimentally Measured Time to First Observation of Whiskers (hrs) 57
59 10um Thick Reflowed Film Corrosion Region Emperical Model Prediction: Time to Corrosion (hrs) Emperical Data Fit Model TTC = A*exp(Ea/kT)*exp(C*RH) A = 1.31hrs Ea = 0.28eV C = pts., 85C/85%RH 3 pts., 60C/60%RH 5 pts., 60C/87%RH 3 pts., 30C/90%RH 1 pt., 45C/60%RH 2 pts., 60C/60%RH Linear Regression y = 1.03x R 2 = Experimentally Measured Time to First Observation of Corrosion (hrs) 58
60 Emperical Model Prediction: Time to Whisker (hrs) um Thick Film Non-Corroded and Corroded regions Whisker Incubation Time Emperical Data Fit Model TTW = A*exp(Ea/kT)*exp(C*RH) A = 1.16hrs Ea = 0.28eV C = pts., 85C/85%RH 1 pt., 60C/87%RH 1 pt., 45C/60%RH 2 pts., 30C/90%RH 3 pts., 60C/60%RH 2pts., 60C/60%RH 2 pts., 60C/87%RH Linear Regression y = x R 2 = Experimentally Measured Time to First Observation of Whiskers (hrs) 59
61 Corrosion Incubation Time for 10µm m Reflowed films Emperical Model Prediction: Time to Corrosion (hrs)xxx Emperical Data Fit Model TTC = A*exp(Ea/kT)*exp(C%RH) A = 1.31hrs Ea = 0.28eV C = % Linear Regression: y = 1.03x R2 = pts., 85C/85%RH Emperical Data Fit Model TTC = A*exp(Ea/kT)*exp(C%RH) A = hrs Ea = 0.38eV C = % 3 pts., 30C/90%RH " Same as 3um non-corroded" Linear Regression: 1 pt., 45C/60%RH y = x R2 = pts., 60C/60%RH 5 pts., 60C/87%RH 2 pts., 60C/60%RH Experimentally Measured Time to First Observation of Corrosion (hrs) 60
62 Whisker Incubation Time for 3µm m films (Corroded Regions) Model: Whisker Incubation Time = A*exp(Ea/K/T)*exp(C*%RH); Best fit: A = 5.16(hrs), Ea = 0.23eV, and C = pts., 30C/90%RH Emperical Model Prediction: Time to Whisker (hrs) pt., 60C/87%RH 3 pts., 85C/85%RH 2 pts., 60C/87%RH 1 pt., 60C/60%RH 2 pts., 60C/60%RH Linear Regression y = x R 2 = Experimentally Measured Time to First Observation of Whiskers (hrs) 61
63 12000 Whisker Incubation Time for 10µm m Reflowed films ( Corroded Regions) Model: Whisker Incubation Time = A*exp(Ea/K/T)*exp(C*%RH); Best fit: A = 1.97(hrs), Ea = 0.30eV, and C = Emperical Model Prediction: Time to Whisker (hrs) pts., 60C/87%RH 3 pts., 85C/85%RH 4 pts., 60C/87%RH 1 pts., 60C/60%RH 2 pts., 60C/60%RH y = x R 2 = Experimentally Measured Time to First Observation of Whiskers (hrs) 62
64 Whisker Incubation Time for Whisker Prone films (non-corroded ) J. Osenbach et.al,, J. Mater. Sci.: Mater. Electron, pp (2007) Model: Whisker Incubation Time = A*exp(Ea/K/T)*exp(C*%RH); Best fit: A = 0.007(hrs), Ea = 0.44eV, and C = Emperical Model Prediction: Time to Whisker (hrs) y = x R 2 = Experimentally Measured Time to First Observation of Whiskers (hrs) 63