3D characterisationof the structure of activated carbon packed beds using X- ray microtomography
|
|
|
- Donna Price
- 5 years ago
- Views:
Transcription
1 3D characterisationof the structure of activated carbon packed beds using X- ray microtomography M. C. Almazán-Almazán 1, A. Léonard 2, J. López- Garzón 1, J. Abdullah 3, P. Marchot 2, S. Blacher 2 1 Department of Inorganic Chemistry, University of Granada, Spain 2 Laboratory of Chemical Engineering, University of Liège, Belgium 3 Centre for Computed Tomography and Industrial Imaging, Malaysian Nuclear Agency, Kajang, Malaysia 1
2 3D characterisationof the structure of activated carbon packed beds using X- ray microtomography Introduction 2


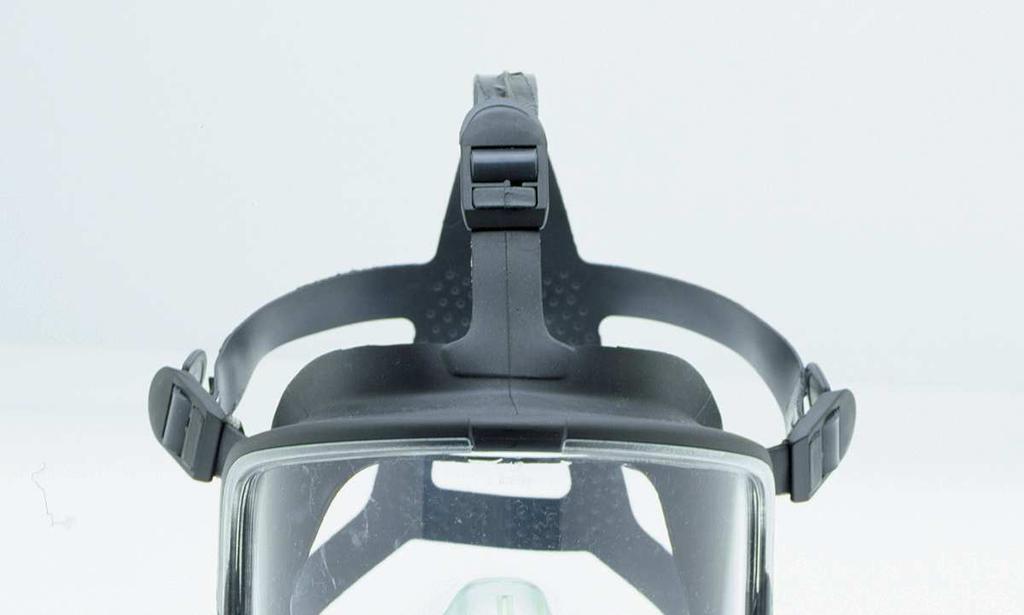
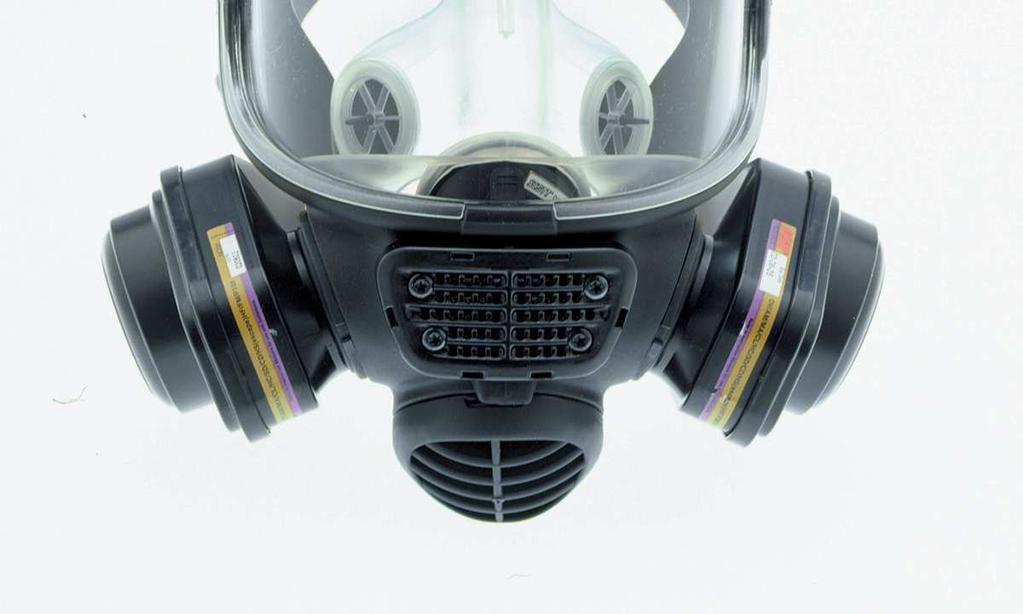
3 Air treatment Water treatment Activated carbon Individual protection Catalyst support 3
4 Importance of packing structure Adsorption of pollutants within carbon filters characterized by a breakthrough curve Sharp adsorption front: more efficient removal process Shape of the breakthrough curve depends on two main factors Texture of the adsorbent at the nanometric scale Macroscopic transport in the bed Impact of the packing structure on the gas transport Maldistribution Impact of tube-to-particle diameter ratio Importance of in-situ characterisation of the packing structure Microtomography = powerful tool for non destructive packing investigation 4
5 3D characterisationof the structure of activated carbon packed beds using X- ray microtomography Materials and methods 5
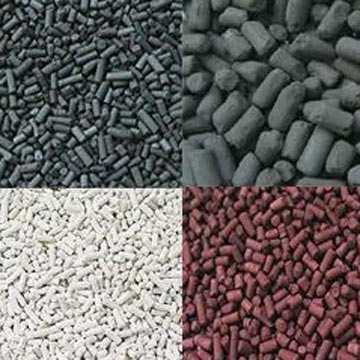
6 Activated carbon filters Plastic canisters Length: 33 mm Diameter: 15 and 26 mm influence of tube-to-particle diameter ratio Polydispersed commercial granular activated carbon Chemviron Carbon BPL 2 and 7 depending on the filter diameter 26 mm 15 mm 6

7 X-ray microtomograph Skyscan-1074 X-ray scanner Source: kv-1 ma ma Detector: x pixels 8-bit camera Pixel size: µm µm Rotation step: Acquisition time: minutes Cone-beam filtered backprojection reconstruction 7


8 Image analysis 3D image processing Image filtering Segmentation between carbon grains and voids Quantitative measurements Void fraction Void size distribution using opening size granulometry Radial void profiles a b c 15 mm 26 mm 15 mm 12 mm mmm mmm 8
9 3D characterisationof the structure of activated carbon packed beds using X- ray microtomography Results 9
10 Void fraction Comparison between results obtained from image analysis and physical measurements δ = 1 p M ρ V δ p = void fraction (-) M = weight of carbon in the filter (kg) V = volume of the packed bed (m³) ρ = carbon bulk density (kg/m³) Small filter Large filter Image analysis Physical measurement
 Peaks = interstitial voids (high grey levels) Small filter Large filter Smoother patterns for the large")
11 Void size distribution Grey level intensity distribution within a cross section Valleys = carbon grains (low grey levels) Peaks = interstitial voids (high grey levels) Small filter Large filter Smoother patterns for the large filter 11
12 Void size distribution Void distribution (-) Small Virgin fp filter Large filter Virgin FG Large filter Rather normal distribution Mean void size = 0.38 ±0.09 mm Small filter Larger distribution with a more complex shape Mean void size = 0.50 ±0.12 mm Impact of filter size on the gas flow! diameter (mm) 12
13 Radial profiles 0.10 Small Virgin filter Virgin Large FG filter fp Intensity (-) 0.07 β = β = wall of the bed distance from the wall (mm) center of the bed Decrease of grey level intensity from the wall to the center Wall effect: carbon concentration higher in the center Higher porosity at the wall channelling effect Oscillatory behaviour at a smaller scale Damped oscillations supposed to reach a constant value at high tube to particle diameter ratios 13
14 Radial profiles Small Virgin filter Virgin Large FG filter fp Fit with a monotonic exponential ( β r ) I decay ( r, µ ) = A( µ ) + B( µ ) e 0.08 Intensity (-) wall of the bed β = 0.44 distance from the wall (mm) β = 0.14 Larger decay constant for the small filter: β= 0.44 Less uniform distribution Larger carbon gradient concentration from the wall to the center center of the bed 14
15 Radial profiles Analysis of the oscillating behaviourfit with a monotonic exponential Substraction of fitted radial profiles from measured ones I osc ( r) = I( r) I ( r) decay Small Virgin filter fp Virgin Large FG filter 1.5 Large Virgin FG filter I osc (-) Power Spectra ( 10-5 ) wall of center of the bed distance from the wall (mm) the bed Frequency (mm -1 ) No clear periodic behaviour for the small filter uneven packing Periodic behaviour for the large filter power spectra Main peak at a frequency of 7.12 mm -1 Characteristic length = 0.8 mm diameter of carbon grain Packing layer by layer in the filter 15
16 3D characterisationof the structure of activated carbon packed beds using X- ray microtomography Conclusions 16
17 Conclusions X-ray microtomography coupled to image analysis= powerful tool to characterise the 3D structure of activated carbon beds Total void fraction in agreement with physical measurements Results in agreement with well-known packing beds features Influence of tube-to-particle ratio The larger this ratio, the more uniform the void size distribution Important wall effects for small ratios Perspectives Determination of tortuosity and connectivity Setting up relations between packing microstructure and motion of adsorbate concentration front in the bed in situ follow up X-ray microtomography Use of 3D images to simulate the filter operation by the lattice Boltzmann methodology First step = simulation of gas flow Second step = coupling between gas flow pattern and adsorption 17
18 Acknowledgements M.C.A.A. acknowledges financial support of MEC and FCYT as a postdoctoral contract. A. Léonardis grateful to the Fund for Scientific Research (FRS-FNRS, Belgium) for a Research Associate Position. 18