Waste Vitrification - Overview of Current Practice
|
|
|
- Cathleen Richards
- 5 years ago
- Views:
Transcription

1 Waste Vitrification - Overview of Current Practice Ian L. Pegg Vitreous State Laboratory The Catholic University of America Washington, DC ICTP-IAEA Workshop November 6 10, 2017
2 Overview VSL background Vitrification what and why? Vitrification constraints Glass formulation and process optimization Defense legacy wastes vs. modern reprocessing wastes Vitrification processes Off-gas treatment 2


3 Glass Formulation and Process Development at VSL West Valley (WVDP), NY SRS M Area Sellafield, UK Savannah River DWPF Rokkasho, Japan Developed the glass formulations used at WVDP and SRS M-Area Support to Hanford WTP since 1996 Support to Rokkasho since 2005 Support to DWPF since 2009 VSL Joule Heated Ceramic Melter (JHCM) Systems: The largest array of JHCM test systems in the US The largest JHCM test platform in the US Hanford WTP 3 scales, 60X scale-up across VSL test melters 3
4 Vitrification Immobilization of waste by conversion into a glass Internationally accepted treatment for HLW Can also have advantages for other waste streams Why glass? Amorphous material able to incorporate a wide spectrum of elements over wide ranges of composition; resistant to radiation and transmutation damage Waste elements become part of the glass structure Long-term durability natural analogs Relatively simple process amenable to nuclearization at large scale There are numerous glass-forming systems why borosilicate glass? Relatively low-melting temperature Materials of construction, component lifetimes Potential for high chemical durability 4
5 Vitrification Waste and additives are heated and react to form molten glass Additives can be separate chemicals or a glass frit Can be pre-mixed or fed separately Additives are formulated to optimize the process Molten glass is typically poured into containers where it solidifies; container is sealed and decontaminated Alternatively, melting can be done in the disposal container Major systems: Waste and Additives Feed System /Pretreatment Melter Off-Gas Treatment System Exhaust Glass Product Handling 5
6 During Vitrification Water is evaporated Salts melt and decompose Na 2 CO 3 Na 2 O + CO 2 ; Al(NO 3 ) 3 Al 2 O 3 + NO x, 2FeOOH Fe 2 O 3 + H 2 O; etc. Oxides react and melt to form molten glass Organics are pyrolyzed and oxidized Most metals, if present, are oxidized if sufficiently small amounts and particle size Most species are incorporated into silicate glasses as their oxides; exceptions include Cl, F, I Volatile species (such as H 2 O, CO 2, NO x, etc.) are completely lost to the off-gas stream Typically contributes to significant volume reduction Other species are retained in the glass melt to varying extents Additional losses due to physical entrainment (dust) 6

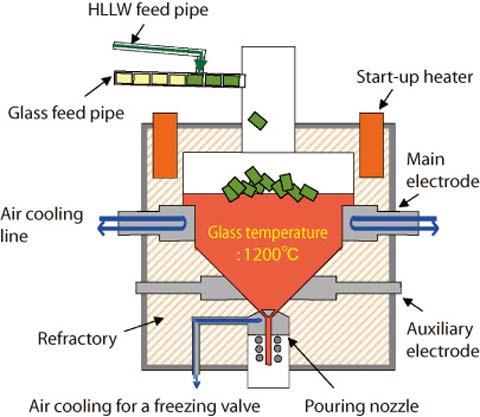
7 JHCM Principle of Operation Reaction at an interface so melt rate scales as the melt surface area, other things equal Melt rate also depends on temperature, mixing, feed and glass composition, etc. PAMELA, WVDP, DWPF, WTP, Mayak, VEK, Rokkasho, Tokai, Lanzhou, etc. Waste + glass forming additives (chemicals or frit) Off-gas Glass Product 7
 AC-S Heater (801) TCO SCR PBS HEME 2 S2 S6 S 10 S 13 S 15 To Storage Tank Glass Receiving Drum Wand Transfer Pump S4 About 400,000 kg glass made from about 1 million")
8 VSL DM1200 HLW Pilot Melter System HEPA To Stack Feed Line Emergency Off Gas Line Organic Injection Pump Film Cooler Blower Control Air Blower Paxton S9 S 16 Paxton S1 S3 S5 S7 S8 HEPA S 11 S 12 S 14 Melter SBS WESP HEME Heater (701) AC-S Heater (801) TCO SCR PBS HEME 2 S2 S6 S 10 S 13 S 15 To Storage Tank Glass Receiving Drum Wand Transfer Pump S4 About 400,000 kg glass made from about 1 million kg feed 8

9 DM1200 Cold Cap Samples Spinel and Noble Metals Phases RuO 2 Spinel 1 mm 1 m Rh-spinel RuO 2 10 m 9

10 Inside the VSL DM1200 HLW Pilot Melter: Start of Feeding 10

11 Inside the VSL DM1200 HLW Pilot Melter: Partial Cold Cap 11

12 Inside the VSL DM1200 HLW Pilot Melter: Steady State 12
13 Process Optimization Higher waste treatment rate capability translates into cost savings through small plant size and/or reduced operating time Waste Treatment Rate = Glass Production Rate X Waste Loading in Glass Increased waste loading increases waste treatment rate and reduces volume for disposal Increased glass production rate increases waste treatment rate Both factors depend on waste composition and glass composition Optimization of glass composition can have drastic effects on overall process economics Such changes are easy to implement since they do not require hardware changes Complicated by numerous components present in typical wastes Problem in constrained optimization of multiple properties with respect to numerous composition variables Typically requires large data sets and development of glass propertycomposition models 13

 Other Typically also require")
14 Typical Vitrification Constraints Product Quality Depends on requirements Chemical durability per specific short-term test and long-term performance assessment Thermal and radiation stability Phase composition Heat load Processability Depends on melter technology Melt viscosity Melt electrical conductivity Crystallinity Salt formation e.g., sulfate, molybdate, etc. Processing rate Economic Processing rate Waste loading Volume reduction Materials compatibility (melter lifetime) Other Typically also require information on properties such as density, thermal conductivity, heat capacity, etc. 14

15 Sulfate Salt Formation High-sulfate feeds increase the tendency for sulfate salt formation Sulfate salt formation in the melter is deleterious: Salt is very corrosive, low melting, very fluid, highly electrically conductive, and incorporates toxic elements (e.g., Cr) and radionuclides (e.g., Tc, Cs, Sr) into the water-soluble salt Additives such as Li, V, Ca significantly increase sulfate tolerance Cl, Cr, Mo, Re reduce sulfate tolerance Molybdate Na/Li/Cs Molybdate Ca/Ba Molybdate Suction sampling for salt on melter floor (denser CaMoO 4 ) Dip sampling for surface salt (Na 2 MoO 4 ) Yellow Phase Glass Pool DM10 Melter Sampling Discharged Glass 15

 YP Floats HLW glass")
16 Yellow Phase Evolution Phase stability of yellow phase varies with temperature Migration of yellow phase depends on salt composition Density (f(c i,t)) YP Sinks (lower T Ca-Mo separate) YP Floats HLW glass melts 16
17 Structural Characteristics of Mo in HLW Glass Molybdenum species in HLW glass: Mo 6+ O 4 2- by XAS (Mo XANES) Molybdenum species in HLW Glass: R 2 Mo 6+ O 4 2- by Raman 17
18 XAS (XANES, EXAFS) Studies on Silicate Glasses Na: Na + O 3-7 : Na-O = Å Mn: Mn 2+ O 4-5 : Mn-O = 2.07 Å, Mn-Mn = 3.48 Å Cu: Cu 2+ O 4 : Cu-O = 1.96 Å, Cu-Cu = 2.98 Å Sr: Sr 2+ O 4-5 : Sr-O = 2.53 Å Zr: Zr 4+ O 6-7 : Zr-O = 2.08 Å Mo: Mo 6+ O 4 : Mo-O = 1.75 Å Ag: Ag + O 2 : Ag-O = Å I: I - (Na,I) 4 : I-Li = 2.80 Å, I-Na = 3.04 Å Re: Re 7+ O 4 : Re-O = 1.74 Å Bi: Bi 3+ O 3 : Bi-O = 2.13 Å S: S 6+ O 4 surrounded by network modifiers; S 2- ; S-S Cl: Cl-O = 2.70 Å; Cl-Cl = 2.44 Å; Cl-Na; Cl-Ca V: V 5+ O 4 ; minor V 4+ O 5 under reducing conditions Cr: redox sensitive: Cr 6+ O 4 Cr-O = 1.64 Å; Cr 3+ O 6 Cr-O = 2.00 Å; Cr 2+ O 4 Cr-O ~ 2.02 Å Tc: redox sensitive, Tc 4+ O 6 Tc-O = 2.00Å; Tc 7+ O 4 Tc-O = 1.75 Å; evidence of Tc-Tc = 2.56 Å in hydrated, altered glass Sn: Sn 4+ O 6 (minor Sn 2+ O 4 ) Sn-O = 2.03 Å; Sn-Sn = 3.50 Å Al: Al 3+ O 4 : Al-O: 1.77 Å Si: Si 4+ O 4 : various polymerizations Zn: Zn 2+ O 4 : Zr-O: 1.96 Å, Zn-Si 2 nd nearest-neighbor evidence 18
19 Standard Glass Leach Tests - Examples Product Consistency Test (PCT) Glass powder ( um), deionized water, 90 o C, 7 days, S/V = 2000 m -1 Toxicity Characteristic Leaching Procedure (TCLP) Glass pieces (<1 cm), sodium acetate buffer (~ph 5), 23 o C, 18 hrs, constant end-overend rotation at 30 rpm MCC-1 Glass monolith, deionized water, typically 90 o C and 28 days, S/V = 10 m -1 Vapor Hydration Test Glass monolith, steam in pressure vessel at 200 o C, typically 24 days; measure altered layer thickness Single-Pass Flow Through Glass powder in flow cell; various leachants, temperatures, and flow rates; run to steady state concentrations in leachate Soxhlet Test Glass monolith, refluxing water (100 o C); variable durations IAEA Test Glass monolith, 25 o C, deionized water, periodic total replacement ANS/ANSI 16.1 Diffusion-based - primarily intended for cementious waste forms; cylinder, deionized water, 25 o C, periodic total replacement Many Others 19

20 Schematic Overview of Water-Glass Reaction 20


![WVUTh124 [NL B] (g.m -2 ) 100 10 1 0.](/docs-images/87/95267301/images/21-3.jpg "1 0.01 0 500 1000 1500 2000 2500 3000 3500 4000 4500 Time")
 100 90 HLWD119RW")

21 Zeolite-type aluminosilicate phases, identified as phillipsite Long-Term Glass Leaching Tests Thousands of tests, up to 39 years % Altered Glass (Nomalized Boron g/l) in PCT 90 C WVCM62 WVCM70 WVUTH122 WVUTh124 [NL B] (g.m -2 ) Time (days) 18 m m m m m m Time (Days) HLWD119RW WVUTH153 WVUTH %A.G Slow growth of a phyllosilicate (smectite-type identified as a nontronite) Time (days) 21

22 Example: Glasses Characterized to Support Hanford WTP LAW Operating Envelope 538 LAW glasses, designed, fabricated and characterized Combination of statistical and active design Multiple properties relating to product quality and processability Data set used to develop glass property-composition models for those properties 22
23 Example LAW Glass Property Models 23
24 HLW Glass Property Models PCT B, Li, Na TCLP Cd Spinel T 1% Melt viscosity Melt electrical conductivity Nepheline formation Model development supported by statisticallydesigned test matrices 24
25 Melter Technologies - Examples Hot wall induction melters La Hague, Sellafield, India (several) Cold wall induction melters ( cold crucible CCIM) Radon, Ulchin, La Hague Joule-heated ceramic melters (JHCM) PAMELA, WVDP, DWPF, WTP, Mayak, VEK, Rokkasho, Tokai, Lanzhou Others Plasma Microwave Cyclone combustion Submerged combustion In-can Stirred 25


26 Hot Wall Induction Melting 26


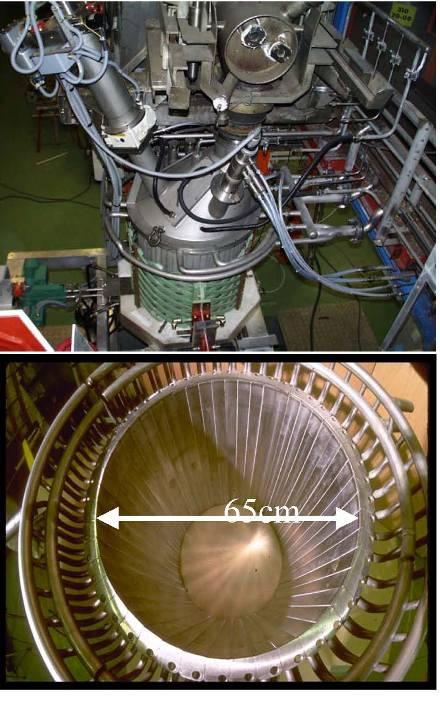
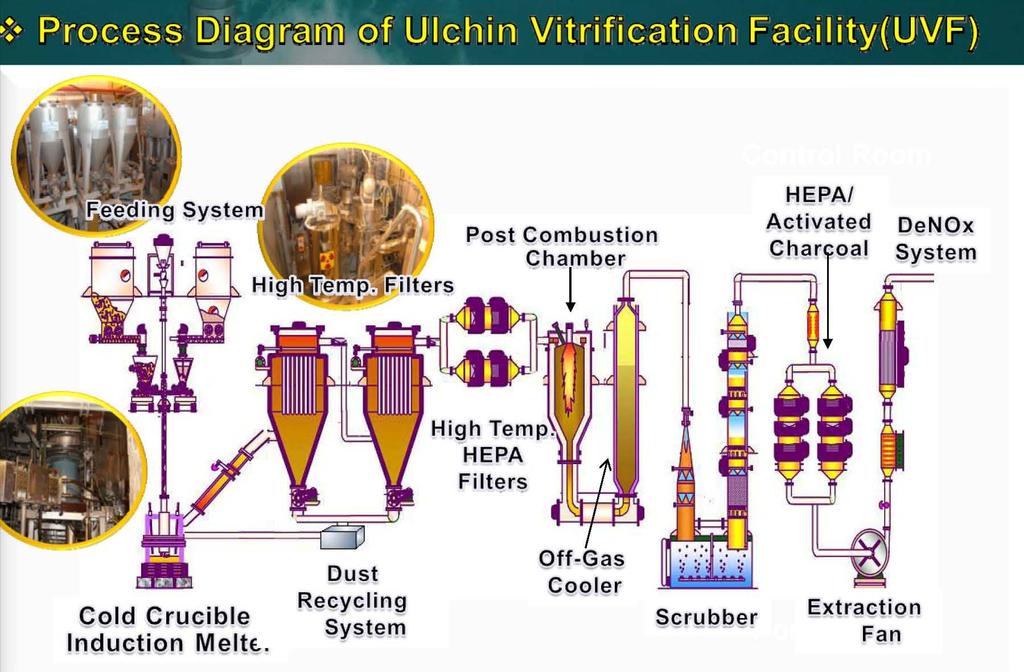
27 Cold Crucible Induction Melting Russian, Radon Korean, Ulchin French 27

28 DWPF and WTP HLW Melters 2.6 m 2 melt surface area Vacuum discharge Lid heaters Glass frit Bottom drain 3.75 m 2 melt surface area Air-lift discharge Bubblers Glass forming chemicals WTP has two HLW melters 28


29 Other JHCMs VEK PAMELA WVDP Rokkasho Tokai 29


 using VSL glass formulation Vitrification")
30 West Valley Demonstration Project Only US commercial reprocessing facility VSL Support Glass formulations developed at VSL Melter testing ~660,000 gal HLW containing 24 million curies converted to 275 canisters of glass (~550 MT) using VSL glass formulation Vitrification facility decommissioned 30

31 WVDP Vitrification Process 31


32 Defense Waste Processing Facility (DWPF) Facility has been operating on DOE site in South Carolina since Since 2009, VSL has been providing R&D support to enhance its performance to expedite completion of waste treatment ~Doubled melter throughput with retro-fit of bubblers 32

 Agitated JHCM (M-Area, WTP")
33 Melt Rate Enhancement Conventional JHCMs rely on natural convection in a viscous melt Melt rate is limited by heat and mass transport at the cold cap VSL developed active melt pool mixing using bubbler arrays Provides drastic increases in melt rates (up to 5X) Used successfully at SRS M-Area Incorporated into Hanford WTP LAW and HLW melters Retro-fitted into Savannah River DWPF melter Unagitated JHCM (West Valley, DWPF pre-2010) Agitated JHCM (M-Area, WTP LAW, WTP HLW) 33
34 DWPF Melter Off Gas Treatment System 34


35 The Hanford Waste Treatment Plant HLW Melter LAW Melter 35
 x 21-6 (W) x")

36 WTP LAW Melters LAW Production = 30 MT glass/day with ES-VSL bubbler technology Weight: 330 tons Exterior Dimensions: 29-6 (L) x 21-6 (W) x 15-9 (H) 10 m 2 glass pool surface area 7630 L molten glass pool Design production rate 15 MT glass/day each LAW Melter During Installation 36
37 Hanford WTP HLW Vitrification 37
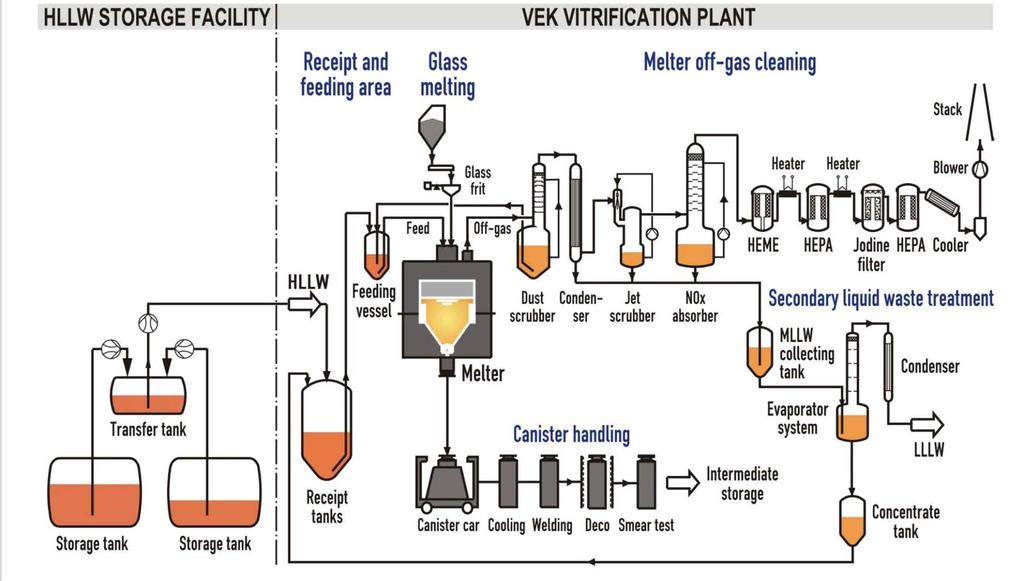
38 VEK 38
39 39


40 Foaming During Cooling of High Bi-P HLW Glass Melts Hanford WTP HLW Melter Risk of overflow of HLW glass during canister cooling 40


41 Foaming During Cooling of High Bi-P HLW Glass Melts Essential role of P & Cr but not Bi Stabilization of hexavalent Cr in phospho-chromate environments in the melt; auto-reduction to trivalent Cr on cooling as a result of its higher stability in spinels Results were used to modify glass formulations to mitigate melt foaming Confirmed in one-third scale DM1200 pilot melter tests 41
42 Effect of Form of Cr on Spinel Crystallization Cr tends to promote spinel formation e.g., Cr 2 O 3 + FeO Cr 2 FeO 4 Redox conditions determine Cr 3+ /Cr 6+ Form of Cr in the batch affects amount of crystallization in the glass product Approach to Phase Equilibrium 42
43 XANES Analysis of Cr Redox Approach to Redox Equilibrium 43

44 Effect of Form of Cr on Spinel Crystallization Melter Tests Cr-nitrate less Cr 3+ less spinel more Cr dissolved in glass Cr 3+ /Cr 6+ increases as oxygen diffuses away 2Cr 6+ O 3 Cr 2 O 3 + 3/2 O 2 Cr-oxide more Cr 3+ more spinel less Cr dissolved in glass Cr 3+ /Cr 6+ decreases as oxygen diffuses in Cr 2 O 3 + 3/2 O 2 2 Cr 6+ O 3 Very slow redox kinetics Results can be used to reduce crystallization during processing of high-cr HLW streams and thereby increase waste loadings Test 4 with Cr2O3 Test 3 with Cr(NO3)3 and optimized bubbling Test 2 with Cr(NO3)3 Feed Sample Discharge Glass Melt Pool Sample Test 1 with NaNO3 Previous test with Cr2O3 [1] Volume % Crystalline Phases 44


 Bi 0 (separate molten metal) Inconel 690")
45 Reduction of Bi 2 O 3 and Inconel 690 Metal Corrosion Effect of redox on high-bi HW glasses Inconel 690 alloy (Ni-Cr-Fe) corrosion in Bi-rich HLW glasses CO+CO o C On set of molten Bi drops (Fe 2+ % ~30%) Bi rich HLW Glass Bi 2 O 3 =6.7 wt% Fe 2 O 3 = 7 wt% NiO = 1.9 wt% P 2 O 5 = 5 wt% Bi 3+ (homogeneous molten glass) Bi 0 (separate molten metal) Inconel 690 Alloy Ni =58 wt% Cr = wt% Fe = 7 11 wt% 45


46 Reduction of Bi 2 O 3 and Inconel 690 Metal Corrosion Inconel 690 Corrosion in Bi-rich and Bi-free HLW melts at 1150 o C and atm O 2 Inconel 690 Corrosion in Bi-rich HLW melts at 1150 o C and , 10-4 atm O 2, and ambient air Test metal coupon: 0.15x0.3x1 inch with S/V=0.15cm -1 for 7 days under controlled atmosphere 6.7wt% Bi 2 O atm O 2 Bismuth Bi free 6.7 wt % Bi 2 O 3 Redox atm O 10 4 atm O 2 2 Ni dissolves in Bi Inconel 690 Corrosion in Bi rich HLW Glass Bi + reduction Ni/Bi alloying Catastrophic failure of Ni Cr alloy at 1150 o C 46