A Brief History of XRD 1895: Röntgen discovers X-Rays received the first Nobel prize in physics in 1901
|
|
|
- Shanon Melton
- 5 years ago
- Views:
Transcription
1 X-ray Diffraction


, now International Center for Diffraction")
2 A Brief History of XRD 1895: Röntgen discovers X-Rays received the first Nobel prize in physics in : Laue diffracts X-Rays from single crystal 1914 Nobel prize in Physics 1912: Bragg analyzes crystal structures 1915 Nobel prize in physics 1917: Ewald develops dynamical theory of X-Ray diffraction 1918: Scherrer uses X-Rays to determine crystallite size of nanocrystalline gold 1935: X-Ray powder diffractometer developed by Le Galley 1947: First commercial powder diffractometer 1969: Establishment of the Joint Committee on Powder Diffraction Standards (JCPDS), now International Center for Diffraction Data (ICDD)
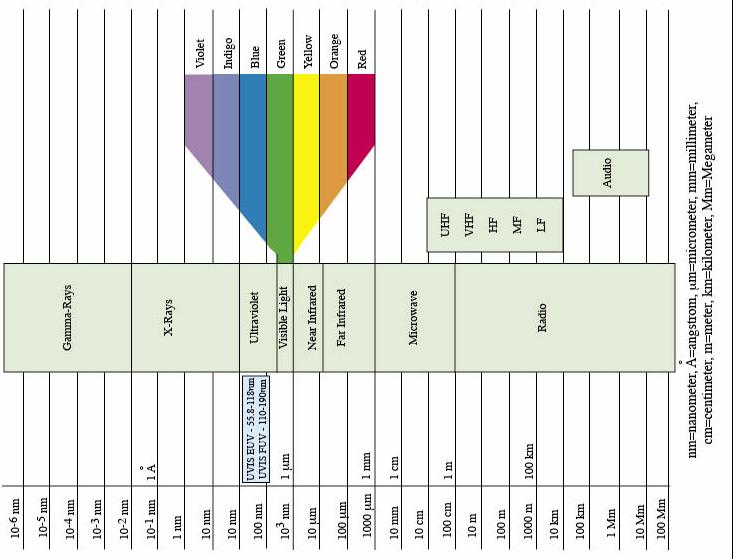
3 Electromagnetic Spectrum
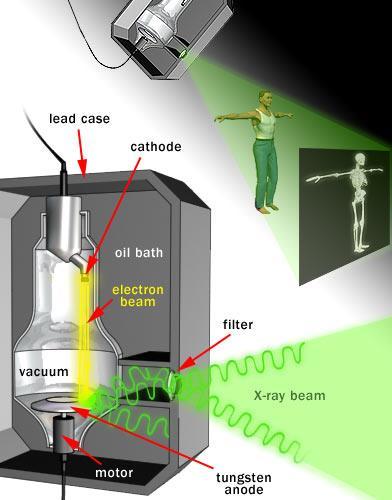
4 Generation of X-rays
5 X-ray Spectrum from an Iron target Short Wavelength Limit Continuous spectrum I CS SWL (nm) AiZV m V Characteristic X-ray Moseley s Law C( Z ) I Bi( V ) K V k n λ SWL
6 Scattering fundamentals Scattering can be broadly defined as the redirection of radiation out of the original direction of propagation, usually due to interactions with molecules and particles Reflection, refraction, diffraction etc. are actually all just forms of scattering Matter is composed of discrete electrical charges (atoms and molecules dipoles) Light is an oscillating EM field excites charges, which radiate EM waves These radiated EM waves are scattered waves, excited by a source external to the scatterer The superposition of incident and scattered EM waves is what is observed
 Forward")
7 Scattering geometry Backward scattering (backscattering) Forward scattering
8 Types of scattering Elastic scattering the wavelength (frequency) of the scattered light is the same as the incident light (Rayleigh and Mie scattering) Inelastic scattering the emitted radiation has a wavelength different from that of the incident radiation (Raman scattering, fluorescence) Quasi-elastic scattering the wavelength (frequency) of the scattered light shifts (e.g., in moving matter due to Doppler effects)


9 How Diffraction occurs Diffraction occurs when objects in a periodic array scatter radiation coherently, producing constructive interference at specific angles X-Rays can diffract from a periodic array of elastic scatterers, such as atoms in a crystal
10 Diffraction of light through an aperture a Intensity
11 Intensity Minima Maxima sinθ λ n a n = 0, 1,.. sin 2n 1 2a n = 1, 2,..
12 Young s Double slit experiment d sinθ = mλ, m = 1,2,3.. Constructive Interference d sinθ = (m+½)λ, m = 1,2,3.. Destructive Interference


13 Interference Phase Difference = 0 Phase Difference = 90 Phase Difference = 180
14 Elastic Scattering When x-rays or electrons interact with matter, the dominant effect is scattering. Considering x-rays and electrons as waves we deal with elastic scattering (rather than as particles, where we deal with inelastic scattering) For elastic scattering, x-rays and electrons are scattered with no loss of energy, and give rise to scattered radiation of the same wavelength
15 Constructive Interference The distance between atoms (d hkl ) are on the same order of size as the wavelength of an x-ray (Cu Ka =1.54Å) Interference phenomena is concentrated in directions related to the crystal lattice The intensity of the diffracted x-rays gives rise to peaks for each set of wave vectors which make up diffraction patterns The positions of the atoms in the material (the crystal lattice of the solid) and the wavelength of the x-rays determine the positions and intensities of the diffracted peaks. Another kind of scattering, incoherent (Compton), is easiest understood in terms of the particle nature of photons: the photon deviates from path and electron takes part of its energy. The scattered photon has lost energy (so has a longer wavelength), and there is no relationship between the phases of the two waves. There is no interference and of little significance here (though it is for XRF) and we will not consider it further.
16 Conditions Required for X-Ray Diffraction Bragg s law - a model to describe the position of observed diffraction peaks 2d sin hkl Constructive interference only occurs when Bragg s law is satisfied for parallel planes of atoms, with a space d hkl between them Each plane of atoms produces a diffraction peak at a specific angle Wavelengths of the excited filament material should be similar in dimension with the interplanar spacing d (most common emission being copper K α Å)
17 Conditions Required for X-Ray Diffraction Miller indices (hkl) define a series of parallel planes in a crystal with interplanar spacing d The interplanar distance is dependent on the Miller indices. When combined with Bragg s law: This equation helps us determine the Miller indices of crystal planes that diffract x-rays For example: {001} is the planar index for (h 2 +k 2 +l 2 )=1 Or {110} is the planar index for (h 2 +k 2 +l 2 )=2 This calculation is not practical because Miller indices for the diffracting planes and the diffraction angles for a known wavelength are presented for all crystalline materials by the International Center for Diffraction Data (ICDD)
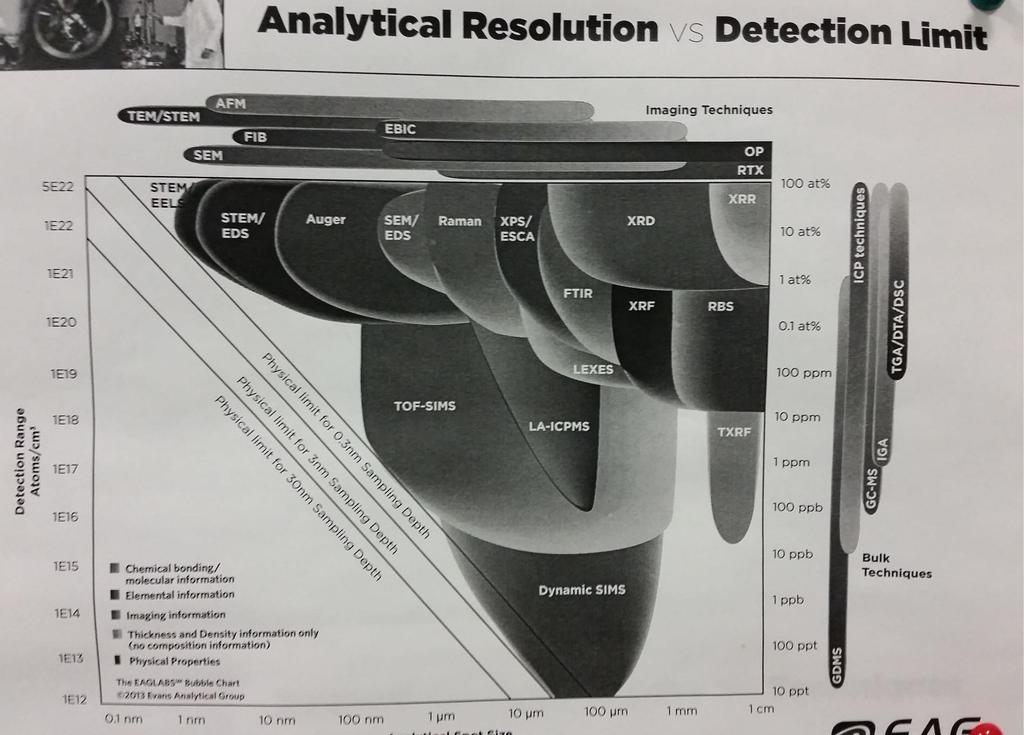
18 Diffraction Data is Essential
19 Conditions Required for X-Ray Diffraction Not all diffracted lights from crystal planes that satisfy Bragg s law are detectable. Detection of the diffracted light depends on its intensity X-ray diffraction in a crystal happens in all direction from all atoms within the crystal that satisfy the Bragg s law All these atoms contribute to the intensity of the diffracted light An X-ray can be scattered by an electron in all directions in space The intensity of the scattered light is a function of the angle (2θ) between the incident photon and the scattered: I o is the intensity of the incident photon r is the distance between the electron and the detector K is a constant depending on the properties of the atom The mathematical term represents the effect of the scattering angle on intensity Polarization factor
20 Conditions Required for X-Ray Diffraction Total intensity of the scattered (diffracted) X-rays from an atom at a specific scattering angle is less than the theoretical intensity of X-rays generated by the electrons The reason is absorption (fluorescence) of some of the diffracted X-rays by electrons at suitable positions around the atom Scattered X-rays follow different paths with different path lengths for each diffraction angle Atomic scattering factor determines the intensity of the diffracted X-rays as f= Number of X-rays scattered from an atom/ Number of X-rays scattered from all electrons in the atom
21 Structural photon absorption
22 Conditions Required for X-Ray Diffraction Structural absorption of diffracted X-ray intensity is determined from the Structural factor (F) It is independent of the shape (cubic, hexagonal, etc) or size of the crystal structure In a unit cell within the (hkl) plane and consisting of N atoms, the position of the nth atom is defined as u n, v n, w n Structural factor can be calculated if the atomic scattering factor f n is known
23 Conditions Required for X-Ray Diffraction Structural absorption of diffracted X-ray intensity is determined from the Structural factor (F) For a plane within a body centered cubic crystal, the structural factor in the (001) and (002) planes are found as: Simple crystal structures like BCC, FCC, SC have the same structural factors in general
24 Structure Factor N 2 i( hun kvn lwn) Fhkl fne Intensity of the diffracted beam F 2 1 h,k,l : indices of the diffraction plane under consideration u,v,w : co-ordinates of the atoms in the lattice N : number of atoms f n : scattering factor of a particular type of atom Bravais Lattice Reflections possibly present Reflections absent Simple All None Body Centered (h+k+l): Even (h+k+l): Odd Face Centered h, k, and l unmixed i.e. all odd or all even h, k, and l: mixed
25 Systematic Absences Permitted Reflections Simple Cubic (100), (110), (111), (200), (210), (211), (220), (300), (221) BCC FCC (110), (200), (211), (220), (310), (222). (111), (200), (220), (311)..
26 The result of structural absorption
27 Diffraction Instrument Modern powder diffractometers typically use the Bragg-Brentano parafocusing geometry The incident angle between the X-Ray source and the sample is w The diffraction angle, between the incident beam and the detector angle, is 2 The Bragg-Brentano geometry constrains w to be always ½ of the detector angle 2 Two main diffractometer models: The tube is fixed, sample and detector rotate The sample is fixed, tube and detector rotate X-ray tube Detector w 2
28 Two Circle Diffractometer For polycrystalline Materials
29 Four Circle Diffractometer For single crystals
30 Geometry and Configuration Theta-Theta Theta-2Theta Source and detector move θ, sample fixed Sample moves θ and detector 2θ, source fixed Incident Beam Part Diffracted Beam Part Source Incident Beam Optics Sample Diffracted Beam Optics Detector
31 Filter to remove K β For eg. Ni filter for Cu K β Reduction in intensity of K α Choice of proper thickness
 To alter beam")
 Narrow slits = Lower")
32 Slits to limit the size of beam (Divergence slits) To alter beam profile (Soller slit angular divergence ) Narrow slits = Lower intensity + Narrow peak
33 Mirror Parallel beam Soller slit Source Detector Sample Mirror Para-focusing Source Detector Sample Detector Point focus Source Sample
34 Comparison Parallel beam X-rays are aligned Lower intensity for bulk samples Higher intensity for small samples Instrumental broadening independent of orientation of diffraction vector with specimen normal Suitable for GI-XRD Texture, stress Para-focusing X-rays are diverging Higher intensity Lower intensity Instrumental broadening dependent of orientation of diffraction vector with specimen normal Suitable for Bragg-Brentano Powder diffraction

35 Diffraction Methods 1. Laue method: a single crystal is held stationary in a beam of monochromatic x-ray radiation. The crystal diffracts the discrete values of l for which {hkl} planes exist of spacing d hkl and incidence angle θ. Used to determine symmetry of a crystal. 2. Rotating-crystal method: a single crystal is rotated about a fixed axis in a beam of monchromatic x-rays. The variation in θ brings different atomic planes into position for reflection. 3. Powder (Debye-Scherrer-Hull) method: a finely powdered sample is placed in a holder in a monochromatic x-ray beam, with the angle θ gradually changing due synchronous movement of holder and detector. Assuming random orientation of the tiny crystallites, there will be diffraction off of different {hkl} planes at specific angles.
36 Diffraction Methods Method Wavelength Angle Specimen Laue Variable Fixed Single Crystal Rotating Crystal Fixed Variable (in part) Single Crystal Powder Fixed Variable Powder


37 Laue Method Transmission Zone axis Reflection Zone axis crystal crystal Incident beam Film Incident beam Film Uses Single crystal Uses White Radiation Used for determining crystal orientation and quality


38 Rotating Crystal Method Used for determination of unknown crystal structures

39 Powder Method Incident Beam Sample Film Useful for determining lattice parameters with high precision and for identification of phases
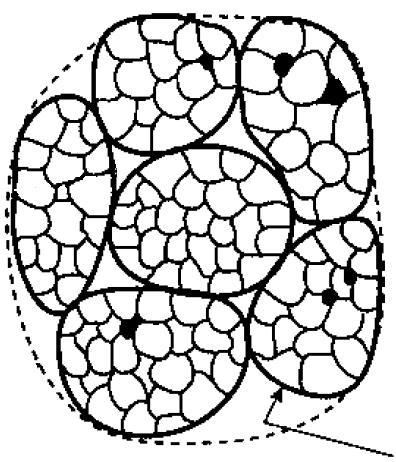
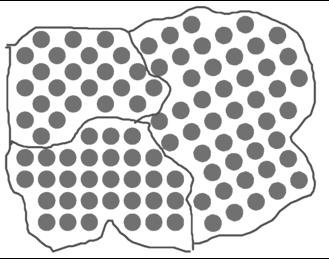
40 What does a powder really mean? Single Oriented Random

41 Limited crystals vs. many crystals
42 X-Ray Powder Diffraction Each crystallite in the powder is a small single crystal with a random orientation There is roughly equal statistically relevant number of crystallites for every set of randomly oriented planes that will diffract the incident beam Samples can be powder, sintered pellets, coatings on substrates, engine block The resultant XRD pattern is a unique fingerprint of the polycrystalline material which contains a lot of information The position, intensity, width, and shape of the observed diffraction peaks tells us about the crystal structure and, in some cases, microstructure of the sample
43
44 Diffraction from a variety of materials (From Elements of X-ray Diffraction, B.D. Cullity, Addison Wesley)
45 What can be done with XRD? Identify phase composition Measure unit cell lattice parameters Estimate crystallite size, microstrain Measure residual stress Measure texture and/or epitaxy Evaluate thin film quality Measure multilayer thin film thickness, roughness, and density Determine orientation of single crystals Solve or refine crystal structures Analyze ordered meso- and nanostructures


46 Diffraction Pattern Diffraction peak positions and intensity contain information about the crystal structure of a material Each diffraction peak is produced by a family of atomic planes. The position of the diffraction peak indicates the length d hkl between those atomic planes this ultimately correlates to the bond distances between atoms The intensity of the diffraction peak is determined by what atoms are present on the diffracting plane, their scattering factors, and the structure factor Intensity (a.u.) (200) (220) (111) (deg.) XRD pattern of NaCl
47 Diffraction of a Single Crystal A single crystal in a Bragg-Brentano diffractometer produces one family of peaks in the diffraction pattern 2
48 Diffraction of a Polycrystalline Sample A polycrystalline sample contains thousands of crystallites All diffraction peaks should be observed There will be a small percentage of crystallites that are properly oriented to diffract for every set of planes 2 2 2
49 Diffraction Peaks The absolute peak intensity is measured as photons counted or count rate The absolute intensity can vary due to instrumental and experimental parameters When normalized to the most intense peak, relative intensities are obtained which should be instrument independent Peak areas are much more reliable than peak heights as a measure of intensity The intensity of diffracted photon tells us about the atoms that are on those planes
50 Stick pattern from JCPDS
 Bulk electrodeposited nanocrystalline")
51 Actual Pattern Lattice parameter, phase diagrams Texture, Strain (micro and residual) Size, microstructure (twins and dislocations) Bulk electrodeposited nanocrystalline nickel
52 Intensity(Counts) (deg.) Qualitative Phase Identification Mostly used for analysis of processes and quality control When You found something in the laboratory and want to know what it is or You tried to synthesize a material and want to know if you really did or You want to check if your raw materials are pure Example: You have some monoclinic Y 2 O 3 in the lab for a long time and want to see if it degraded in time > cubic Y 2 O > monoclinic Y 2 O 3
53 (deg.) Qualitative Phase Identification can be used to study reactions ex situ Comparing and identifying the XRD patterns of a material before and after a phase changing reaction Example: You heated the monoclinic Y 2 O 3 to 1000 C and want to see the level of degradation Heat treatment converted all of the monoclinic Y 2 O 3 into cubic Y 2 O 3 original, as-made after annealing Intensity(Counts)
54 Qualitative Phase Identification can also be used to study reactions in situ A phase changing reaction such as heat treatment is monitored directly by the attached X-Ray diffractometer Example: You heat the monoclinic Y 2 O 3 to 1000 C and want to see the rate of degradation original, as-made after annealing Intensity(Counts) (deg.) time
55 Intensity(Counts) Qualitative Phase Identification can also be used to discern between isostructural compounds and polymorphs Differences in electron density can be mapped because X-Rays scatter proportionally to Z 2 Example: the cubic phases of CaTiO 3 and SrTiO 3 have identical crystal structures, with the cation replaced by Ca or Sr respectively CaTiO3 cubic perovskite SrTiO3 cubic perovskite (deg.)
56 Intensity (a.u.) Analysis of Single Phase 2 ( ) d (Å) (I/I 1 )* I 1 : Intensity of the strongest peak
57 Procedure Note first three strongest peaks at d 1, d 2, and d 3 In the present case: d 1 : 2.82; d 2 : 1.99 and d 3 : 1.63 Å Search JCPDS manual to find the d group belonging to the strongest line: between Å There are 17 substances with approximately similar d 2 but only 4 have d 1 : 2.82 Å Out of these, only NaCl has d 3 : 1.63 Å It is NaCl Specimen and Intensities Substance File Number x (ErSe) 2 Q x NaCl x (NH 4 ) 2 WO 2 Cl x (BePd)2C Caution: It could be much more tricky if the sample is oriented or textured or your goniometer is not calibrated
58 Presence of Multiple phases More Complex Several permutations combinations possible e.g. d 1 ; d 2 ; and d 3, the first three strongest lines show several alternatives Then take any of the two lines together and match It turns out that 1 st and 3 rd strongest lies belong to Cu and then all other peaks for Cu can be separated out Pattern for Cu d (Å) I/I d (Å) I/I * * * * * * *
59 Presence of Multiple phases Now separate the remaining lines and normalize the intensities Look for first three lines and it turns out that the phase is Cu 2 O If more phases, harder to solve Pattern of Cu 2 O d (Å) I/I d (Å) Remaining Lines Observed I/I 1 Normalized
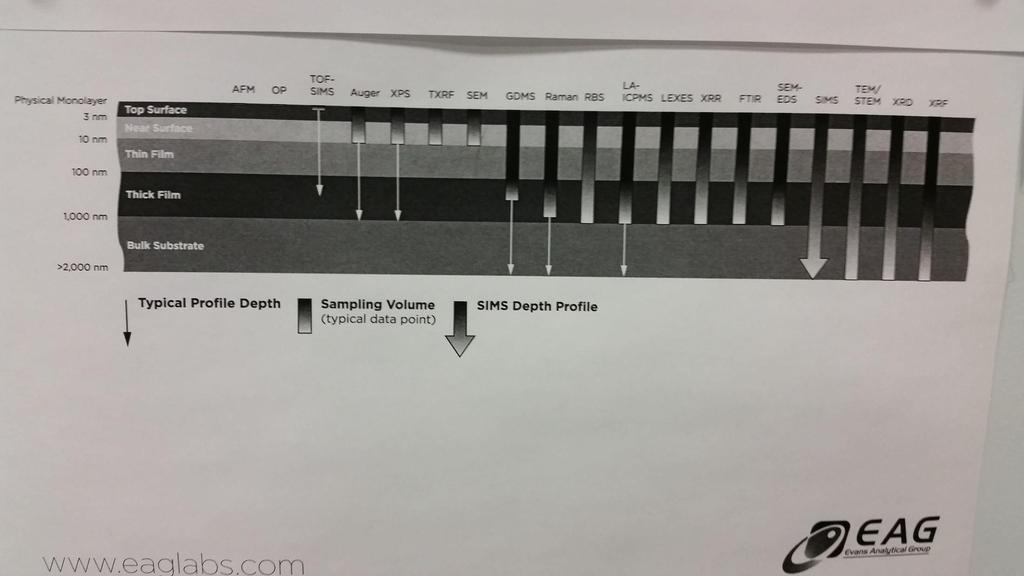
60 Diffraction Data is Essential
 Quantitative Phase Identification In depth analysis for precise monitoring of phase composition When You know which phases are present and want to know how much Example: You mix certain powders to")
61 (deg.) Quantitative Phase Identification In depth analysis for precise monitoring of phase composition When You know which phases are present and want to know how much Example: You mix certain powders to make a red paint pigment then wonder how much of each is present Red Paint Pigment Mixture Intensity(Counts) 28 wt% Hematite, Fe 2 O 3 21 wt% Anatase, TiO 2 51 wt% Rutile, TiO 2
62 Relative Intensity Approach The ratio of peak intensities varies linearly with the ratio of weight fractions I I K is determined from the mass absorption coeffcicients of all phases in the sample Not the most accurate and reliable way K X X Simplification of the ratio of the general intensity equation Constant for an experimental setup Structure factor Absorption factor Multiplicity factor Lorentz polarization factor
63 Relative Intensity Approach K can be determined : by using published relative intensity values (I/Ic) External Standard Method empirically, by building calibration curves Internal Standard Method by simulating the diffraction pattern: whole pattern refinement Reitveld Analysis To equate the concentration of a given phase with the intensity of the peaks in the multiphase pattern, a single peak, least precision a number of peaks, considerable precision all of the peaks ultimate precision (Reitveld analysis) can be utilized The shape of the peaks is decisive in choosing the intensity measurement method When the diffraction peak is sharp and non-overlapped, peak height is taken as the representative value as it is considered proportional to the peak area Background corrected integrated intensities are measured by subtracting the background intensity from the peak height
64 a) Peak height is proportional to peak area. Peak height is measured b) Peak height not proportional to peak area. Combined intensity is calculated c) Peak area is overlapped by other peaks This is a common case. Peak profiles should be adjusted
65 External Standard Method The complexity of the analysis of multiple phases in a mixture is greatly reduced by referring all of the pure phase peak intensities to a single standard P I RIR P I s s where I a is the intensity of the 100% peak of phase α, and I s is the intensity of the 100% peak of a reference phase s, taken by convention to be α-al 2 O 3, corundum, in a 50:50 mixture by weight W a W s = 1, so Generalized External Standard Equation The use of RIR values is much faster and less prone to error than the determination of all of the weight fractions from the starting equation which would require reference to the integrated intensities of the 100% peak of each phase in its pure form
66 Internal Standard Method The proportionality constant K is determinded empirically by building calibration curves from mixtures containing known quantities of internal standard I I K X X MgSiO3:Al2O3 YSZ:Al2O3 K X (Al2O3) Example Three component mixture consisting of predetermined concentrations of MgSiO 3, YSZ, Al 3 O 2 Sample MgSiO 3 wt% YSZ wt% Al 3 O 2 wt%
67 Determining Crystallinity using Standard Additions Adding a predetermined amount of well crystallized standard to a sample containing amorphous phases Calculate the observed amount of all phases using any of the quantitative analysis methods, ignoring the amorphous content Apply a normalization to all calculated amounts based on the initial standard amount Example Fe, Fe 2 O 3 mixture with 17% Si standard the discrepancy due to the amorphous content Intensity(Counts) 22.2wt% Si 73.5wt% Fe 2 O 3 4.3wt% Fe Sample the discrepancy Fe due Fe to the amorphous content 2 O 3 Si Amorphous wt% wt% wt% Calculated Actual (deg.)
68 Determining Crystallinity without Standard Additions If the mass absorption coefficient of an amorphous phase is the same as the crystalline content, the ratio of intensities can be used to determine % crystallinity Area Crystalline Peaks: cts Area Amorphous Hump: cts % Crystalline: 46.5% % Amorphous: 53.5% Intensity(Counts) (deg.)
69 Reitveld Refinement Rietveld realised that the detailed profile of a powder-diffraction pattern contained a lot more information than the extracted intensities of composite peaks and stated that "The method of using the total integrated intensities of the separate groups of overlapping peaks in the least-squares refinement of structures, leads to the loss of all the information contained in the often detailed profile of these composite peaks. By the use of these profile intensities instead of the integrated quantities in the refinement procedure, however, this difficulty is overcome and it allows the extraction of the maximum amount of information contained in the powder diagram." H. M. Rietveld

70 Reitveld Refinement Reitveld found that the detailed profile could be fitted on a point by point basis using the simple Gaussian peak-shape function without any need to extract intensities of composite groups of reflections Refinement implies taking an approximate model of the structure and converting it so that diffraction data calculated from the model structure has a closer resemblance to the measured data Many complex computer algorythms operating on the basis of using a least-squares procedure to refine the initial structure model in order to improve the agreement between the observed diffraction data and that calculated from the model In other words Reitveld refinement is a broad numerical technique used to make the XRD pattern as true and error-free as possible
71 Intensity(Counts) Lattice Parameter Determination Changes in the interplanar spacing of a material such as substitution of an atom can be detected by XRD The position of the diffraction peaks are a product of the space between planes of atoms The change in peak intensity due to substitution of atoms with similar Z is subtle, however peak angles which indicate the interplanar space change Example Substitution of Zr in YSZ with Y 10% Y in ZrO 2 50% Y in ZrO (deg.)
72 Crystallite Size Broadening Ideally a peak in the Bragg diffraction pattern is a line without a width. In reality the peaks have some width that originate from the instrument and the size of the crystals
73 Crystallite Size Broadening A diffraction peak is produced by a plane with B that satisfies Bragg s law However X-ray beam in parafocusing geometry is not perfectly parallel and is diffracted at angles between 1 and 2. So X-rays scattered at angles between 1 and 2 do not interfere with each other perfectly constructive or destructively In this case X-rays scattered from plane 0 and 1 have angles 1 that correspond to Bragg s number n less than an integer These X-rays will interfere with X-rays scattered from plane m that scatters rays with an angle that correspond to n/2 (out of phase - destructive interference) For very fine crystals the plane m is not present so that X-rays diffracted at 1 will be detected as peak broadening
74 Kristal Boyutu Peak genişliği ile kristal boyutu ters orantılıdır. Peak genişliği (B) arttıkça kristal boyutu küçülür. Krital Boyut hesabı (t) :
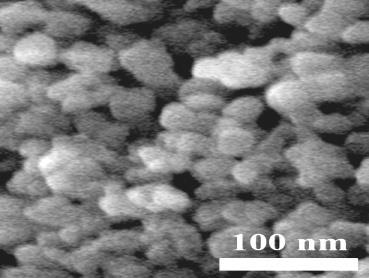
75 Crystallite Size Broadening No crystal is perfect due to its finite size The deviation from perfect crystallinity leads to a broadening of the diffraction peaks which is negligible above a certain size (~0.1-1 micron) Peak broadening occurs for powder samples with crystallites around 100 nm in diameter L B K 2 cos K= Sherrer Equation for samples with fine crysrallites Peak width is measured at the half of the maximum peak intensity (FWHM) Various methods to determine the crystallite size of an unknown fine powder mixed with a coarse standard powder B 2 = B U 2 BS 2 Warren s equation the simplest form
76 Crystallite Size Broadening Example - Sherrer analysis of the main peak for a heat treated polycrystalline La 2 Zr 2 O 7 to estimate the crystallite size Calcined at 900 C for 1 hr: ~10 nm average crystallite size Sintered at 1000 C for 96 hrs: ~30-40 nm average size Sintered at 1500 C for 2 hrs: >100 nm average crystallite size Figure adapted from ``Ion Transport Membranes for H 2 Separation:Y-doping of La 2 Zr 2 O 7`` by Carneim et al.
77 Factors That Contribute to Crystallite Size Broadening Instrumental Broadening Crystallite Size Microstrain Faulting Dislocations Antiphase Domain Boundaries Grain Surface Relaxation Solid Solution Inhomogeneity Temperature Factors Non ideal optics Wavelength Dispersion Sample Transparency Axial Divergence Flat Sample Effect Detector resolution The peak profile is a combination of the profiles from all of these contributions Peak broadening analysis is most accurate when the broadening due to crystallite size effects is at least twice the contribution due to instrumental broadening

78 Microstrain Determination Inhomogeneous strain is the second main source of specimen broadening a compressive stress would make the d spacings smaller and a tensile stress would make the d spacings larger which would cause only peak shifting if the strain is inhomogeneous then different crystallites will be strained by different amounts and the shifts in 2θ will be variable resulting in peak broadening B(s) = C tanθ, C=4-5
79 Microstrains
80 Seperating the size and microstrain contributions to peak broadening Williamson and Hall simplified the contributions of size and strain to a basic sum or sum of squares B 2 K L cos B B(s) = C tanθ K L cos total B 2 B s C tan B K L total cos C sin By plotting a Williamson-Hall graph, where B(total)cosθ and sinθ are the axes, the strain component is obtained from the slope (C) and the size component from (L) the intercept
81 Seperating the size and microstrain contributions to peak broadening Williamson-Hall method lacks precision due to its simplifications but it can be a useful method if used to observe trends in the relative sense. Example - a study of many powder patterns of the same chemical compound, but synthesized under different conditions
82 Thin Film Specimen Grazing angle (very small, ~1-5 ) B Film or Coating B Substrate Smaller volume i.e. less intensity of the scattered beam from the film Grazing angle Useful only for polycrystalline specimens
83
84
85 Data collection and analysis procedure Choose 2θ range Step size and time per step Hardware: slit size, filter, sample alignment Fast scan followed with a slower scan Look for fluorescence Collected data: Background subtraction, K α2 stripping Normalize data for comparison I/I max
86 Thank you for your interest! The following sources provide more information on X-Ray Diffraction: Elements of X-Ray Diffraction (The Bible) by B. D. Cullity Fundamentals of Powder Diffraction and Structural Characterization of Materials by V. K. Pecharsky et al. Principles and Applications of Powder Diffraction by A. Clearfield et al.