UNIVERSITY OF OSLO. Faculty of Mathematics and Natural Sciences
|
|
|
- Gordon Johns
- 5 years ago
- Views:
Transcription
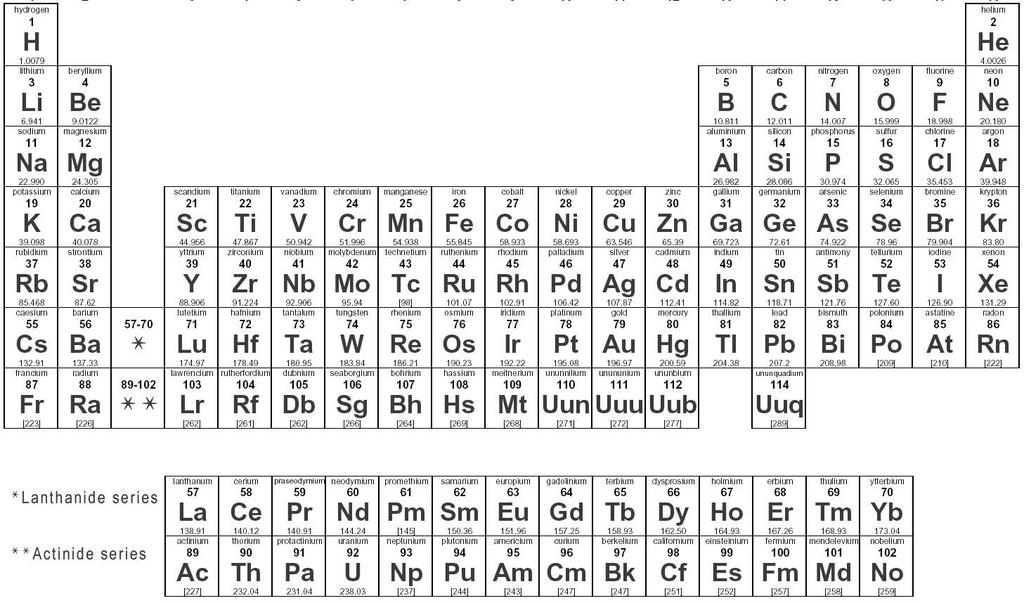
1 Page 1 UNIVERSITY OF OSLO Faculty of Mathematics and Natural Sciences Exam in MENA3100 Characterization of materials Day of exam: 12th. June 2015 Exam hours: 14:30 This examination paper consists of 5 pages. Appendices: The periodic table Permitted materials: Approved calculator, ruler Make sure that your copy of this examination paper is complete before answering. 1 a) Make a drawing of the path of light from object to image for a single convex lens with focal length f = 5 cm and where the distance between lens and object is 11 cm. What is the ratio between the size of the image of the object and the object? b) Make a drawing of the electron ray diagram in a TEM after the sample. Start with three parallel electron ray paths that hit the sample and show what happens after that. Put name on apertures and lense(s). For what purpose are the apertures used? c) Bragg's law, 2dsin = n, gives the angle for constructive interference for a given wave length and plane distance. Derive Bragg's law. Discuss whether your way of deriving Bragg's law can explain why the diffraction peaks are sharp. 2 We have grown crystals of Mg 2Sn in molten aluminium. After cooling to room temperature, the sample was grinded flat, polished and viewed with a scanning electron microscope. a) What kind of signal is used to make the electron microscopy image in figure 1? Justify your answer. b) Why is it important that the sample is flat (have a planar surface) when one do kvantitaive analysing with EDS? c) Analysis with EDS of the big, bright areas in the picture gives 67 atomic % Mg and 33 atomic % Sn. The small, bright areas shows that the bright phase contain several atomic % aluminium in addition to magnesium and tin. The ratio Mg:Sn is still 2:1. When this is controlled with EDS analysis in TEM, one finds no content of Al. Discuss possible causes for the different results.

2 d) When the dark phase is analysed one obtain an oxygen content of 0.4 atomic % when 15 kv is used as accelerating voltage, but 3 % when 5 kv was used. Discuss possible reasons for this. Figure 1: Image obtained with SEM chowing crystals of different size of Mg 2Sn in aluminium. 3 The structure facturen for a (hkl)-plane can be calculated using the expression: F hkl = a) What does the symbols N, f n, u n, v n og w n stand for and what is the significance of F hkl = 0 and F hkl 0? b) In the diffraction pattern in figure 2 I) two of the reflexes have been indexed. What is the zone axis? Is aluminium simple (primitive) cubic, body sentered or face centred? Justify your answer. c) What is scattering the X-rays in XRD and what is scattering the electrons in electron diffraction? Figure 3 shows the atomic scattering factor for aluminium for electron diffraction. In what way will the curve change if it has been for XRD? d) Calculate the intensity for the two reflexes in figure 2 I) with the use of the formula for the structure factor and the atomic scattering factor in figure 3. The d values for the two planes are d 200 = Å and d 220= Å. (The wave length of electron accelerated with 200 kv is 2.5 pm.) e) Put indexes on the diffraction pattern in figure 2 II). What is the zone axis?
3 Figure 2: Diffraction patterns obtained with parallel beam in a TEM. The pictures are from aluminium, that is cubic, in two different projections. Figure 3: Atomic scattering factor (scattering amplitude)) for aluminium for the scattering of electrons.
 Figure 5 shows a simulated diffractogram obtained using CuK 1 radiation ( = 1.540598 Å), 2 values are given in table 1. The lattice constant a = 6.771 Å.")
4 Figure 4: The unit cell for the cubic phase Mg 2Sn, the small atoms are tin. 4 a) What kind of cubic Bravais lattice do Mg 2Sn have? b) Figure 5 shows a simulated diffractogram obtained using CuK 1 radiation ( = Å), 2 values are given in table 1. The lattice constant a = Å. For cubic system we have d = a (h 2 + k 2 +l 2 ) -1/2. Find the indexes (hkl) for the peaks at 2 = 22.74, and c) When the simulated diffractogram is compared with an experimental diffracogram, one often find that the peaks at 2 = 22.74, and are much higher (compared to the other peaks) in the experimental diffractogram. (Both done with Bragg-Brentano geometry.) Discuss what could be the reason behind the higher intensities being observed. d) Discuss in which ways powder X-ray diffraction are different from diffraction from a single crystal obtained with parallel radiation in a TEM. Figure 5: Simulated powder diffractogram for Mg 2Sn.
5 Table 1: 2 and relative intensities for the peaks in the diffractogram in figure 5. 2 Intensities
6