Road Aggregates Characterization
|
|
|
- Melvin Blair
- 5 years ago
- Views:
Transcription


1 AF2903 Highway Construction and Maintenance Royal Institute of Technology, Stockholm Road Aggregates Characterization Tatek Fekadu Yideti PhD Student in Highway and Railway Engineering Department of Transport Science Do you know about? 1


2 Aggregates Aggregate is the major component of all materials used in road construction Aggregates is a broad category of coarse particulate material used in construction include sand, gravel, crushed stone, slag, recycled concrete and geosynthetic aggregates components of composite materials such as concrete and asphalt concrete serves as reinforcement to add strength to the overall composite material are widely used in drainage applications such as foundation drains, retaining wall drains, and road side edge drains are also used as base material under foundations, roads 2
3 Where do we use Aggregates in Highway Engineering? Asphalt wearing course, base course high fracture resistance good interlocking hardness surface friction light reflective Base Material good fracture resistance good interlocking drainage Sub-Base Material medium fracture resistance good interlocking drainage Where do Aggregates come from? 3
4 Classification 1. Igneous rocks Origin :- Natural aggregates Grain size Coarse grained Medium grained Fine grained Composition Acidic > 66% of silica. Intermediate 55 to 66% silica. Basic < 55% silica. 2. Sedimentary rocks Calcareous Chalk, Lime stone Siliceous Sandstone Flint, chert Argillaceous Clay, shell etc. Classification 3. Metamorphic rocks Artificial aggregate - by product of industrial processes eg. Blast furnace slag 4
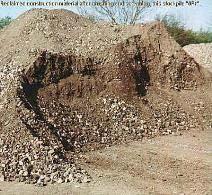
5 Sources of Aggregates Gravel Rock quarry On site material Gravel pit Mines Slag from ore processing Sand and Filler Rock quarry On site material Sand pit Dredging (river and salt water) Processes mine material Rock Quarry 5


6 Gravel Pit On Land Dredging 6
 Screens")
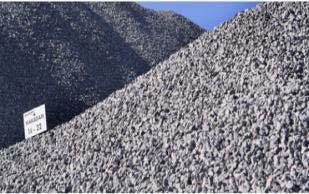
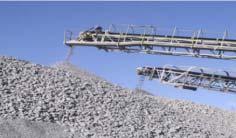
7 Marine Dredging Aggregate Production at Quarries Blasting of bedrock Primary crushing stage Jaw crusher Secondary crushing stage Gyratory or cone crusher Screen Tertiary crushing stage Cone crusher Impact crusher (VSI) Screens 7


8 Blasting Crushing 8

9 Source Aggregate Characterization Gradation Toughness and Abrasion Resistance Particle Shape and Surface Texture Durability and Soundness Cleanliness and Deleterious Materials Aggregate Gradation In a gradation and size analysis, a sample of dry aggregate of known weight is separated through a series of sieves with progressively smaller openings Once separated, the weight of particles retained on each sieve is measured and compared to the total sample weight Particle size distribution is then expressed as a percent retained/passing by weight on each sieve size Percent retained Percent passing 9
10 Aggregate Gradation Aggregate gradation influences almost every important property including: Stiffness Stability Durability Permeability Workability Fatigue resistance Skid resistance and Resistance to moisture damage (Roberts et al., 1996) Aggregate Gradation It is often expressed in graphical form Using concepts of Maximum density gradation A special graph referred to as the FHWA (Federal Highway Administration) 0.45 power graph. This gradation would involve a particle arrangement where successively smaller particles are packed within the voids between larger particles 10
11 Fuller and Thompson's Equation (Interactive Equation) A widely used equation to describe a maximum density gradation for a given maximum aggregate size. It is developed by Fuller and Thompson in p n d 100 D * Where: P = percent passing (%) d = aggregate size being considered D = maximum aggregate size n = parameter which adjusts curve for fineness or coarseness (for maximum particle density n 0.5 according to Fuller and Thompson) The 0.45 Power Maximum Density Graph In the early 1960s, the FHWA introduced the standard gradation graph used in the HMA industry today This graph uses Fuller and Thompson's equation with n = 0.45 and is convenient for determining the maximum density line and adjusting gradation (Roberts et al., 1996) This graph is slightly different than other gradation graphs because it uses the sieve size raised to the nth power (usually 0.45) as the x- axis units. Thus, a plot of Fuller and Thompson's maximum density equation with n = 0.45 appears as a straight diagonal line 11

12 Calculations for a 0.45 Power Gradation Curve The 0.45 Power Maximum Density Graph % passing Gradation Curve Maximum Density Line Dense- Graded Uniformly- Graded Open- Graded Gap- Graded Sieve size,^0.45 [mm] Fine- Graded Coarse- Graded 12
13 Coarse Aggregate and their Sieve Sizes Sieve Designation Opening (in) Openeing (mm) 3 in 2 in 1½ in 1 in 3/4 in ½ in 3/8 in Retained on 4.75 mm (No.4) ASTM D692 Retained on 2.36 mm (No.8) Asphalt Institute Retained on 2.00 mm (No.10) HMA Book Fine Aggregate and their Sieve Sizes Sieve Designation Opening (in) Opening (mm) No. 4 No. 8 No. 16 No. 30 No. 50 No. 100 No Passing 4.75 mm (No.4) ASTM D1073 Passing 2.36 mm (No.8) Asphalt Institute Mineral filler At least 70% pass mm ASTM D242 13

14 Maximum and Nominal Aggregate Sizes %P %R Nominal maximum size One size larger than the first sieve to retain more than 10 % Maximum size One size larger than nominal maximum size %P %R Uniformly Graded Aggregate Uniformly graded refers to a gradation that contains most of the particles in a very narrow size range. The curve is steep and only occupies the narrow size range specified. All the particles are the same size. Particle-to-particle contact High void content Low but variable density High stability if confined Low stability when unconfined Difficult to compact 14

15 Uniformly Graded Aggregate % Passing Sieve Size, mm Open-Graded Aggregate Open graded refers to a gradation that contains only a small percentage of aggregate particles in the small range Few particle-to-particle contact High void content Low but variable density High stability if confined Low stability when unconfined Difficult to compact 15

16 Open-Graded Aggregate % Passing Sieve size, mm Dense-Graded Aggregate Dense or well-graded refers to a gradation that is near the 0,45 power curve for maximum density and contains optimum amount of aggregates from all ranges. Particle-to-particle contact Low void content High density High stability if confined High stability when unconfined Difficult to compact 16

17 Dense-Graded Aggregate % Passing Sieve Size, mm Gap-Graded Aggregate Gap graded refers to a gradation that contains only a small percentage of aggregate particles in the mid-size range. The curve is flat in the midsize range No particle-to-particle contact High void content Lower density Low stability if confined Low stability when unconfined Easy to compact 17
18 Gap-Graded Aggregate % Passing Sieve Size, mm Sieve Designation Example Percentage Passing Calculation Aggregate weight retained (g) Total Aggregate percent retained (%) Cumulative weight retained (g) Cumulative percent retained (%) Cumulative percent passing (%)
19 Example Percentage Passing Calculation Percentage passing % Sieve size in [mm] Toughness/Abrasion Resistance Common test methods for characterizing aggregate toughness/abrasion resistance Los Angeles Abrasion (AASHTO T96, ASTM C131) Aggregate Impact Value (British) Aggregate Crushing Value (British) Micro-Deval Abrasion (French/Canadian) Degradation in the SHRP Gyratory Compactor 19

20 Los Angeles Abrasion test The Los Angeles (L.A.) abrasion test is a common test method used to indicate aggregate toughness and abrasion characteristics (AASTO T96, ASTM C131) Resistance of coarse aggregate abrasion and mechanical degradation during handling, construction and use For the L.A. abrasion test, the portion of an aggregate sample retained on the 1.70 mm sieve is placed in a large rotating drum that contains a shelf plate attached to the outer wall A specified number of steel spheres are then placed in the machine and the drum is rotated for 500 revolutions at a speed of revolutions per minute (RPM) Los Angeles Abrasion test The material is then extracted and separated into material passing and retained on the 1.70 mm sieve The retained material is then weighed and compared to the original sample weight. The difference in weight is reported as a percent of the original weight and called the "percent loss" 20

21 Los Angeles Abrasion test Aggregate Type L.A Abrasion value General Values Hard, igneous rocks 10 Soft limestone's and sandstones 60 Ranges for Specific Rocks Basalt Dolomite Gneiss Granite Limestone Quartzite Aggregate Crushing Value The aggregate crushing value indicates the ability of an aggregate to resist crushing The lower the figure the stronger the aggregate, i.e. the greater its ability to resist crushing The aggregate passing 12.5 mm sieve and retained on 10 mm sieve is selected for standard test Compression testing machine with a load of 40 tonnes is applied for 10 minutes 21

22 Aggregate Crushing Value The aggregate crushing value is defined as a ratio of the weight, of fines passing the specified sieve (2.36 mm) to the total weight of the sample expressed as a percentage. Aggregate crushing value > 35 weak for pavement Aggregate crushing value < 10 exceptionally strong Rock group Crushing value Basalt 14 Granite 20 Lime stone 24 Quartzite 16 Aggregate Impact Value Toughness of an aggregate is its resistance to failure by impact Rock group Impact value Basalt 15 Granite 19 Lime stone 23 Quartzite 21 22


23 AASHTO T 104 and ASTM C 88 Estimates resistance of aggregate to breakdown or disintegration when subjected to weathering action Durability/Soundness Successively wetting and drying aggregate in saturated solutions of either sodium sulfate or magnesium sulfate solution Result is total percent loss over various sieve intervals for a prescribed number of cycles Maximum loss values typically range from 10 to 20 % per 5 cycles Soundness Before After 23
24 Cleanliness and Deleterious Materials Deleterious material is the mass percent of contaminants such as clay limps, shale, wood, mica, and coal in the blended aggregate Aggregates must be relatively clean when used in HMA or PCC To test for clay lumps or friable particles A sample is first washed and dried to remove material passing the mm (No. 200) sieve. The remaining sample is separated into different sizes and each size is weighed and soaked in water for 24 hours Particles that can be broken down into fines with fingers are classified as clay lumps or friable material. The amount of this material is calculated by percentage of total sample weight The test can be performed for both fine and coarse aggregates Volumetric relationships of Aggregate Materials 24
25 Phase Diagram To compute mass (or weight) and volume of the three different phases V a air M a =0 V v V w Water M w V t M t V s Aggrega te M s Phase Diagram M= mass of unbound materials V = volume s= solid solids w= water a= air V t V v V a V w air Water M a =0 M w M t v = voids t = total V s Aggrega te M s 25
26 Gravimetric water content (w) is a measure of the water present in the granular mix by weight. It is defined as the ratio of the mass of water, to the mass of the solids, w M M Gravimetric water content (w) W S * 100% V v V a V w air Water M W M a =0 M w Expressed as percentage V t M t Range from 0 to 100 % V s Aggrega te M s Volumetric water content (θ v ) is defined as the ratio of the volume of water, V to the total volume of the aggregate, V w Volumetric water content (θ v ) t Vw v 100 V * % t V v V a V w air Water M a =0 M w Expressed as percentage V t M t Range from 0 to 100 % V s Aggrega te M s 26
27 Porosity (n) Porosity (n) is defined as the ratio of the volume of voids over the total volume of aggregate mix n V V V t * 100% V t V v V a V w air Water M a =0 M w M t Theoretical range : 0 to 100 % V s Aggrega te M s Void ratio (e) Void ratio (e) is defined as the ratio of the volume of voids over the volume of aggregate e n V V V S e 1 e V t V v V a V w V s air Water Aggrega te M a =0 M w M s M t 27
28 Degree of saturation (S) Degree of saturation (S) is the percentage of the void volume filled by water S V V w v * 100% V v V a air M a =0 Dry aggregate materials S = 0% V w Water M w Fully saturated S = 100 % V t M t Note: Unsaturated (0% <S<100%) V s Aggrega te M s Gw Se Densities () Densities is the unit mass of a material Units : g/cm 3, kg/m 3, lb/ft 3, t/m 3, g/ml, Density of water (ρ w = 1.0 g/cm 3 =1000 kg/m 3 =62.4 lb/ft 3 ) Bulk density ( m ) is the density of the aggregate materials in the current state. MT m V T Dry density ( d ) is the density of the aggregate materials in dry state M d V T S Solid density ( s ) is the density of the aggregate materials in solid state M S V S S 28
29 Specific gravity is the ratio of density of aggregate mix to the density of water G S S w G S Specific Gravity (G) M S V S w S M V S S G V V V V V S S dvt V S w d G t S w d 1 G t S w Unit volume of aggregate Unit volume of voids MS GS d W V 1 e t Example 1. A cubic meter of aggregate in its natural state weighs 17.75kN, after being dried it weighs 15.08kN. The specific gravity of the aggregate is Determine the degree of saturation (S), void ratio (e), porosity (n), and gravimetric water content (w) the aggregate as its natural state. Given Total volume of aggregate V t =1m 3 Total weight of aggregate W t = 17.75kN Dry weight of aggregate Ws = 15.08kN Specific gravity of aggregate G s = 2.70 Solution (on white board) 29
30 Mechanical Properties of Aggregates California Bearing ratio (CBR) Value Basically a penetration test Piston penetrates soil at constant rate 0.05 in/min Pressure is recorded Take the ratio to the bearing capacity of a standard rock Range: 0 (worst) 100 (best) Type equation here. CBR= Pressure to cause 0.1 penetration to the sample Pressure to cause 0.1 penetration for standard rock 30
 Value")

31 California Bearing ratio (CBR) Value California Bearing ratio (CBR) Value 31
32 Stress and Strain Stress Strain Stress Load Area Deformation Strain Original _ length Types of materials responses Elastic Load Applied Load Released Elasto-Plastic Recoverable Viscous Deformation Unrecoverable Visco-elastic Time 32


33 Elastic Stress strain behavior Stress Loading Unloading Fully recovered Strain strain Cyclic Loading Behavior Triaxial loading cell is used to test the cyclic loading behavior 33

34 Cyclic Loading Behavior The response of the materials is elasto-plastic Under cyclic load application the aggregates experience:- recoverable (resilient) strain non-recoverable (permanent) strain The stable resilient behavior obtained after a large number of load cycles. The accumulation of permanent strains, which is more complex to describe Stresses Deviator Stress q d Mean principal stress 2 3 Bulk stress p
35 Elasto-Plastic Stress strain behavior Stress Loading Unloading stress Mr Resilient _Strain Permanent Strain Unrecovered Resilient Strain recovered strain Resilient Modulus (M r ) Important mechanical property for pavement design is the elastic properties of aggregate recognizing certain non-linear characteristics (AASHTO T 307) Defined as applied stress divided by recoverable strain d M r r Deviator stress d Resilient strain r Resilient modulus Strength 35
36 K-θ Model for Resilient Modulus (M r ) k 1 and k 2 are constants that represent the intercept and slope of resilient modulus against the bulk stress on logarithmic scales. Psi (Pounds per square inch) Resilient Modulus, Mr*10 3 [psi] 10 k 1 k 2 Mr k k 1 2 Mr = 3,2906θ 0, Bulk Stress, θ, [psi] k 1 = psi (22.68Mpa) k 2 =0.367 Example The Table below shows the result of resilient modulus tests on an aggregate materials. Determine the nonlinear coefficient k 1 and k 2. Confining Deviatoric Recoverable Resilient Bulk Pressure Stress Strain Modulus Stress (psi) (psi) (x 10E-3) (x 10E3) θ, (psi) 2 6 0,58 10, ,74 20, ,95 31, ,14 39, ,2 41,
37 Example Resilient Modulus, Mr, *10 3 [psi] Mr = 2,2015θ 0, k 2 k Bulk Stress, θ, [psi] k 1 = 2201,5 psi (15,2 Mpa) k 2 =0.639 Deformation of Unbound Aggregate Materials 37

")


38 Factors that influence the deformation and shear behavior Particle shape Particle size Angularity Grain size distribution Surface texture Packing (i.e. degree of compaction) Density Mineralogy Mechanisms that contribute to deformation Relative motion of particles due to sliding or rolling Distortion and crushing of particles A B C A B C Before Loading After Loading 38

39 Mechanisms that contribute to deformation When the shear force becomes larger than the shear resistance at the contact: Relative sliding between particles The overall deformation is partly from: Individual particles, and Relative sliding between particles Position before loading Position after loading Unbound Base layer Deformation Aggregate Subgrade 39


40 Unbound Base layer Deformation Present Approach Use a high quality aggregate for surface and base layers Scandinavian countries 40
41 Royal Institute of Technology, Stockholm END Questions? 41