AIR QUALITY MANAGEMENT IN KWINANA FACT SHEET ON. Heavy Metals ENVIRONMENT COMMUNITY INDUSTRY
|
|
|
- Letitia Newman
- 5 years ago
- Views:
Transcription

1 Heavy Metals ENVIRONMENT COMMUNITY INDUSTRY
2 What are heavy metals and how are they produced? Heavy metals exist in elemental form, or as salts and minerals (in rock, sand and dust), as vapours, and form a variety of inorganic or organic compounds. In very small amounts, many metals are necessary to support life, however in larger amounts can cause adverse health effects. For most metals, the bound or complex form is less toxic than the elemental forms. Heavy metals can build up in biological systems (i.e. bio-accumulate) and become a significant health hazard. A range of adverse health effects can be caused by elevated exposure to heavy metals, including effects upon the central nervous system, developmental delay in children, and cancer. A number of heavy metals are known to be human carcinogens. Of the heavy metals referenced in this Fact Sheet, five are classified by the International Agency for Research on Cancer (IARC) as being carcinogenic to humans, including arsenic (and inorganic arsenic compounds), beryllium (and compounds), cadmium (and compounds), hexavalent chromium, and nickel (compounds, excluding metallic and alloys). A number of the other heavy metals referenced in this Fact Sheet are classified as probably or possibly carcinogenic to humans. The National Environment Protection Measure (NEPM) for Ambient Air Quality specifies a national ambient air quality standard for lead. The National Environment Protection Council (NEPC) has not published ambient air quality standards for other heavy metals. In the Kwinana industrial area, located south of Perth, Western Australia, heavy metals are produced by Kwinana Industry as an unintended by-product of manufacturing processes, typically as a result of combustion of fossil fuels, handling and storage of metal bearing ores and/or products, and the use of catalysts that contain metal. Table presents information on the relative contribution of heavy metal emissions in Kwinana according to industry sector. Emissions information for Kwinana industry has been obtained from Australia s National Pollutant Inventory (NPI) database for the 008/09 reporting period. NPI data for 009/0 will not be publicly available until 0. The NPI currently contains emissions information on 93 substances deemed important due to their possible effect on human health and the environment. Facility operators determine their emissions each year, and government agencies periodically estimate diffuse emissions such as those from motor vehicles and households. NPI data are freely accessible via the website Alumina refining was the largest contributor to the emissions of heavy metals in 008/09, making up nearly one third (30.7%) of the total emissions of heavy metals from Kwinana industry. The sector Other Basic Non-Ferrous Metal Manufacturing was also a significant contributor to heavy metal emissions from Kwinana industry. Table : Summary of Heavy Metals Emissions from Kwinana Industry for 008/09 Industry Sector Total Heavy Metals Emissions (per annum) Relative Contribution (%) Alumina Production Basic Inorganic Chemical Manufacturing Cement and Lime Manufacturing Fertiliser Manufacturing Fossil Fuel Electricity Generation Iron and Steel Casting Iron Smelting and Steel Manufacturing Metal Coating and Finishing Other Basic Non-Ferrous Metal Manufacturing Petroleum Refining and Fuel Manufacturing Other tpa % % 0.6% 0.6% 0.7% 9.3% 3.8% 7.0% 0.0%.% 4.%.0% Emissions information for Kwinana industry has been obtained from Australia s National Pollutant Inventory (NPI) database for the 008/009 reporting period. Total Heavy Metals include the sum of antimony, arsenic, beryllium, cadmium, chromium (III), chromium (VI), cobalt, copper, lead, manganese, mercury, nickel, selenium, zinc, and their compounds.
3 How much is emitted by Kwinana Industry? The total quantity of heavy metals emitted to air by Kwinana Industry (i.e. all reporting facilities located in the Cockburn, Kwinana and Rockingham local government areas), as reported in the National Pollutant Inventory (NPI) for the 008/09 reporting period, is presented in Figure. The total quantity of heavy metals emitted to air by Kwinana Industry ranged from,354 kg/y of nickel (including nickel compounds), down to 3.4 kg/y of cobalt (including cobalt compounds). To put the quantity of heavy metal emissions into context, according to NPI data for the same reporting period the total quantity emitted to air by Western Australian industry (i.e. all NPI reporting facilities located in Western Australia) ranged from,73 tpa of manganese (including manganese compounds), down to 400 kg/y of hexavalent chromium (including hexavalent chromium compounds). Overall, the total quantity of heavy metals emitted to air by Kwinana contributed less than one percent (0.3%) to the state s total industrial emissions of heavy metals during the 008/09 reporting period. Figure : Annual Quantity of Heavy Metal Emissions Generated by Industry in 008/09 00,000 kg/y 50,000 00,000 50,000 0 Antimony WA 485 Kwinana 8 Arsenic 3, Beryllium,9 9 Cadmium,040 8 Chromium (III) 3, Chromium (VI) Cobalt 49,03 3 Copper 47,50 8 Lead 30,875 9 Manganese,7, Mercury 9, Nickel 00,84,354 Selenium Zinc 86,98,50

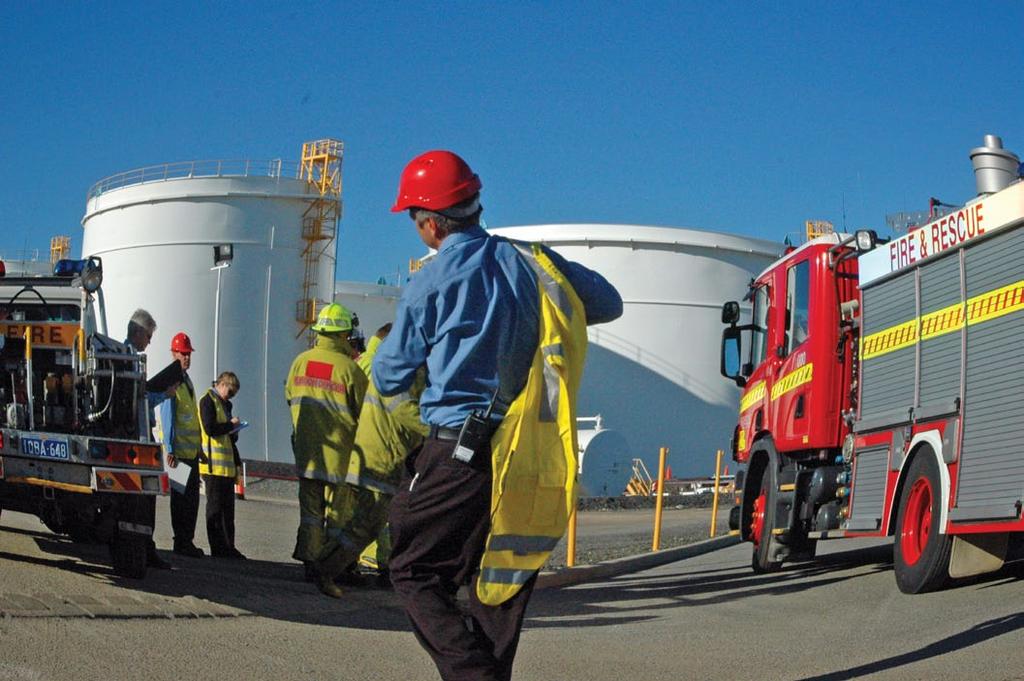
4 How are emissions managed? In order to minimise heavy metal emissions, Kwinana industry:» manages choice of fuel;» alters material properties and/or design of material handling equipment to limit dust generated from material handling and storage; and» uses pollution control equipment. Natural gas is a clean burning fuel that contains very low levels of metal contaminants, hence the emissions of heavy metals associated with the combustion of natural gas are minimal. Natural gas has been supplied to Kwinana since 984, making it the preferred fuel for most Kwinana industry, providing local air quality benefits. Case Study: Nickel Emissions from Nickel West Kwinana Nickel West Kwinana (pictured below) produces nickel metal (at least 99.8% pure) from nickel matte (approx. 68% nickel) sourced from the Kalgoorlie Smelter. Nickel is emitted during product handling and refining processes. Measures taken at Nickel West Kwinana to minimise the emissions of nickel include:» baghouse filtration is used to control emissions from the metals handling building;» a new storage facility is being constructed for the storage of excess nickel matte;» point source emissions are sampled on a regular basis to monitor emissions; and» an ambient monitoring program has just been completed to aid in the understanding of the impacts of nickel concentrations in the environment. Case Study: BP Refinery, Kwinana BP s Kwinana Refinery, although a relatively minor contributor to total heavy metal emissions released to air from Kwinana industry (refer to Table ), continues to look for opportunities to further reduce metal emissions. The Catalytic Cracker is a source of heavy metal emissions released to air from BP s Kwinana Refinery. Catalytic Cracking is an important process used in petroleum refining to convert heaver factions (oils) to lighter fractions which are more valuable fuels. Metals that occur naturally in crude oil become bound to particulates emitted from the Catalytic Cracking process. By upgrading particulate emission control on the Catalytic Cracker, BP has been able to reduce emissions of heavy metals from its Kwinana refinery. Figure presents the particulate concentration range from the Catalytic Cracker before and after the first upgrade in emission control which occurred in 99, and after the second upgrade which occurred in 004. Overall these upgrades have resulted in up to a ten fold decrease in the concentration of particulate emissions from the Catalytic Cracker, and an associated reduction in heavy metal emissions. Figure : Catalytic Cracker Particulate Emissions,50 Particulate Concentration (mg/m 3 ), Pre Upgrade 004 Upgrade
5 What ambient monitoring is conducted? Ambient air quality monitoring for heavy metals in Western Australia is conducted on a campaign basis by the Department of Environment and Conservation (DEC). The Background Air Quality (Air Toxics) Study involved the most extensive monitoring of heavy metals in the Kwinana area. The Study involved monitoring of heavy metals in Hope Valley, as well as two other locations in the Perth metropolitan area (Perth CBD and Duncraig). Monitoring commenced in February 005, with 4-hour samples collected every six days over a period of twelve months. Further information on the DEC s ambient air quality monitoring projects, including the Background Air Quality (Air Toxics) Study, is available on the DEC s website Figure 3 presents a summary of the monitoring results for relevant heavy metals, showing the maximum 4-hour and average concentrations measured in Hope Valley over the entire period of monitoring, compared to the Perth CBD and Duncraig monitoring sites. The monitoring results show that the concentrations of heavy metals in ambient air were typically found to be:» higher in Hope Valley than the Duncraig suburban monitoring site; and» lower in Hope Valley than the Perth CBD monitoring site. Notable exceptions occurred for copper and nickel, where higher concentrations were measured in Hope Valley compared to the other Perth metropolitan sites. It is important to note that the ambient concentrations of all metals (including copper and nickel) measured in Hope Valley are well below the ambient air quality standards adopted by the DEC for the Background Air Quality (Air Toxics) Study. Figure 3: Average and Maximum 4-hour Concentrations Measured Background Air Quality (Air Toxics) Study Concentration (μg/m 3 ) Arsenic Beryllium Cadmium Cobalt Chromium Copper Mercury Manganese Nickel Lead Selenium Vanadium Maximum Average Hope Valley Perth CBD Duncraig
6 What ambient monitoring is conducted? Table presents a summary of concentrations of heavy metals measured in the ambient air in Hope Valley, compared to the ambient air quality standards adopted by the DEC to be protective of health. From the data presented in Table it can be seen that the ambient concentrations measured in Hope Valley comfortably comply with the relevant ambient air quality standards. Annual average concentrations of manganese, nickel and chromium most closely approach the relevant standards, but are still less than half of the standard. In the case of chromium, the measured annual average ambient concentration of total chromium is compared to a standard which is specific to hexavalent chromium (a carcinogenic form of chromium), and therefore provides a conservative (i.e. health protective) assessment of the potential health impact. Table : Summary Results of Heavy Metal Monitoring in Hope Valley 3 Compound Maximum 4-hour Average Concentration Hope Valley Standard % of Standard Annual Average Concentration Hope Valley Standard % of Standard Units µg/m 3 µg/m 3 Reference 4 % µg/m 3 µg/m 3 Reference 4 % Arsenic % 0.3% Beryllium % % Cadmium % % Cobalt % % Chromium % % Copper % % Mercury % % Manganese % % Nickel % % Lead % NEPC 0.4% Selenium 0 0.0% % Vanadium % % 3 Data supplied by the Department of Environment and Conservation (DEC). 4 Ontario Ministry of the Environment Ambient Air Quality Criteria (); Texas Commission on Environmental Quality (; World Health Organisation (); National Environment Protection Council (NEPC)

 meetings are available on the KIC website")
7 More Information This Fact Sheet has been prepared by ENVIRON Australia Pty Ltd, on behalf of the KIC. Fact Sheets in the Air Quality Management in Kwinana series include:» Sulphur Dioxide;» Nitrogen Dioxide;» Particulate Matter (including PM 0 and PM.5 );» Toxic Organic Compounds; and» Heavy Metals. Fact Sheets and the associated presentations given at Communities and Industries Forum (C&IF) meetings are available on the KIC website Kwinana Industries Council Stidworthy Court Kwinana, WA 6966 Tel: (08)