Erosion and fuel retention of different RAFM steel grades
|
|
|
- Bathsheba Stafford
- 5 years ago
- Views:
Transcription
1 Erosion and fuel retention of different RAFM steel grades Peng Wang 1, Li Qiao 1, Liang Gao 2, Wolfgang Jacob 2, Engang Fu 3 1. Lanzhou Institute of Chemical Physics, Lanzhou, China 2. Max-Planck Institute of Plasma Physics, Garching, Germany 3. Peking University, Beijing, China
2 Outline Sample preparation & experimental details Erosion of CLF-1 steels exposed to deuterium plasma Comparison of sputtering yield of different RAFM steels Comparison of sputtering yield of RAFM steels with different roughness Fuel retention in various steel grades Work plan


3 Ion flux (10 20 m -2 s -1 ) Linear experiment plasma system--leps Linear Experimental Plasma System (LEPS) H 2 Parameters of LEPS plasma: Magnet field: T Plasma beam diameter: 50 mm Ion flux: m -2 s -1 Ion composition: mainly D + 3 Electron density: m -3 Floating potential:-15 V D 2 Working pressure: Pa Deuterium N Beam centre Location (mm) LEPS deuterium plasma profile measured by LP

 (Fe balance) RAFM C Cr W Mn V Ta N P")


4 RAFM steel materials Table 1. Composition of various RAFM steel grades (in wt.%) (Fe balance) RAFM C Cr W Mn V Ta N P S EUROFER CLF / RUSFER CLAM CLF-1 steel from ASIPP (Aug, 2015) EUROFER from IPP (2015) CLF-1 CLF-1-L transversal mm longitudinal mm CL AM, 2 Kg from FDS (May, 2017) RUSFER 10 pic (Jan, 2017) mm
 HRTEM: (FEI Tecnai) Voltage: 200 kv Resolution: 0.")
 Probing beam: 4 He + Energy: 3 MeV XPS: (Phi-5702) Source: Al kα")
 &")
5 Experimental details- Analyses Structure Composition Deuterium retention SEM: (JSM-5601) HRTEM: (FEI Tecnai) Voltage: 200 kv Resolution: 0.24 nm Profilmeter GDOES: (Profiler-2) Ar power:30 W Sputtering rate:2 nm/s RBS: (Peking University) Probing beam: 4 He + Energy: 3 MeV XPS: (Phi-5702) Source: Al kα Pass energy: 29.4 ev TDS: Base pressure: Pa Heating range:rt-1200 K Measuring mass:4(d 2 ) & 3(HD) Heating ramp: 15 K/min NRA: (IPP Garching) Probing beam: 3 He + Energy: MeV Simulation: NRADC
6 Outline Sample preparation & experimental details Erosion of CLF-1 steels exposed to deuterium plasma Comparison of sputtering yield of different RAFM steels Comparison of sputtering yield of RAFM steels with different roughness Fuel retention in various steel grades Work plan
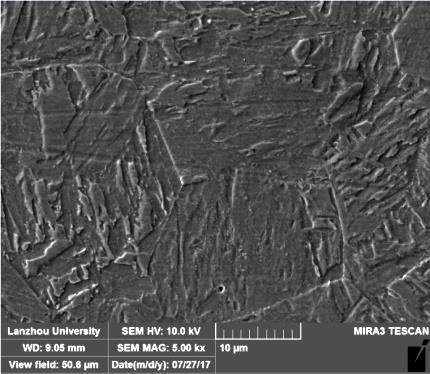
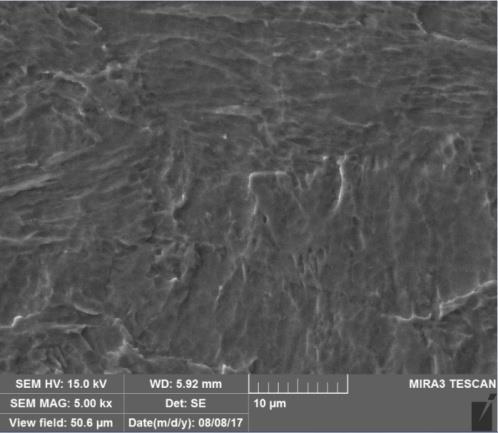
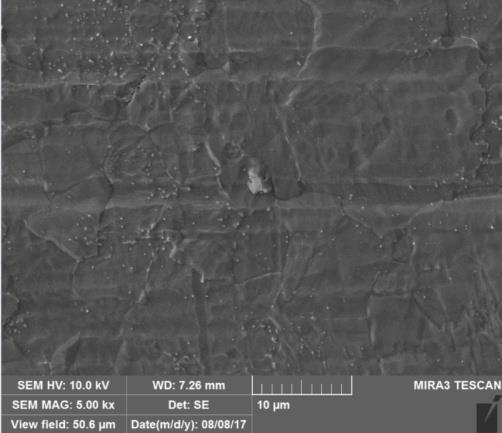
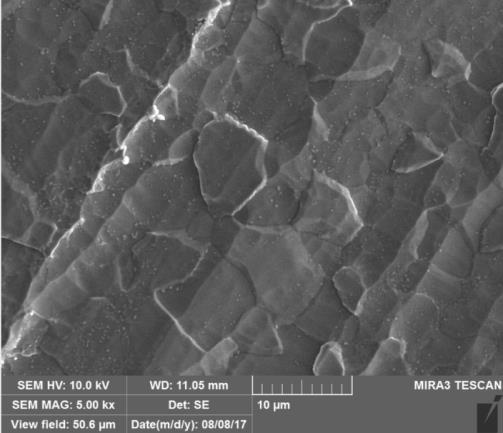
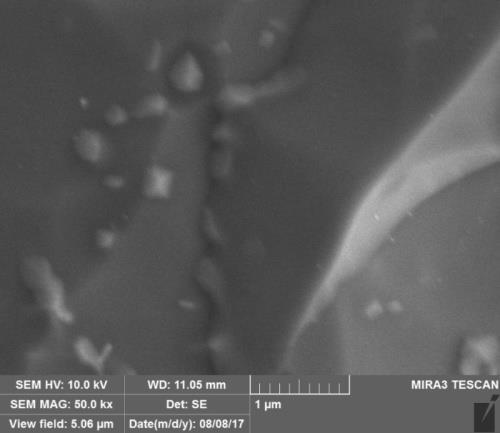
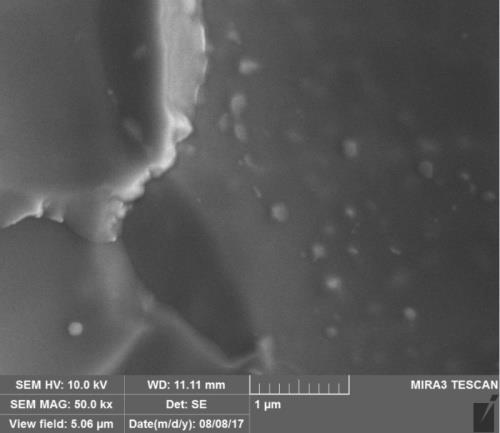
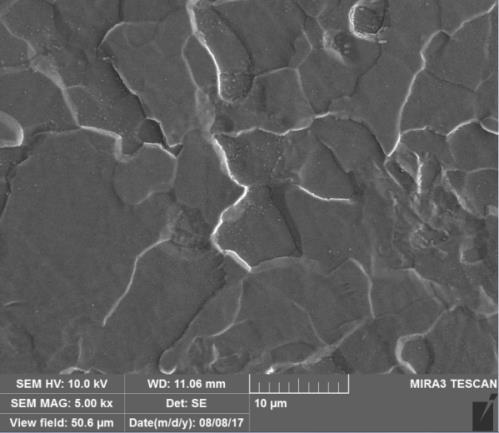
7 Ra ( m) Morphology changes- Surface roughness Surface roughness of CLF-1 steels after deuterium exposure Surface line profile of CLF-1 exposed to 180 ev/d deuterium plasma 0.35 CLF-1 steels D/m ev/d ev/d 70 ev/d 150 ev/d 180 ev/d D/m D/m Deuterium fluence (D/m 2 ) D/m 2 Before exposure Surface roughness increases with increasing incident ion energy and fluence, no roughness saturation was observed at a fluence up to D/m 2 1 m 100 m

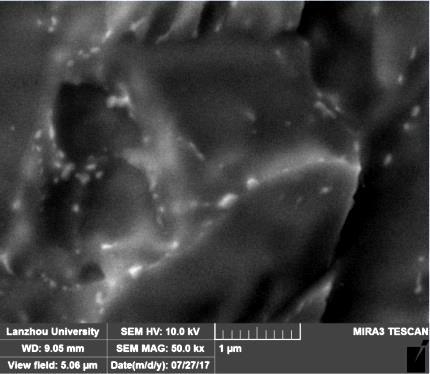
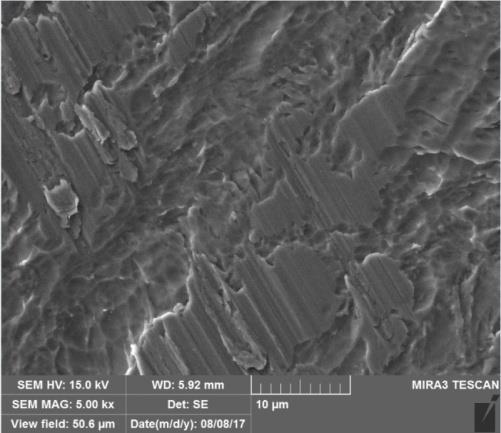
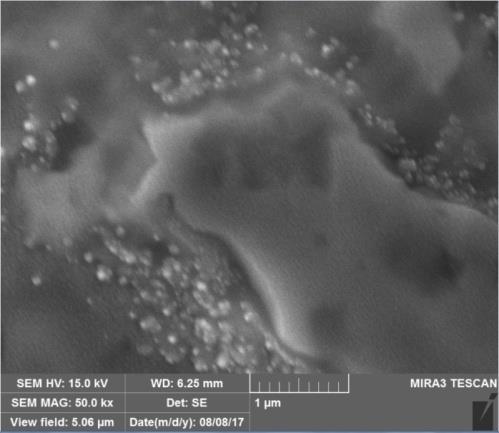
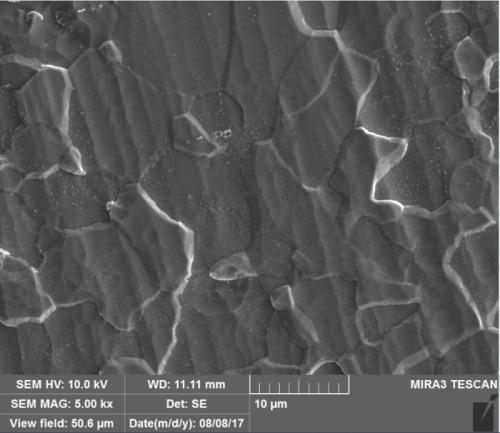
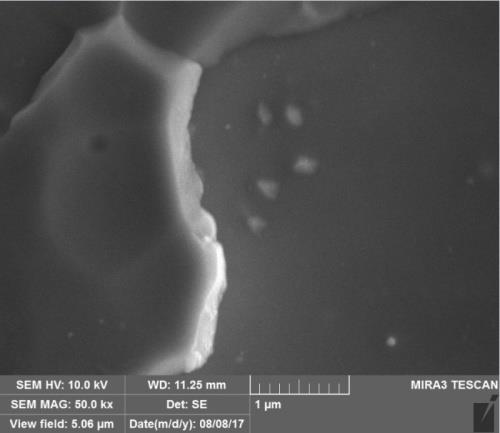
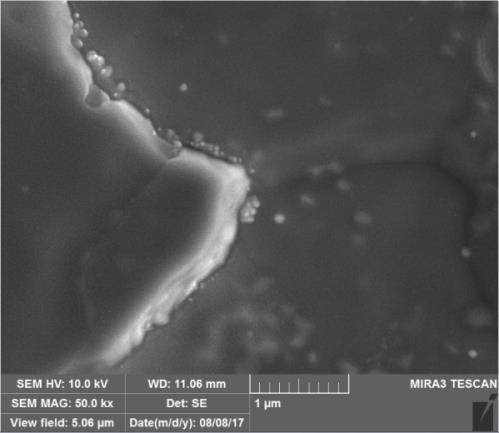
8 Morphology changes- Fluence dependence Deuterium plasma exposure: energy: CLF-1, 150 ev/d, temperature: 450 K Before exposure D/m D/m D/m D/m D/m 2

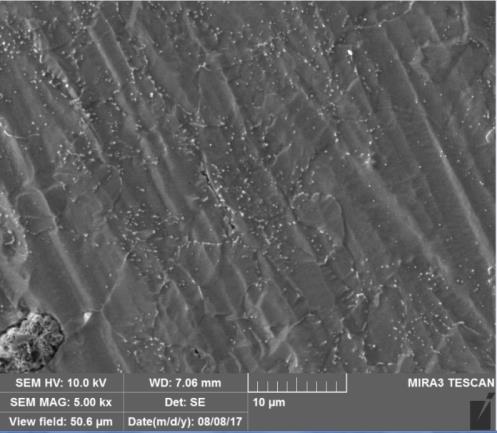
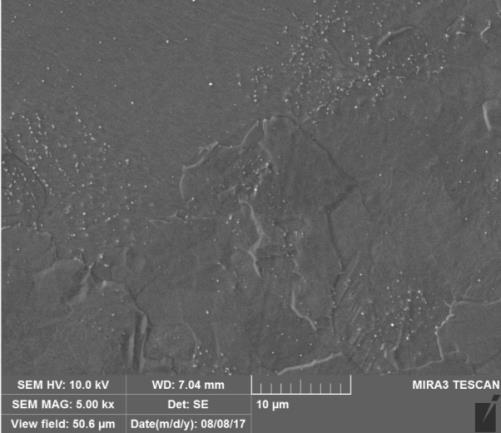
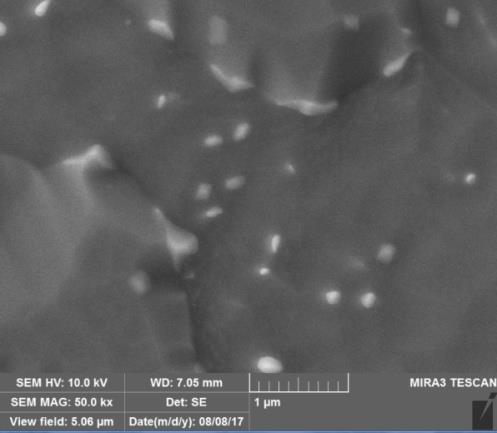
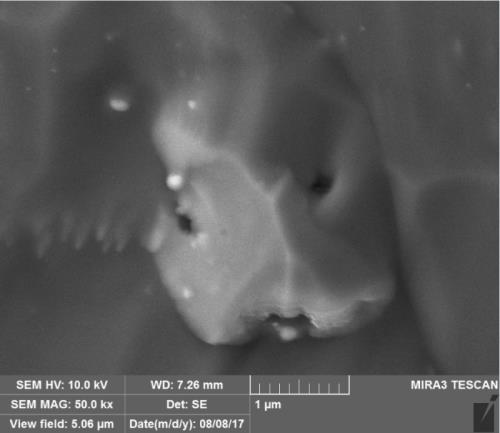
9 Morphology changes- Energy dependence Deuterium plasma exposure: CLF-1, fluence: D/m 2, temperature: K 30 ev/d 70 ev/d 150 ev/d 180 ev/d
10 Sputtering yield Sputtering yield Sputtering yield Fluence dependence of sputtering yield of CLF-1 steel CLF-1 steels (a) ev 150 ev 180 ev... Ref 180eV Fe/D 10-2 Energy dependence of sputtering yield of CLF-1 and EUROFER steels (b) CLF D/m 2 EUROFER Ref D/m eV Fe/D eV Fe/D D Fluence (D/m 2 ) D energy (ev per D) Sputter yield was determined by mass loss. Clear decreases of yield of CLF-1 steels with increasing of incident fluence, no clear saturation of yield at fluence up to D/m 2. Sputtering yield of CLF-1 and EUROPER steels is lower than pure Fe Preferential sputtering changes the composition, leads to the enrichment of tungsten and reduces the total sputter yield 10-3 Sugiyama K, Schmid K, Jacob W 2016 Nuclear Materials and Energy 8 1-7

11 Counts Surface tungsten enrichment 500 RBS CLF-1, 180eV/D, 450 K He: 3MeV Detector angle: 160 Beam incident angle: 20 Charge: 10 c W Surface Before exposure D/m D/m D/m Channel N. Ashikawa, K. Sugiyama, A. Manhard, et al., Fusion Engineering and Design, 112(2016) W enrichment was observed by RBS measurements but not not good agreement with data from F82H steel exposed to comparable incident fluence, could be: Measurement difference or various initial W concentration in bulk (1.5 and 2.0 wt% W in CLF-1 and F82H bulk, respectively)


12 Surface tungsten enrichment Pt-c Pt-c Pt CLF-1 CLF-1 30 nm W Pt-c Pt-c 10 nm Fe CLF-1 CLF-1 Cr

 cannot be safely distinguished in the EDX line scans.")
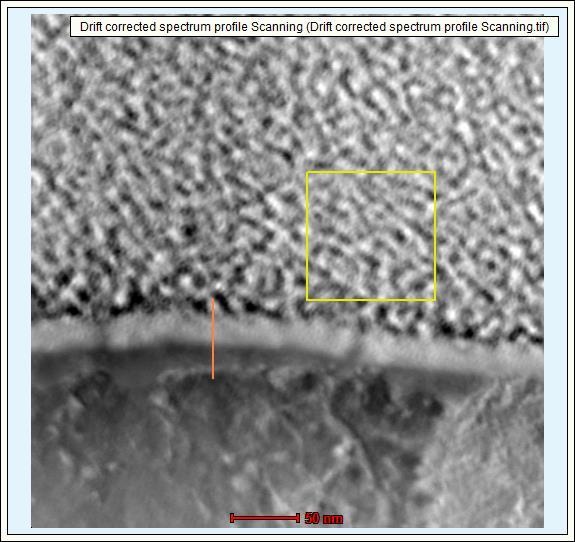
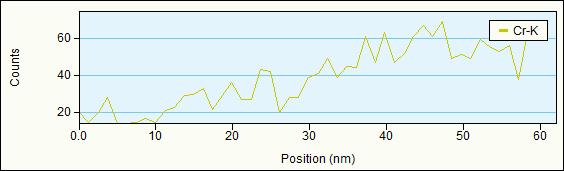
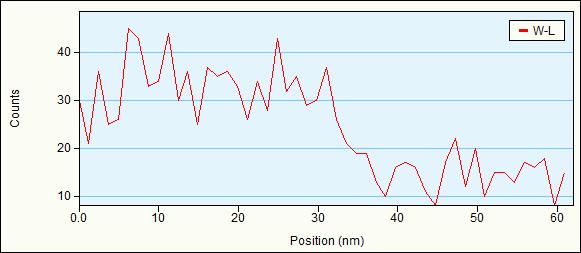
13 Counts (a.u.) Surface tungsten enrichment Cross-section image Composition depth profile Fe Pt-C CLF-1 In the grey region, the Fe and Cr EDX signals increase from background level to their maximum level and this transition region is about 20 nm thick. The Pt EDX line partially overlaps with the W line such that a small fraction of W in a large background of Pt (stemming from the protection layer) cannot be safely distinguished in the EDX line scans Cr W Pt Position (nm)


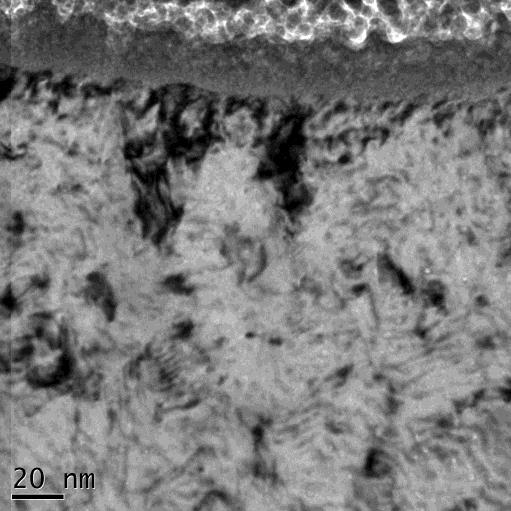
14 Surface tungsten enrichment CLF-1 Deuterium plasma exposure: 150eV, D/m 2 A pure platinum layer were deposited on CLF-1 as a protecting layer Pt-C Pt Pt Pt CLF-1 CLF-1 CLF-1 There is no obvious uneven sputtering region between the crystalline bulk and the Pt protecting layer. Few nm damage zone exists and mixed with pure Pt layer

15 Counts (a.u.) Surface tungsten enrichment Cross-section image Composition depth profile 300 Pt Fe CLF Cr W 20 The Pt EDX line partially overlaps with the W line such that a small fraction of W in a large background of Pt cannot be safely distinguished in the EDX line scans Pt Position (nm)


16 Surface tungsten enrichment CLF-1 sample, Deuterium plasma exposure: 150eV, D/m 2 An amorphous carbon layer was deposited on sample surface before TEM analyses Pt-C C CLF-1 C CLF-1 C CLF-1 About 5 to 10 nm region damaged by plasma exposure was observed by TEM, which partially overlaps with the amorphous carbon at the mixed interface.

17 Counts (a.u.) Surface tungsten enrichment Cross-section image Pt C CLF-1 Amorphous carbon layer was deposited on CLF- 1 surface to avoid the influence of Pt on composition depth profile measurement, however, W enrichment was found in whole carbon layer region and much thicker than as expected Composition depth profile Fe Position (nm) Cr W Pt C
18 Outline Introduction Sample preparation & experimental details Erosion of CLF-1 steels exposed to deuterium plasma Comparison of sputtering yield of different RAFM steels Comparison of sputtering yield of RAFM steels with different roughness Fuel retention in various steel grades Work plan
19 Sputtering yields of various RAFM steels Table 1. Composition of various RAFM steel grades (in wt.%) (Fe balance) RAFM steel EUROFE R97 C Cr W Mn V Ta N P S CLF / RUSFER (EK-181) CLAM
20 Sputtering Yield Counts Sputtering yields of various RAFM steels Sputtering yield of RAFM steels 1200 RBS 180eV/D, D/m RAFM steels 70eV/D D/m 2 180eV/D D/m CLF-1 CLF-1-L EUROFER CLF-1 CLF-1-L EUROFER Samples He: 3MeV 200 Detector angle: 160 Beam incident angle: 20 Charge: 20 c Channel Initial W concentration of various RAFM steels: W CLF-1 =W CLF-1-L >W EUROFER Sputtering yield of various RAFM steels: Y CLF-1 >Y CLF-1-L >Y EUROFER Other factor influence of sputtering yield? (Grain orientation, roughness)
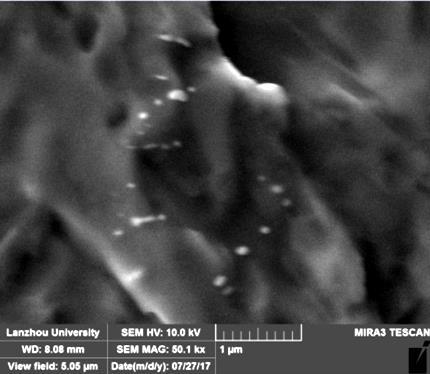
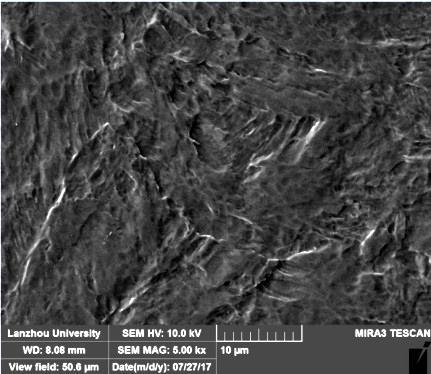
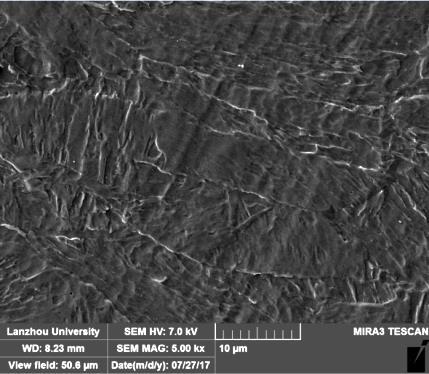
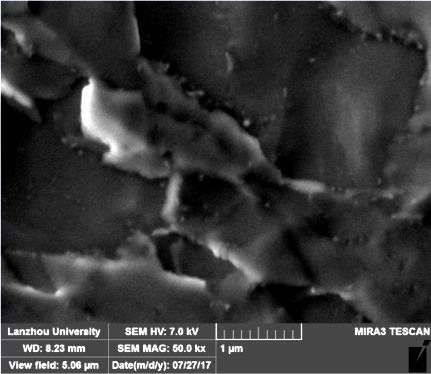
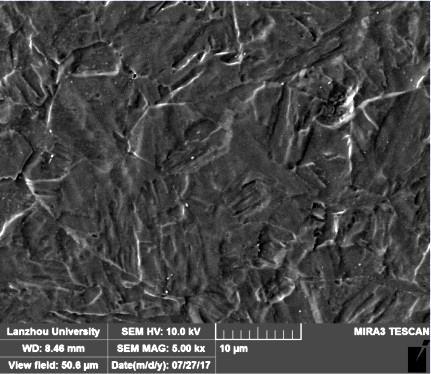
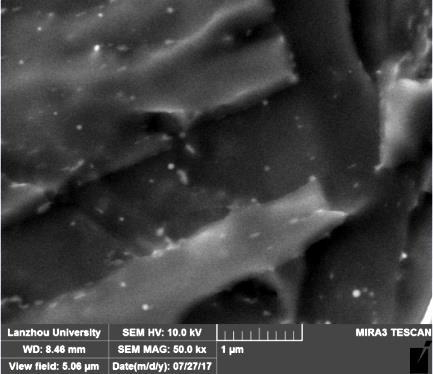
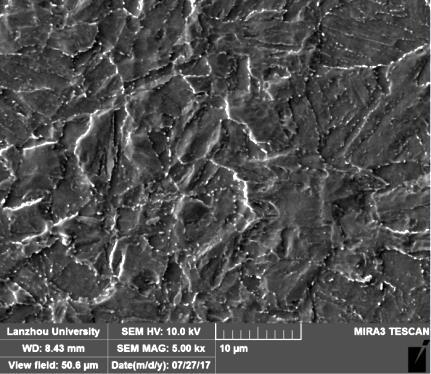
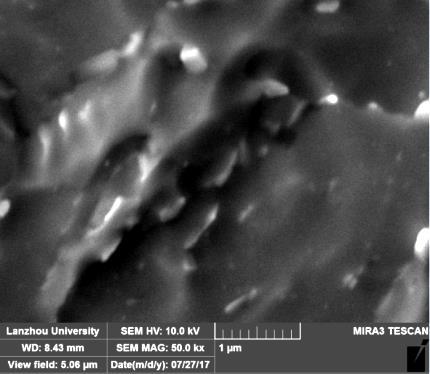
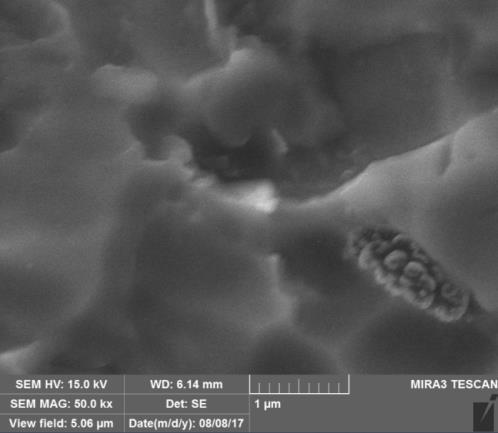
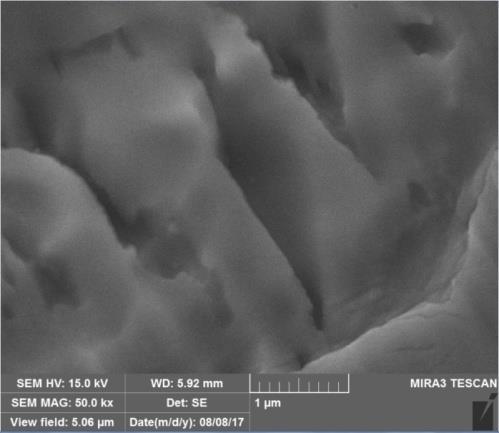
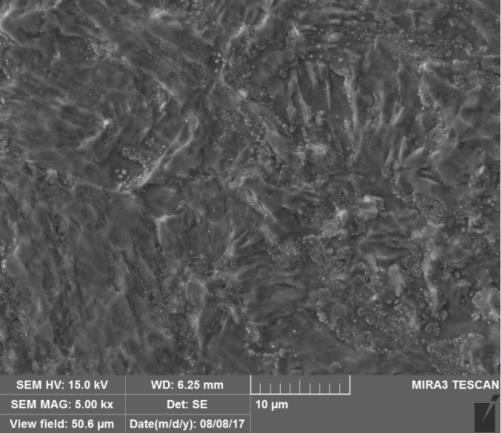
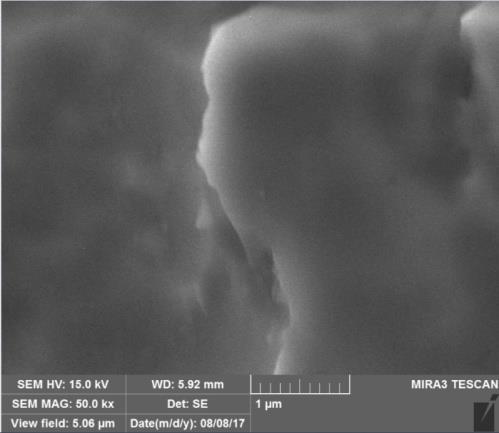
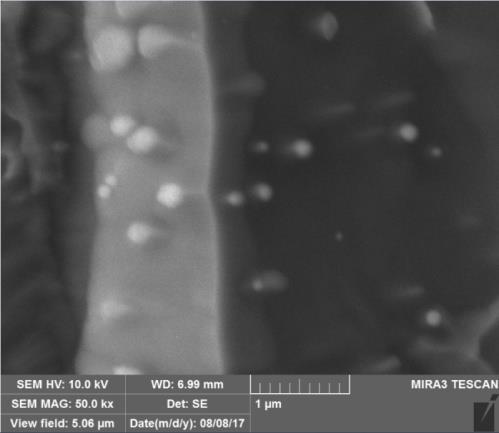
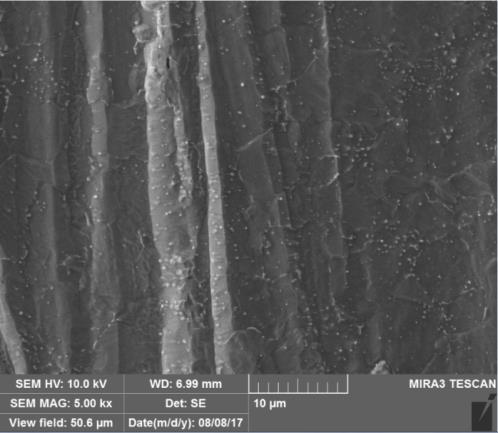
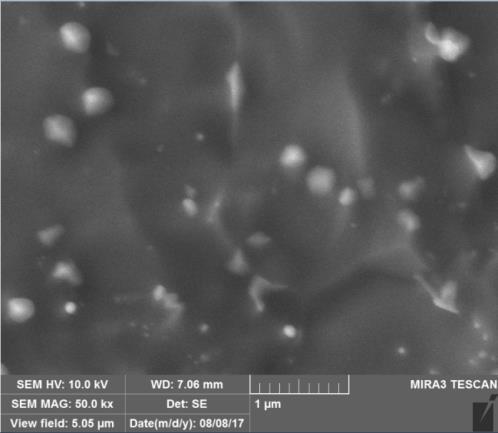
21 Morphology changes Deuterium plasma exposure (180 ev/d, 450K, D/m 2 ) CLF-1 CLF-1-L CLAM EUROFER RUSFER
22 Sputtering Yield Sputtering Yield Sputtering yields of various RAFM steels Sputtering yield of RAFM steels RAFM steels 70eV/D D/m 2 180eV/D D/m Sputtering yield of RAFM steels 180 ev/d D/m ev/d from Ref. [1] CLF-1 CLF-1-L EUROFER Samples CLF-1 CLF-1-L EUROFER CLAM RUSFER Samples Initial W concentration of various RAFM steels: W CLF-1 =W CLF-1-L >W EUROFER Sputtering yield of various RAFM steels: Y CLF-1 >Y CLF-1-L >Y EUROFER Other factor influence of sputtering yield? (Grain orientation, roughness)
23 Outline Introduction Sample preparation & experimental details Erosion of CLF-1 steels exposed to deuterium plasma Comparison of sputtering yield of different RAFM steels Comparison of sputtering yield of RAFM steels with different roughness Fuel retention in various steel grades Work plan

24 Sputtering yields of various RAFM steels Deuterium plasma exposure at: 180eV, 7E24 D/m2 Ra=20 nm Ra=50 nm Ra=100 nm Ra=400 nm
25 Sputtering yields of various RAFM steels Deuterium plasma exposure at: 70eV, 7E24 D/m2 Ra=20 nm Ra=50 nm Ra=100 nm Ra=400 nm

26 Sputtering yields of various RAFM steels Deuterium plasma exposure at: 180eV, 7E24 D/m2 Ra=20 nm Ra=50 nm Ra=100 nm Ra=400 nm
27 Sputtering yield Sputtering yields of various RAFM steels D plasma: 180 ev D/m 2 CLF-1-L 873 K CLF-1-L 1173 K EUROFER 873 K RAFM steel samples with different initial rough show comparable sputtering yield 0.01 More accurate measurement based on spectroscopy is needed 0.00 R20 R50 R100 R400 Sample
28 Outline Introduction Sample preparation & experimental details Erosion of CLF-1 steels exposed to deuterium plasma Comparison of sputtering yield of different RAFM steels Comparison of sputtering yield of RAFM steels with different roughness Fuel retention in various steel grades Work plan
29 D retention (D/m 2 ) Fuel retention of CLF-1 steel after deuterium exposure RAFM steel 30 ev/d 320 K 70 ev/d 460 K 30 ev/d 330 K 150 ev/d 450 K 30 ev/d 325 K 180 ev/d 470 K EUROFER 30 ev/d 320 K Fluence dependence of D retention in CLF-1 1E21 1E20 (b) D fluence: D/m 2 CLF-1-L EUROFER Retention D/m 2 1E D fluence (D/m 2 ) 1E D Energy (ev) Deuterium retention in CLF-1 decreases with increasing fluence except the samples exposed to 30 ev/d deuterium plasma, in which D retention keeps as a constant (about D/m 2 )
30 Concentration (at.fr) Deuterium retention (D 2 /m 2 /s) Fuel retention of various RAFM steels Deuterium depth profiles of CLF-1 and EUROFER97 measured by TDS Deuterium release from CLF-1, CLAM, EUROFER97 and RUSFER measured by TDS LEPS deuterium plasma: 30 ev/d, D/m 2 CLF-1 EUROFER 1.5x10 16 CLF-1 CLF-1-L CLAM EUROFER RUSFER 1.0x x Depth (10 15 atoms/cm 2 ) Deuterium retention at 30 ev/d is one order of magnitude higher than EUROFER, NRA show a high D retention region at near surface region (surface to 2μm) Temperature (K) Deuterium plasma exposure: 180 ev/d K)
31 Deuterium retention (D 2 /m 2 /s) Concentration (at.fr) Fuel retention of various RAFM steels Deuterium release of CLF-1 and EUROFER97 measured by TDS Deuterium depth profiles of CLF-1 and EUROFER97 measured by TDS 1.5x10 16 CLF-1 CLF-1-L CLAM EUROFER RUSFER 1.0x LEPS deuterium plasma: 30 ev/d, D/m 2 CLF-1 EUROFER 5.0x Temperature (K) Depth (10 15 atoms/cm 2 ) CLF-1, CLF-1-L and EUROFER samples were exposed in one batch (30 ev/d 320 K) CLF-1 & CLF-1-L: deuterium release at 450 K EUROFER: deuterium release at 420 K Deuterium retention at 30 ev/d is one order of magnitude higher than EUROFER, NRA show a high D retention region at near surface region (surface to 2μm)

32 Fuel retention of various RAFM steels Comparison of fluence dependence of D retention between W and RAFM steels (CLF-1, EUROFER and F82H) LEPS CLF-1 30 ev/d 320 K CLF-1 70 ev/d 460 K CLF ev/d 470 K EUROFER 30 ev/d 320 K RUSFER 30 ev/d 320 K D in W Deuterium retention after LEPS plasma exposure measured by TDS D retention in RAFM steels is lower than in W D retention in RAFM steel decreases with increasing incident fluence D retention in CLF-1 steel at 30 ev/d is higher than other RAFM steels W. Jacob, IAEA steel CRP meeting
33 Work plan Erosion of RAFM steel samples extends to higher temperature, to study the surface W enrichment with RBS and TEM Compare sputtering yield more precisely using other methods Study the fuel retention in steel samples after 3.5 MeV iron ions damaging Extend the fuel retention and composition depth profile up to several tens nm region using GDOES
34 Thank you for your attention!