Experiments in Platelet Composites
|
|
|
- Luke Morrison
- 5 years ago
- Views:
Transcription


1 Experiments in Platelet Composites Pascal Hubert Werner Graupe Chair in Sustainable Composite Manufacturing Prepreg Platelet Composite Molding & Performance Workshop Composites Manufacturing & Simulation Center, Purdue University October 26, 2017
2 Outline Background and motivation Process development Strand placement Temperature pressure Flow Defect formation Voids Cooling Design guideline application Other topics Dimensional stability Hybrids Recycling Conclusion 2
 with composites")


3 Motivation Replace complex metallic parts (brackets, clips, hinges) with composites Aircraft hinge Need a process for the manufacturing of composite parts: High complexity Good performance Net shaped Fast cycle time Source: Airbus A350 spoiler 3


4 Motivation Injected short fibres Continuous fibres Fibre length : 1-2 mm High complexity Good performance Net shaped Fast cycle time High complexity Good performance Net shaped Fast cycle time Source: Boeing Aerotec Long discontinuous fibres Short and continuous fibres benefits Fibre length : 6-25 mm 4
 Aerospace grade, v f = 60%")

")
5 Material AS4/PEEK (CETEX Thermo-Lite from TenCate) Aerospace grade, v f = 60% Semi-crystalline High Temperature: T g = 143 C, T m = 343 C, T processing = 380 C MC1200 Randomly oriented strands (ROS) DLF TC1200 Continuous fibre (CF) material 5


6 Moulding Techniques Compression moulding (complex shapes) Thermoforming (simple shapes constant thickness) 6
7 Short Processing Cycles Compression moulding < 1 h cycle time Temperature [ C] Consolidation Time Thermoforming < 30 min + preform Thermoset : Layup ~ hours/day Cure > 5 hours Temperature [ C] Stamping Time 7
8 Challenges New material. PEEK introduced in 1980 s. DLF: MC1200 introduced in 2013 by TenCate Very high processing temperature High viscosity (void reduction) / high pressure required Dimensional stability for complex shapes New processes and procedures Mould design Material preparation Moulding pressure and temperature Demoulding temperature & dwell time 8
9 Moulding a DLF part Quality Characterization Final part Material placement Cooling Heat + pressure Material flow Voids reduction 9
10 Moulding a DLF part Quality Characterization Final part Material placement Cooling Heat + pressure Material flow Voids reduction 10
11 Complex Shape Process Development 3.17 mm 25.4 mm Die set Insulation 100 mm Machined inserts Heating cartridges Cooling channels Machined inserts Instrumented fixture 11
12 Moulding Cycle Temperature ( C) Time (min) Bottom Rib Top Flange Pressure Pressure (bar) TC Flange TC Bottom rib 12


13 Test Matrix Strand geometry: 3.17 mm 6.35 mm 3.17 mm 12.7 mm 6.35 mm 25.4 mm Processing temperatures : 360 C C T melting : 343 C Pressure: 3 70 bar Initial strand placement 13


14 Initial Strand Placement Uniform DLF distribution Separated DLF placement Overlapping strands No overlapping strands Knitline 14


 3.17 mm 6.35 mm 20 3.17 mm 12.7 mm 30 6.")
15 Rib Filling Processing window assessment Fill percentage measured with image processing software 27 % Filled 100 T processing = 380 C Critical filling pressure Rib fill (%) mm 6.35 mm 3.17 mm mm 6.35 mm mm Processing pressure (bar) Strand size P fill (bar) 3.17 mm 6.35 mm mm 12.7 mm mm 25.4 mm 40 15
 Rib")

 95 65 80 95 (60")
 Strand")
16 Rib Filling Processing Map Processing temperature ( C) Rib fill (%) % Fill (40 bar,380 C) (60 bar,400 C) Processing pressure (bar) Strand size: 3.17 mm mm 16

17 Component Testing Tested using a custom rib pull-out fixture MTS 100 kn test frame Machine Grip Specimen Loading Roller 1 Fixture 0.75 Machine Grip 17

18 Component Testing 1.4 T processing = 400 C 1.2 Normalized strength mm 6.35 mm 3.17 mm 12.7 mm 6.35 mm 25.4 mm 0.0 Pfill 70 bar Knitline Uniform HMF 18
19 Flow Experimental Investigation Marker strands (conductive silver paint) Micro-CT Marker strands Heat + Pressure X-ray source 19
20 Micro-CT Scans sample A prior to squeeze flow 5 mm sample A after squeeze flow 5 mm 20
 DLF can be modelled as a Bingham fluid")
21 Experimental Observations N Initial thickness N Thickness (mm) N Final thickness Time (s) DLF can be modelled as a Bingham fluid 21
22 Simple Flow Model Validation 25 Load (kn) Small Strands - Expe Small Strands - Model Medium Strands - Expe Medium Strands - Model Large Strands - Expe Large Strands - Model DLF AIR DLF 5 0 0,0 0,1 0,2 0,3 0,4 0,5 0,6 Final Strain AIR 22
23 Flow Design Chart Initial charge dimension 0,24 Deformation h i L i W : width Final dimension L f h f Initial Sample Aspect Ratio h i /L i 0,22 0,20 0,18 0,16 0,14 0,12 0,10 0,08 0,1 0,2 0,3 0,1 0,4 0,2 0,5 0,3 0,6 0,4 0,5 0,7 0,6 DDDDDDDDDDDDDDDDDDDDDD = 1 h ff h ii 0, Effective Pressure F/W*L i (bar) 23
24 Moulding a DLF part Quality Characterization Final part Material placement Cooling Heat + pressure Material flow Voids reduction 24


25 Void Content (rib section) Performed using X-Ray Microtomography (micro-ct) Volumetric void content Micro-CT 2D cross section Micro-CT 3D view 25
26 Void Content T processing = 400 C Void content (%) P fill 3.17 mm 6.35 mm 3.17 mm 12.7 mm 6.35 mm 25.4 mm % Void minimum Processing pressure (bar) 26


27 Void Content Void reduction 3 mm 3 mm 20 bar 70 bar Strand size : 3.17 mm 12.7 mm 27

28 Defect Formation Model Shrinkage Shrinkage T < = T processing Cold side Hot side In-plane temperature variation Non-uniform shrinkage Indirect compaction in a complex feature 28
29 Differential Scanning Calorimetry Prepreg flakes ~4 mm 2 inserted in DSC pans Cooling rates: 1, 5, 10, 20 C/min Volume fraction crystallinity, X vc Temperature ( C) 1 C/min 5 C/min 10 C/min 15 C/min 20 C/min 29
![Thermomechanical Analysis Continuous fibre specimen [45/ 45/0/90] 4S Out-of-plane thermal shrinkage during cooling (1 C/min) Thermal strain, 33 (%) 10](/docs-images/89/97832042/images/30-0.jpg "Macro-expansion probe Heating Cooling 8 Specimen 6 4 2 Quartz discs 44 / C 1247 / C 258 / C ε 33 ε 11 = ε 22 0 0 50 100 150 200 250 300 350 400 Temperature")
30 Thermomechanical Analysis Continuous fibre specimen [45/ 45/0/90] 4S Out-of-plane thermal shrinkage during cooling (1 C/min) Thermal strain, 33 (%) 10 Macro-expansion probe Heating Cooling 8 Specimen Quartz discs 44 / C 1247 / C 258 / C ε 33 ε 11 = ε Temperature ( C) 30
31 Thermomechanical Analysis Thermal strain, 33 (%) Total Amorphous phase Crystalline phase Temperature ( C) 1 C/min 5 C/min 10 C/min 15 C/min 20 C/min εε 33 = (1 VV ff )(1 + εε aa + εε cc ) Transverse shrinkage of the amorphous phase Transverse shrinkage of the crystalline phase 31
![Dynamic Mechanical Analysis Continuous fibre specimen [0] 24 Transverse modulus during cooling (1 C/min) L = 50 mm, F = 1 Hz, Strain = 0.](/docs-images/89/97832042/images/32-0.jpg "1% Storage modulus, E 33 (GPa) 10 8 6 4 2 ecimen 0 0.00 0 50 100 150 200 250 300 350 400 Temperature ( C) Storage modulus Tan delta 0.25 0.20 0.15 0.")
32 Dynamic Mechanical Analysis Continuous fibre specimen [0] 24 Transverse modulus during cooling (1 C/min) L = 50 mm, F = 1 Hz, Strain = 0.1% Storage modulus, E 33 (GPa) ecimen Temperature ( C) Storage modulus Tan delta Tan delta 32
33 Transverse Modulus Modelling Modulus (GPa) C/min 5 C/min 10 C/min 15 C/min 20 C/min EE 33 TT = VV ff EE ff + Temperature ( C) 1 VV ff XX vvvv TT EE cc + 1 XX vvvv TT EE aa 1 33


34 Effect of Cooling Pressure Case A 70 bar Case B 10 bar 0.1 mm 0.1 mm 1.0 mm 0.05% 1.0 mm 0.7% 34


35 Types of Defects 0.3 mm 0.3 mm Surface roughness Voids agglomerated at the surface Interply voids 0.3 mm 0.3 mm Large void in resin-rich area 35


36 Effect on Mechanical Properties Void Content Compressive Strength Reduction Flexural Strength Reduction PLT: 300 C 0.05% 4% +4% 0.57% 15% 12% PLT: 310 C 1.32% 25% 15% PLT: 320 C PLT: Pressure Loss Temperature Average Literature 27% per percent void 4.5% per percent void 15% per percent void 1.5% per percent void 36
37 Model Schematic ANSYS Mechanical APDL Component Elements Degrees of freedom Composite SOLID226 UX, UY, UZ, TEMP Mould platens CONTA174 TARGE170 UZ z y x Plane of symmetry Mould platens Composite 100 mm 50 mm 37


38 Model Flowchart Temperature distribution Cooling rate Time step Update modulus Update thermal shrinkage Solve pressure distribution Identification of low pressure regions 38


")

39 Model Validation Pressure: 10 bar No pressure loss PLT ( C) Pressure: 30 bar No pressure loss PLT ( C) 39

")

40 Model Validation Pressure: 50 bar No pressure loss PLT ( C) Pressure: 90 bar No pressure loss PLT ( C) 40
41 Moulding a DLF part Quality Characterization Final part Material placement Application of guideline Cooling Heat + pressure Material flow Voids reduction 41


42 Demonstrator Design Demonstrator should encompass the following : Curvature Thickness variations Abrupt Thickness Variations Ribs/Flanges Sharp Corners 42


43 Design Approach Simple analytical modelling Processing trials Mechanical testing Detailed FE modelling Strand 43

44 Experimental results tensile strength To profit from higher properties: Small strands, thick features allowable strength = XX 2ss CF ROS Longitudinal strain 44
45 Experimental results modulus Tensile properties, which are easy to measure, can be used to approximate compressive and shear properties Effect of strand size on modulus GG = EE νν Strand length x width [mm] 45
46 Experimental results strength Tensile properties, which are easy to measure, can be used to approximate compressive and shear properties Effect of strand size on strength Strand length x width [mm] 46

47 Bracket Design 47


48 General Mould Design Guidelines Avoid knitline formation Knitline Vs. 48

49 Flow Guideline - Flanges hi? Li 49
50 Flow Design Chart Initial charge dimension: 0,24 h i /L i = 0.08 Deformation for flange filling: 0.2 Initial Sample Aspect Ratio h i /L i 0,22 0,20 0,18 0,16 0,14 0,12 0,10 0,1 0,2 0,3 0,4 0,5 0,6 0,5 0,7 0,6 Target pressure = 15 bar 0,08 0,06 0,1 0,2 0,3 0, Effective Pressure F/W*L i (bar) 50
 1.0 0.8 0.6 0.6 (20 bar,390 C) 0.55% void 0.")
51 Rib Filling Process Map 400 Col 3 Void content (%) Processing temperature ( C) *Unfilled rib (5 bar,385 C) (20 bar,390 C) 0.55% void Processing pressure (bar) 51

52 Defect Formation Guidelines Modelling pressure distribution on the rib section of a complexshape part 3.2 mm 52
53 Effect of Cooling Strategy Average rib pressure as a function of the rib temperature Average rib pressure (bar) bar 100 bar 150 bar 200 bar Average rib pressure (bar) bar 100 bar 150 bar 200 bar Rib temperature ( C) Flange cooled before the rib Rib temperature ( C) Flange cooled after the rib 53
54 Bracket Mould Insulation Cooling channels Punch Frame Heating cartridges Locating pin (frame) Die set Machine clamp 54


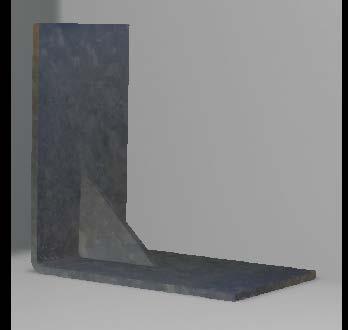
55 Composite Bracket t flange = 6.40 mm 55


56 Mechanical Testing ASTM D6415 Composite bracket Aluminum bracket (t flange = 6.35 mm) 56
57 Mechanical Testing Results 1.4 Normalized specific stiffness COMPOSITE ROS ALU 57


58 Micro-CT Surface defects 58


59 Process Cycle Optimization Baseline 100 bar 200 bar Optimized 100 bar 200 bar 59
60 Fast Moulding Cycle Start with mould at 290 C Place material and heat mould to 380 C + dwell for 2 min Cool at 20 C/min to 290 C Release pressure and eject the part (T < 290 C) Temperature ( C) Time (min) 60


61 Other Issues Measured Warpage Dimensional stability Hybrids Recycling 61


62 Warpage Control Thin Parts x 3.18 mm Strands - Flat 12.7 x 12.7 mm Strands - Flat 6.35 x 3.18 mm Strands - Ribbed 12.7 x 12.7 mm Strands - Ribbed Warpage (mm) Panel Thickness (mm) 62

 R-T-R")
")
63 Hybrids Random Strands and Continuous Tapes Tapes-R-Tapes T-R-T -R-Tapes (T-R-T) R-Tapes-R (R-T-R) R-T-R R-Tapes-R (R-T-R) Strand waviness control Tapes-R (T-R) T-R Mechanical properties 63


![[0 /90 ]](/docs-images/89/97832042/images/64-2.jpg "6 DLF 24%")


64 Hybrid DLF-Tape Flow Control [0 /90 ] 6 DLF 24% increase in pull-out strength 64
65 Recycling TP Composites (parts, trimmings) Fibre Extraction Grinding or Cutting Resin Impregnation Virgin TP Composites Moulding Process Recycled TP Composites Part 65

66 Approach Original part Recyclate Recycled part 66

67 Results Trimmings Recycling Normalized Flexural Strength Trimmings dimensions mm 6.35 mm 3.17 mm % Recycled Material 67
68 Conclusions Process feasibility was demonstrated Process challenges were identified Mould filling / consolidation Dimensional stability New methods were developed Experimental: DIC, Micro-CT, Thermography Simulation: Flow, compaction, residual stresses High variability of properties even for flat panels Extensive experimental campaign is required to obtain allowables Size and spatial effects are key Design guidelines can be developed with lab-scale tools Final part performance is strongly linked to processing 68


69 Acknowledgements Students and researchers of the CRIAQ COMP 412 and CARIC MANU 724 Projects 69

70 Thank you! 70