ENGR 151: Materials of Engineering LECTURE #14: PHASE DIAGRAMS
|
|
|
- Maximilian Douglas
- 5 years ago
- Views:
Transcription
1 ENGR 151: Materials of Engineering LECTURE #14: PHASE DIAGRAMS
2 ANNOUNCEMENTS Midterm #2 Monday, May 1. Review on Wednesday, April 26. Chapters 4, 6, 7, 8
3 TERMINOLOGY Phase: Homogeneous portion of a system that has uniform physical and chemical characteristics E.g. Sugar-water solution is one phase, solid sugar is another Single-phase system Homogeneous Multi-phase system Heterogeneous (Mixture) Change in physical and/or chemical properties from one phase to another Phase Equilibrium Temporal constancy of the phase characteristics of a system
4 SUGAR-WATER PHASE DIAGRAM
5 ONE-COMPONENT PHASE DIAGRAM Unary Diagram Pressure-temperature diagram for water
6 ONE-COMPONENT PHASE DIAGRAM Does the diagram support the fact that food takes longer to cook at higher elevations? Triple point all three phases coexist simultaneously Any deviation from this point causes one or more of the three phases to vanish
7 BINARY PHASE DIAGRAMS Temperature and composition of mixture are varied at constant pressure Describe how the microstructure of an alloy vary Ni-Cu system This system is isomorphous because of the complete liquid and solid solubility of the two components
8 EXAMPLE COPPER-NICKEL PHASE DIAGRAM
9 BINARY ISOMORPHOUS SYSTEMS Metallic alloys are designated by lowercase Greek letters (α, γ, β, etc.) Liquidus line: line separating L and α+l regions Solidus line: line separating α and α+l regions L is a homogeneous liquid solution composed of both Cu and Ni The α phase is an substitutional solid solution consisting of both Cu and Ni atoms FCC crystal structure
10 LIQUIDUS AND SOLIDUS LINES Intersect at composition extremities (melting temperatures) On the left axis, pure copper remains solid until melting point (α L) Alloys have an extended melting phenomenon (α α+l L) Occurs over range of temperatures between solidus and liquidus lines Both solid α and liquid phases will be in equilibrium in the region between solidus and liquidus lines
11 INTERPRETING PHASE DIAGRAMS Information we get: Phases, compositions, percentages of the phases Locate these points: 60 wt% Ni - 40 wt% 1100 C 35 wt% Ni - 65 wt% 1250 C
12 PHASE COMPOSITIONS Locate temperature-composition point on the phase diagram Easy to figure for α, L phase More complicated for α+l phase Both α and L within α+l are composed of varying compositions of alloy metals
13 PHASE COMPOSITIONS Within two-phase region: Draw tie line (horizontal) at alloy temperature Note the phase boundaries Record compositions at each intersection (C L, C α = phase composition)
14 PHASE COMPOSITIONS Example: 35 wt% Ni - 65 wt% 1250 C C L = 31.5% Ni, 68.5% Cu C α = 42.5% Ni, 57.5% Cu
15 PHASE AMOUNTS Easy within single phase regions α and L (100%) Within α+l region, use lever rule: Find your tie line Fraction of one phase: length of tie line from point to other phase boundary divided by total tie length Length = wt% or at% composition

16 PHASE AMOUNTS Mass fractions:
17 PHASE AMOUNTS

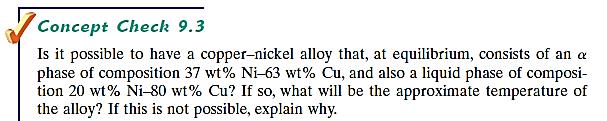
18 CONCEPT CHECKS (PG. 292)
19 CONCEPT CHECKS (PG. 292)

20 CONCEPT CHECKS (PG. 292)

21 CONCEPT CHECKS (PG. 292)

22 DERIVATION OF LEVER RULE

23 DERIVATION OF LEVER RULE

24 VOLUME FRACTION Can also specify phase amount in terms of volume rather than mass, referring to the two phases as α and β
25 SUMMARY Compositions of phases: expressed in terms of weight percents of the components If two phases are present, utilize tie line to determine compositions of phases Fractional phase amounts: utilize lever rule to find fractional amounts of either phase
26 MICROSTRUCTURE DEVELOPMENT (ISOMORPHOUS ALLOYS) Equilibrium Cooling Very slow as to maintain equilibrium throughout (allows for phase diagram usage) Corresponds to vertical movement down phase diagram
27 EQUILIBRIUM COOLING Solid α begins to form at liquidus line Solid increases as temperature decreases Liquid solidifies completely at solidus line No microstructural change will occur within any part of α or L region.
28 NONEQUILIBRIUM COOLING Processes that do not allow the system to equilibrate create differences in phase diagrams In practice, cooling rates for equilibrium are much too slow Non-Equilibrium cooling retains more L as temperature drops, lowering solidus line