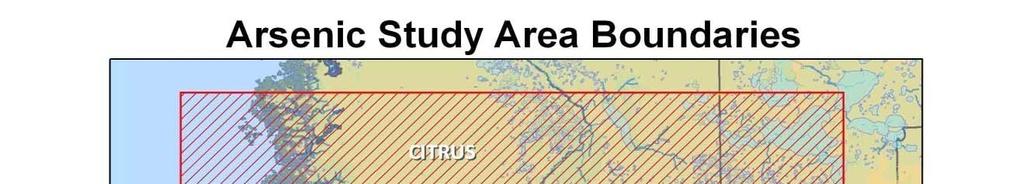
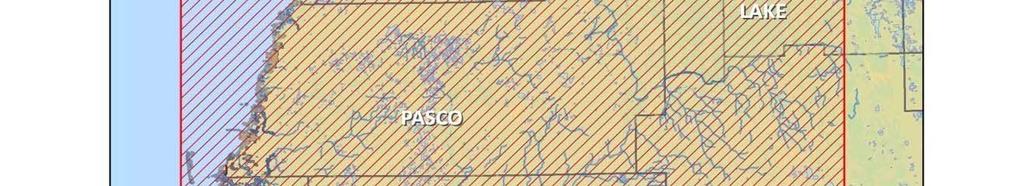
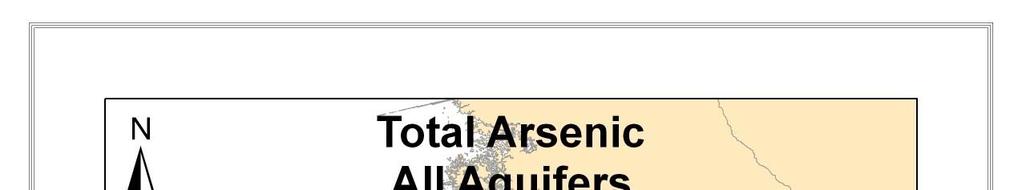
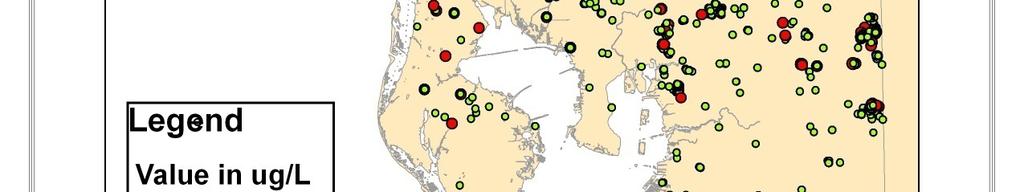
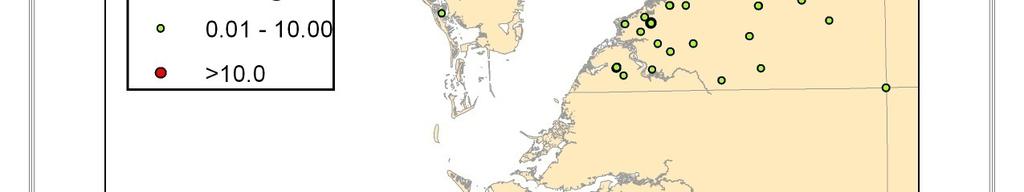
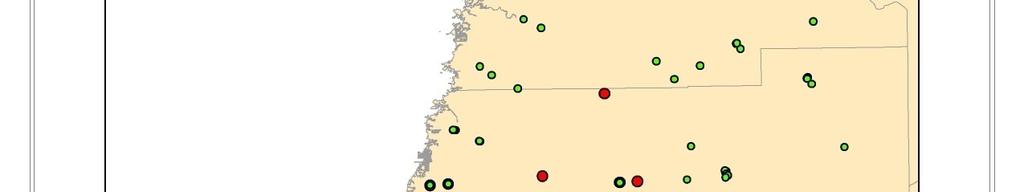
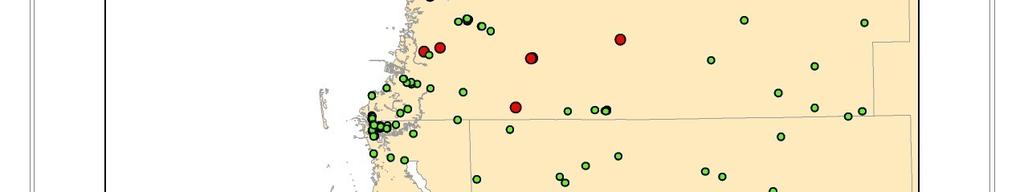
Arsenic Detections. Florida 1995 to 2008 data. As exceedance (> 10 ug/l) As detection (< 10 ug/l) (Author Unknown)
|
|
|
- Shona Gaines
- 5 years ago
- Views:
Transcription

1 Characterization of Natural and Anthropogenic Sources of Arsenic and other Trace Metals in Florida s Florida s Aquifers J. Arthur, C. Fischler, R. Copeland, P. Hansard Florida Geological Survey October, 2009
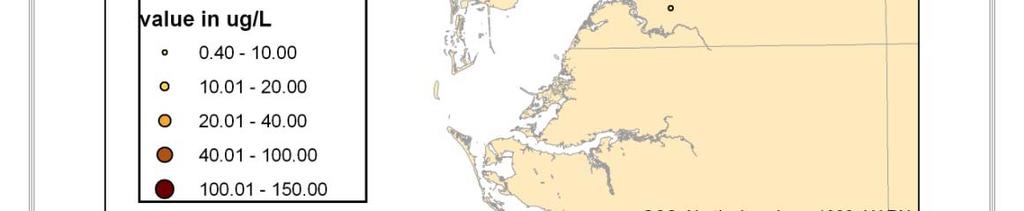
2 Arsenic Detections Potable Well Sampling Florida 1995 to 2008 data As exceedance (> 10 ug/l) As detection (< 10 ug/l) (Author Unknown)
3 Arsenic Non Detects Potable Well Sampling Florida 1995 to 2008 data As not detected (Author Unknown)


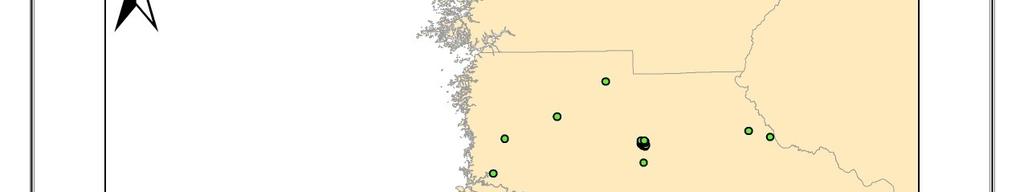
4 All wells sampled for arsenic in FDEP s old Ambient Monitoring i Program (Modified from D. Harrington)
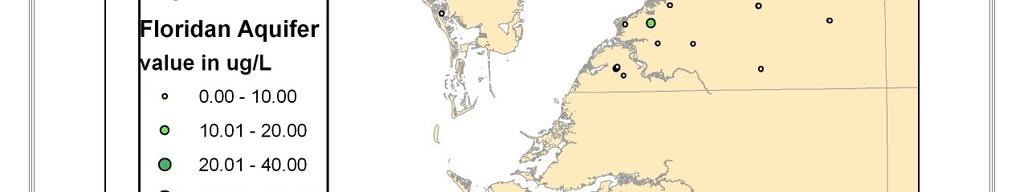
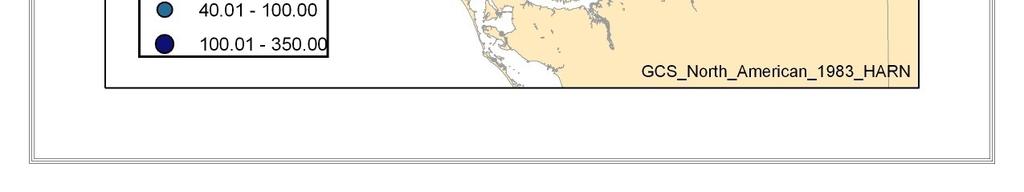
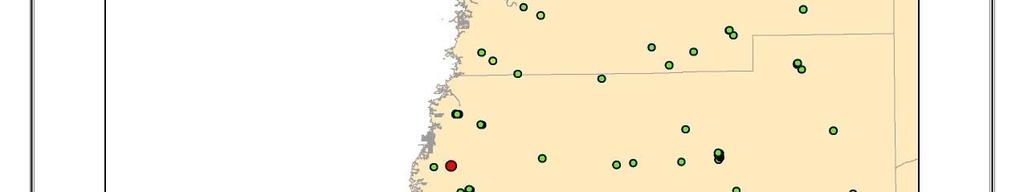
5 Ambient program well hits > 10 ug/l arsenic (Green = FAS; Blue = IAS; Other colors = SAS) 152 of % exceeds MCL (Modified from D. Harrington)
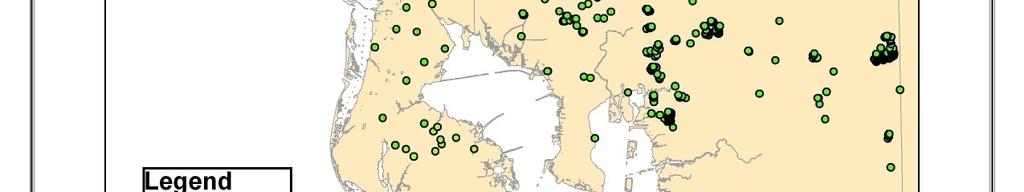
6 (Modified From D. Harrington) Ambient Monitoring Program; > 10 ug/l arsenic SW District
7 Aquifer Storage and Retrieval NGW LDO 100 As (ug/l)


8
9 Four- Phase Investigation Characterization of Natural and Anthro- pogenic Sources of Arsenic and other Trace Metals of Concern in Florida s Aquifer Systems A Multiphase Approach


10
11 Investigation Sponsored by: Ground Water Protection Section FDEP Watershed Monitoring Section - FDEP Florida Geological Survey FDEP Southwest Florida Water Management District
12 Purpose 1. Improve the understanding of the distribution of arsenic, and other trace metals, in aquifers (both in GW and in the matrix material) 2. Develop an improved understanding of the mechanisms for trace metal occurrence
13 Purpose 3. Identify aquifer conditions which are: (1) most and (2) least favorable for trace metal mobilization 4. Determine what anthropogenic activities can lead to the mobilization of trace metals; and the magnitudes of those impacts
14 Purpose 5. Determine where anthropogenic activities are most and least likely to cause violations of the state s MCLs 6. Develop screening level thresholds for trace metals that are representative of significant anthropogenic impacts
15 Phase I (8/07 (8/07 9/08) 9/08)- Compilation and Analysis of Existing Data (Note We knew some tasks were not doable) a. Descriptive statistics b. Spatial evaluation by aquifer system c. Temporal analyses (if sufficient data) d. Definition of GW types e. Maps of constituent concentrations f. Whole rock geochemical analyses
16 Phase II (10/08 09/09) - Prelim. Water and Rock Chemistry Data Analyses Develop methodologies for analyses in GW and the Aq. Matrix Material for each aquifer system (SAS, IAS, FAS) Obtain Additional Core Data
17 Prelim. Water and Rock Chem. Data Analyses Rock a. Major, Trace, and Rare Earth Elements, Carbon, organic Carbon, CO2, S, SO4, HG b. Scanning electron microscopy thin sections, backscatter electron imagery, major element map c. Elemental analysis of minerals d. Mineralogical i l characterization ti of cores
18 Prelim. Water and Rock Chem. Data Analyses GW a. Major cations (Ca, Mg, Na, K) b. Major anions (Alk, Cl, SO4) c. PO4, TDS, and Field analytes d. Trace metals ( 50 including As)
19 Prelim. Water and Rock Chem. Data Analyses GW Two sampling Episodes May/June (Low) and Sept/Oct (High) Evaluate interactions of: (a.) WL (H and L); (b) Aquifers (SAS, IAS, FAS); and (c) land use (several categories) on As concen..ingw
20 Phase III and IV (Oct 2009 Sept 2011) a. Analysis of additional data b. Development of models c. Improve understanding of conditions favorable for trace metal mobilization d. Influence of man-induced activities e. Develop screening levels for trace metals that are indicative of man-induced impacts
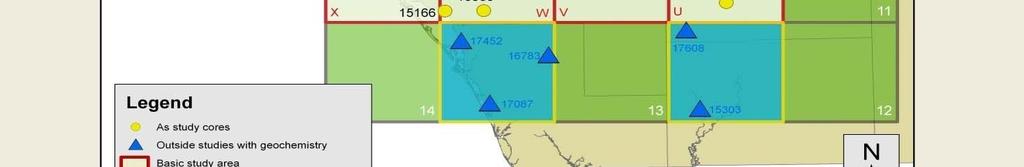
21 Status t Status (Phases I and into Phase II) Geochemical Analyses Whole rock geochemical analysis 22 existing cores New core (after Oct 1)


22
23
24 Cores - Descriptive e Statics Cr Hg Cu Ni Co Pb ppm ppm ppm ppm ppm ppm SAS Mean Med IAS Mean Med FAS Mean Med
25 SAS /L) NCENTRATIONS (ug/ Cr Hg Cu Ni Co Pb 0 10 CO IAS TRATIONS (ug/l) Cr Hg Cu Ni CONCENT Co Pb FAS FAS TIONS (ug/l) Cr Hg Cu CONCENTRAT Cu Ni Co Pb
26 Cores - Descriptive e Statics As Mo U Sb Fe ppm ppm ppm ppm ppm SAS Mean Med IAS Mean Med FAS Mean Med
27 SAS S (ug/l) As Mo CONCENTRATIONS U Sb Fe 0 IAS NCENTRATIONS (ug/l) As Mo U Sb Fe CON FAS ATIONS (ug/l) As Mo U CONCENTRA U Sb Fe
28 40 As (p ppm) r = r = r = Fe 2 O 3 (%) FAS IAS SAS Linear (FAS) Linear (IAS) Linear (SAS) As (ppm) 40 r = r = Mo (ppm) FAS IAS Linear (IAS) Linear (FAS) As (ppm) 40 r = r = r = U (ppm) FAS IAS SAS Linear (FAS) Linear (IAS) Linear (SAS)
29 40 As (ppm) 35 r = r = r = Sb (ppm) FAS IAS SAS Linear (IAS) Linear (FAS) Linear (SAS) 40 As (ppm) 35 r = r = r = P 2 O 5 (%) FAS IAS SAS Linear (FAS) Linear (IAS) Linear (SAS) S (%) r = r = r = Fe 2 O 3 (%) FAS IAS SAS Linear (IAS) Linear (FAS) Linear (SAS)
30 Averag ge Depth (ft Concentrations (ug/l) SAS 50 )Cr 100 Co IAS FAS Ni Cu Th U Hg
31 Concentrations ti (ug/l) SAS Average Depth (ft) IAS FAS As Mo Sb Se d
32 ge Depth (f ft) Avera Concentrations (%) SAS IAS FAS CaO C S
33 SAS IAS FAS c / conc of all medians Log con SiO2 Fe2O3 MgO CaO K2O P2O5 MnO TOTAL C CO 2 Total S V Cr Co Ni Cu As Mo Cd Sb Hg Pb Th U La Eu Lu Log-normalized ratio of the median concentrations for each Aquifer System to the median of all samples (for selected constituents).
34 Cu MnO Hg S Cr Th Ba Nb TiO2 Zr CO2 Zn SAS MgO U CaO Co V Ni Sr La P2O5 As Lu Fe2O3 K2O Cs SiO2 A l2o Variables F Similari ity
35 CO2 CaO MgO Mo Sb Sr As Hg S V U IAS Fe2O3 Al2O3 Th Tl Ni Zr Cu Zn La Lu Y P2O5 MnO Cr Co Nb TiO2 Ba K2O SiO Variables Similari ity

36


37

38


39


40


41
42
43
44 Phase III: Water-rock rock equilibrium u modeling (10/09 09/10) Continued analyses of matrix and water quality data Commence development of equilibrium models in order to determine anomalous chemical concentrations that may be due to anthropogenic effects
45 Phase IV: Upscale project (10/10 09/11) Finalize setting of screening thresholds h for anthropogenic input Depending on available funding, potentially expand project to: 1. Other portions of Florida (e.g. CERP)
46 Phase IV: Upscale project (10/10 09/11) 2. Revise Florida s Groundwater Quality Monitoring Program: Background Hydrogeochemistry (FGS Special Pub 34) 3. Develop a separate document for trace metal hydrogeochemistry
47 Questions? Rick Copeland (850)